

Abstract
The latent HIV-1 reservoir of memory CD4+ T cells that persists during combination antiviral therapy prevents a cure of infection. Insight into mechanisms of latency and viral reactivation are essential for the rational design of strategies to reduce the latent reservoir. In this study, we quantified the levels of >2,600 proteins in the CCL19 primary CD4+ T cell model of HIV-1 latency. We profiled proteins under conditions that promote latent infection and after cells were treated with phorbol 12-myristate 13-acetate (PMA) + ionomycin, which is known to efficiently induce reactivation of latent HIV-1. In an analysis of cells from two healthy blood donors, we identified 61 proteins that were upregulated ≥2-fold, and 36 proteins that were downregulated ≥2-fold under conditions in which latent viruses were reactivated. These differentially expressed proteins are, therefore, candidates for cellular factors that regulate latency or viral reactivation. Two unexpected findings were obtained from the proteomic data: (1) the interactions among the majority of upregulated proteins are largely undetermined in published protein–protein interaction networks and (2) downregulated proteins are strongly associated with Gene Ontology terms related to mitochondrial protein synthesis. This proteomic data set provides a useful resource for future mechanistic studies of HIV-1 latency.
Keywords: : HIV, latency, reactivation, proteomics, CCL19 model
Introduction
Although combined antiretroviral therapy (cART) can suppress HIV-1 replication in infected individuals, cessation of cART almost invariably results in re-emergence of active HIV-1 replication from a long-lived latent viral reservoir.1 There is consequently an ongoing research effort to develop a strategy termed “shock and kill” to attack the latent reservoir. It is hoped that small molecules can be developed to “shock” latent viruses into expressing viral antigens. The “kill” involves stimulating the immune system's ability to recognize HIV-infected cells, which in combination with cART can reduce the number of latently infected cells and clear reactivated virus, perhaps resulting in a functional or even complete cure.
The best described latent reservoir consists of long-lived memory CD4+ T cells that contain replication-competent proviruses that are transcriptionally silent.2 Development of the “shock” component of a cure strategy is greatly facilitated by the availability of primary CD4+ T cell models of HIV-1 latency. Although these models do not recapitulate all of the features of latently infected cells obtained from patients ex vivo,3 they can be used to investigate mechanisms involved in the establishment and maintenance of latent infection (e.g., Refs. 4,5). In addition, primary CD4+ T cell models allow evaluation of small molecules as latency reactivation agents (LRAs).
A convenient primary CD4+ T cells model has been developed by Lewin and colleagues.6,7 In this model, resting CD4+ T cells are treated with the chemokine CCL19, resulting in conditions in which the cells support high levels of latent infection that can be efficiently reactivated by T cell activation. The CCL19 model has been used to evaluate the ability of histone deacetylase inhibitors (HDACis) and other small molecules to reactivate latent HIV-1.3,8,9 We used this model recently to evaluate the ability of HDACis to upregulate an RNA polymerase II (RNAP II) elongation factor termed P-TEFb that is a cofactor for the viral Tat protein.10 P-TEFb is downregulated in resting CD4+ T cells that harbor latent HIV-1 and its upregulation is required for viral reactivation.4,5
Proteins that are either upregulated or downregulated when latent viruses are reactivated are candidates for important regulatory factors of latency or viral reactivation. Transcriptional profiling of mRNA levels in primary CD4+ T cell models of latency can provide clues to the identities of such important proteins. However, the correspondence between the levels of mRNAs and their encoded proteins is generally poor and has been shown to have only a 40% explanatory power.11,12 Studies of mechanisms involved in HIV-1 latency will, therefore, benefit from identification of differences in the proteome between cells harboring latent virus and cells with reactivated virus.
In this study, we conducted a proteomic profile of the CCL9 model of latency. We quantified the levels of >2,600 proteins in CCL19-treated CD4+ T cells from two blood donors under conditions that promote latent infection and after cells were treated with phorbol 12-myristate 13-acetate (PMA) + ionomycin, which is known to induce reactivation of latent HIV-1. We identified 61 proteins that are upregulated ≥2-fold, and 36 proteins that are downregulated ≥2-fold, when latent viruses are activated. Two upregulated and two downregulated proteins were analyzed in immunoblots to validate the proteomic data. This data set provides a useful resource for future mechanistic studies.
Materials and Methods
Resting CD4+ T cells were isolated from two healthy blood donors by negative selection from peripheral blood of healthy donors by the Rosettesep CD4+ cells isolation kit (STEMCELL Technologies, Inc.). Cells were cultured for 3 days in the presence of CCL19 (10 nM; PeproTech, NJ) in RPMI-1640 supplemented with 10% fetal bovine serum and 10 U/ml IL-2; cells were then infected with an HIV-1 NL4.3-Luciferase reporter virus (NL4-3.Luc.R-E-; from NIH AIDS Reagent Program; virus also deleted for Nef; catalog no. 3418) and incubated for 2 days and then treated with and without 10 ng/ml PMA +1 μM ionomycin for 16 h at which time cell extracts were prepared for proteomic profiling. A portion of cells was assayed for Luciferase expression to verify successful reactivation of latent HIV-1.
Proteomic analysis pipeline
Proteomic profiling of whole cell extracts was performed by the Baylor College of Medicine Mass Spectrometry Proteomics Core Laboratory as described previously.13,14 After several quality control steps, a total of 2,617 proteins were quantified. Proteomic data are presented in Supplementary File S1 (Supplementary Data are available online at www.liebertpub.com/aid). The experimental measures of the proteomic data included the number of peptide spectrum matches (PSM), the number of peptide sequences (Peptide Count), the area under the reporter peaks (Area), and the intensity-based absolute quantification. For quality control, we filtered the data such that the changes in PSM and Area are consistent between the control and the treatment groups (i.e., for a protein, we kept the data if both PSM and Area increase or decrease together). The log2-fold changes were calculated based on the ratios between the Areas of the treatment group and the Areas of the control group. The two donors were treated as independent and identically distributed (i.i.d.) samples and their log2-fold changes were pooled to identify the differentially expressed proteins, using a robust fold change rank ordering statistical method called fcros.15 The top 100 upregulated or downregulated proteins selected using fcros were further filtered such that the proteins with a zero-fold change in any one of the two donors were removed. The final list of the differentially expressed proteins is given in Supplementary File S2. We then conducted the enriched pathway analysis using SPIA,16 an impact analysis method that combines both the enrichment and perturbation p values. The results are reported in Supplementary File S3. Hypergeometric test was used to detect Gene Ontology (GO) term associations with upregulated or downregulated proteins,17 and results are presented in Supplementary Files 4 and 5. Finally, we obtained the human protein–protein interaction (PPI) network from the iRefIndex database,18 which incorporates a number of mainstream PPI databases such as HPRD19 and InnateDB.20 The subnetwork associated with the upregulated proteins was extracted from the human PPI network and shown in Figure 3.
FIG. 3.
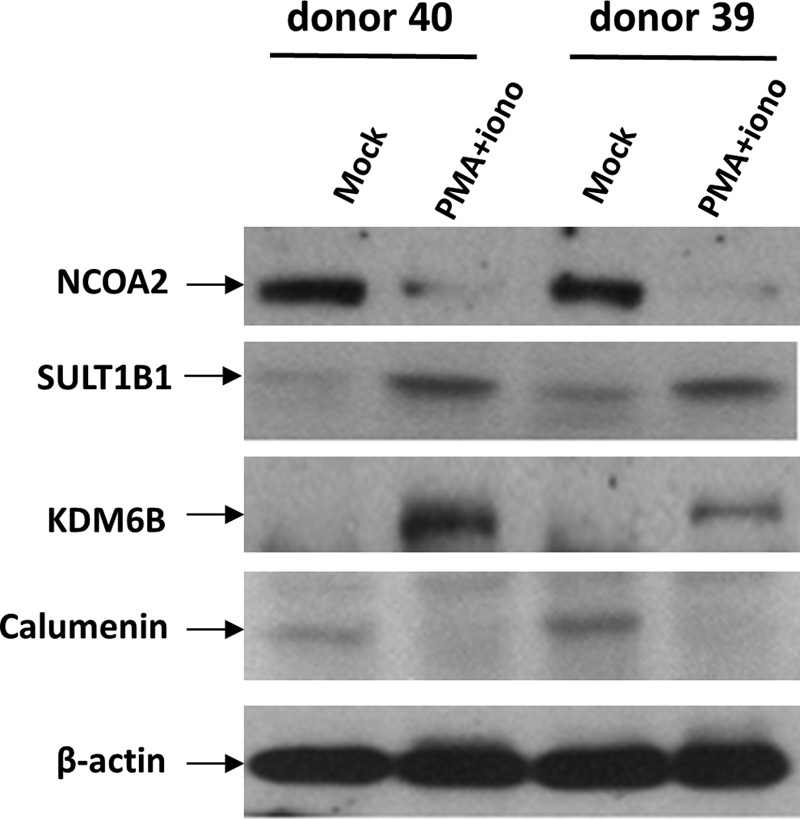
Immunoblot validation of proteomic data. Resting CD4+ T cells were isolated from two healthy blood donors. Cells were cultured in the presence of CCL19 and subsequently activated with PMA + ionomycin as described for cells processed for proteomic profiling. After activation for 16 h, cell extracts were prepared and immunoblots performed to quantify the levels of indicated proteins.
Immunoblots
Antisera used in immunoblots were NCOA2 from BD Biosciences (mouse, catalog no. 610984, used at dilution of 1:2,000); SULT1BI from R&D Systems (sheep, catalog no. AF5959, used at dilution of 1:1,000); KDM6B from Abcam (rabbit, catalog no. Aba169197, used at dilution of 1:2,000); Calumenin from Santa Cruz Biotechnology (mouse, catalog no. SC-271357, used at a dilution of 1:1,000); and β-actin from Abcam (mouse, catalog no. AB3280, used at a dilution of 1:5,000).
Results
Resting CD4+ T cells were isolated from two healthy blood donors and cultured with CCL19 for 3 days to establish conditions that promote latent HIV-1 infection. Cultures were infected with an HIV-1 NL4.3-Luciferase reporter virus and incubated for an additional 2 days as described in Materials and Methods section. Cultures were then stimulated with and without PMA + ionomycin for 16 h at which time total cell extracts were prepared for proteomic profiling. PMA + ionomycin were chosen as the activation method as it has been used as a standard to which the potencies of LRAs have been compared.21 Portions of cell extracts were assayed for Luciferase expression to verify successful reactivation of latent HIV-1 (not shown). Proteomic profiles of cell extracts were determined as described in Materials and Methods section. Proteomic data are presented in Supplementary Files S1 and S2. It should be noted that only a fraction of cells in cultures were infected with the HIV-1 reporter virus. Therefore, the proteomic profiles reflect changes in the bulk cultures of unstimulated CC19-treated versus CCL19-treated and activated CD4+ T cells.
Upregulated proteins
Proteins that were either upregulated or downregulated ≥2-fold in both donors after activation of CCL19-treated cells are listed in Tables 1 and 2, respectively. The magnitudes of upregulated or downregulated proteins are shown in Figures 1 and 2, respectively. Upregulated proteins include 10 proteins that likely function as RNAP II transcription factors: AHR, EGR2, ZFX, TFCP2L1, TBX21, CXXC1, MEAF6, UNK, TAF8, and TAF1L. These proteins are candidates for cellular factors that regulate viral latency, either through direct or indirect effects on RNAP II transcription of the integrated provirus. KDM6B (JMJD3) is a notable upregulated protein; KDM6B is a lysine-specific demethylase with activity for dimethylated or trimethylated lysine 27 of histone H3 (H3K27me2 or H3K27me3). As these H3 methylations are repressive chromatin marks, KDM6B may play a role in reactivation of latent HIV-1 through its H3K27 demethylase activity.
Table 1.
Upregulated Proteins
| Gene symbol | Protein | Gene symbol | Protein | ||
|---|---|---|---|---|---|
| 1 | AHR | Ary hydrocarbon receptor | 32 | CXXC1 | CXXC finger protein |
| 2 | CD40LG | CD40 ligand | 33 | NAA20 | N(alpha)-acetyltransferase 20, NatB catalytic subunit |
| 3 | CTNNB1 | Catenin beta 1 | 34 | ANKRD39 | Ankyrin repeat domain 39 |
| 4 | EGR2 | Early growth response 2 | 35 | WHSC1 L1 | Wolf–Hirschhorn syndrome candidate 1-like 1 |
| 5 | GNAI1 | G protein subunit alpha i | 36 | VPS13D | Vascular protein sorting 13 homologue D |
| 6 | GZMK | Granzyme K | 37 | CHD7 | Chromodomain helicase DNA binding protein 7 |
| 7 | IRF8 | Interferon regulatory factor 8 | 38 | TXLNG | Taxilin gamma |
| 8 | JAK2 | janus kinase 2 | 39 | PPP2R2D | Protein phosphatase 2 regulatory subunit B delta |
| 9 | CTSA | Cathepsin A | 40 | DUS3L | Dihydrouridine synthase 3 like |
| 10 | SDCBP | Syndecan binding protein | 41 | SDR39U1 | Short chain dehydrogenase/reductase family 39U member 1 |
| 11 | SNRPC | Small nuclear ribonucleoprotein polypetide C | 42 | PNPLA2 | Patatin like phospholipase domain containing 2 |
| 12 | SOS1 | SOS Ras/Rac guanine nucleotide exchange factor 1 | 43 | BACH2 | BTB domain and CNC homologue 2 |
| 13 | TNF | Tumor necrosis factor | 44 | PARP12 | Poly(ADP-ribose) polymerase family member 12 |
| 14 | YES1 | YES proto-oncogene,Src family tyrosine kinase | 45 | MEAF6 | MYST/Esa1-associated factor 6 involved in transcriptional activation |
| 15 | ZFX | Zinc finger protein X-linked | 46 | HECTD3 | HECT domain E3 ubiquitin protein ligase 3 |
| 16 | DUSP11 | Dual specificity phosphatase 11 | 47 | FAM103A1 | Family with sequence similarity 103 member A1 |
| 17 | RNASET2 | Ribonuclease T2 | 48 | SESN2 | Sestrin 2 |
| 18 | AIM2 | Absent in melanoma 2 | 49 | ANKRD27 | Ankyrin repeat domain 27 |
| 19 | GGPS1 | Geranylgeranyl diphosphate synthase 1 | 50 | LTV1 | LTV1 ribosome biogenesis factor |
| 20 | SPTLC2 | Serine palmitoyltransferase, long change base subunit 2 | 51 | UNK | Unkempt family zinc finger |
| 21 | AP5Z1 | Adapter-related protein complex 5 zeta 1 subunit | 52 | TRMT10A | tRNA methyltransferase 10A |
| 22 | RGS19 | Regulator of G-protein signaling | 53 | CARD16 | Caspase recruitment domain family member 16 |
| 23 | KDM6B | Lysine demethylase 6B | 54 | OSBPL10 | Oxysterol binding protein like 10 |
| 24 | FBXO28 | F-box protein 28 | 55 | LRRC58 | Leucine-rich repeat containing 58 |
| 25 | ACSL6 | Acyl-CoA synthetase long-chain family member 6 | 56 | TAF8 | TATA-box binding protein-associated factor 8 |
| 26 | ARHGEF18 | Rho/Rac guanine nucleotide exchange factor 18 | 57 | TAF1L | TATA-box binding protein-associated factor 1 like |
| 27 | HECTD1 | HECT domain E3 ubiquitin protein ligase 1 | 58 | PTGR2 | Prostaglandin reductase 2 |
| 28 | SULT1B1 | Sulfotransferase family 1B member 1 | 59 | DTX3L | Deltex E3 ubiquitin ligase 3L |
| 29 | MOCS3 | Molybdenum cofactor synthesis 3 | 60 | NEIL2 | Nei like DNA glycosylase 2 |
| 30 | TFCP2L1 | Transcription factor CP2 like 1 | 61 | BLOC1S2 | Biogenesis of lysosomal organelles complex 1 subunit 2 |
| 31 | TBX21 | TBX21 |
Table 2.
Downregulated Proteins
| Gene symbol | Protein | |
|---|---|---|
| 1 | APBB1 | Amyloid beta precursor protein binding family B member 1 |
| 2 | ARL2 | ADP ribosylation factor like GTPase |
| 3 | CALU | Calumenin |
| 4 | AGFG2 | ArfGAP with FG repeats 2 |
| 5 | MRPL58 | Mitochondrial ribosomal protein L58 |
| 6 | LMO7 | LIM domain 7 |
| 7 | LRPAP1 | LDL receptor-related protein-associated protein |
| 8 | NPAT | Nuclear protein, coactivator of histone transcription |
| 9 | SLC12A2 | Solute carrier family 12 member 2 |
| 10 | TCF7L2 | Transcription factor 7 like 2 |
| 11 | SLMAP | Sarcolemma-associated protein |
| 12 | UNC119 | unc-119 lipid-binding chaperon |
| 13 | ATP6V1F | ATPase H+ transporting V1 subunit F |
| 14 | NCOA2 | Nuclear receptor coactivator 2 |
| 15 | EHMT2 | Euchromatic histone lysine methyltransferase 2 |
| 16 | LPIN1 | Lipin1 |
| 17 | ATP6V0A2 | ATPase H+ transporting V0 subunit a2 |
| 18 | MRPL13 | Mitochondrial ribosomal protein L13 |
| 19 | MRPL35 | Mitochondrial ribosomal protein L35 |
| 20 | ELP6 | Elongator acetyltransferase complex subunit 6 |
| 21 | MRPL16 | Mitochondrial ribosomal protein L16 |
| 22 | C1orf27 | |
| 23 | NUDT11 | Nudix hydrolase 11 |
| 24 | ZNF512B | Zinc finger protein 512B |
| 25 | MRPS11 | Mitochondrial ribosomal protein S11 |
| 26 | DNAJC5 | DnaJ heat shock protein family (Hsp40) member C5 |
| 27 | ARL6 | ADP ribosylation factor like GTPase 6 |
| 28 | IGSF8 | Immunoglobulin superfamily member 8 |
| 29 | ORMDL1 | ORMDL sphingolipid biosynthesis regulator 1 |
| 30 | SFXN4 | Sideroflexin 4 in mitochondrial membrane |
| 31 | FAM210A | Family with sequence similarity 210 member |
| 32 | VKORC1L1 | Vitamin K epoxide reductase complex subunit 1 like 1 |
| 33 | NUDT10 | Nudix hydrolase 10 |
| 34 | CPNE2 | Copine 2 |
| 35 | RALGAPA1 | Ral GTPase activating protein catalytic alpha subunit 1 |
| 36 | GPRIN3 | GPRIN family member 3 |
FIG. 1.

Upregulated proteins. The positive fold change is shown for the indicated 61 proteins in CD4+ T cells from two donors after PMA + ionomycin stimulation of CCL-19-treated cells. The individual donors are indicated by gray and black bars. PMA, phorbol 12-myristate 13-acetate.
FIG. 2.

Downregulated proteins. The negative fold change is shown for the indicated proteins in CD4+ T cells from two donors after PMA + ionomycin stimulation of CCL-19-treated cells. The individual donors are indicated by gray and black bars.
A recent publication used an ultracomplex shRNA screen to identify genes that have roles in HIV-1 latency or reactivation in a Jurkat CD4+ T cell model.22 It should be noted that the properties of HIV-1 latency in Jurkat cell lines can differ from latency in primary CD4+ T cells. Jurkat cells are transformed and grow exponentially, whereas primary CD4+ T cells are quiescent and display only low levels of metabolic processes, including RNAP II transcription and protein synthesis. Nevertheless, it is notable that four of the upregulated proteins shown in Table 1 were found in the shRNA screen to repress latency (promote reactivation) in Jurkat cells: GNAI1, SDCBP, ZFX, and KDM6B. Therefore, induction of these four proteins in CCL19-treated cells may contribute to viral reactivation. Interestingly, BACH2 was identified as an upregulated protein in CCL19-treated cells, and this is of interest as HIV-1 integration into the BACH2 gene has been observed in clonally expanded CD4+ T cells that harbor latent virus in infected individuals treated with cART.23
Downregulated proteins
A notable feature of the set of 36 downregulated proteins (Table 2) is that 5 are involved in mitochondrial protein synthesis: MRPL58, MRPL13, MRPL35, MRLP16, and MRPS11 (Table 2). Although the significance of these differentially expressed proteins to HIV-1 latency and reactivation is unclear, shRNA depletion of MRPL35 was observed to promote latency in Jurkat CD4+ T cells.22 Because the recent ultracomplex shRNA screen found that NPAT and ATP6VOA2 promote HIV-1 latency in Jurkat cells, these two proteins in our downregulated data set are strong candidates as factors that promote latency.
Validation of proteomic data
We performed an immunoblot analysis to determine whether the proteomic data are reliable. Resting CD4+ T cells were isolated from two additional healthy blood donors and cultured with CCL19 as described in Materials and Methods section. Cells were then cultured for an additional 2 days, stimulated with and without PMA + ionomycin for 16 h, and cell extracts were prepared for immunoblots. We examined two proteins identified to be upregulated in the proteomic data—SULT1B1 and KDM6B—and two proteins identified to be downregulated in the proteomic data—NCOA2 and Calumenin. As shown in Figure 3, the immunoblot analysis verified that after activation of CCL19-treated cells, SULT1B1 and KDM6B were upregulated and NCOA2 and Calumenin were downregulated. The immunoblot data indicate that the proteomic profile data are reliable.
KEGG pathways
An analysis of differentially expressed proteins in PMA + ionomycin-stimulated CCL19-treated cells identified activation of several KEGG pathways of significance to HIV-1 reactivation (Table 3 and Supplementary File S3). Activated signaling pathways include NF-κB, MAPK, T cell receptor, TNF, and JAK-STAT. Activation of these pathways likely leads to downstream events that are critical for reactivation of latent virus, such as phosphorylation of the T-loop of CDK9 (catalytic core of P-TEFb) and nuclear translocation of NF-κB and NFAT.24–27
Table 3.
KEGG Pathways
| Pathway ID | Differential expressed proteins | Status | p | Description |
|---|---|---|---|---|
| 4670 | CTNNB1; GNAI1; CD99; PIK3CB | Activated | .000437 | Leukocyte transendothelial migration |
| 4660 | CD40LG; IFNG; PIK3CB; SOS1; TNF | Activated | .000871 | T cell receptor signaling pathway |
| 4920 | JAK2; TNF; ACSL6 | Activated | .004195 | Adipocytokine signaling pathway |
| 4630 | STAT2; IFNG; JAK2; PIK3CB; SOS1 | Activated | .004195 | Jak-STAT signaling pathway |
| 4917 | JAK2;PIK3CB;SOS1 | Activated | .006308 | Prolactin signaling pathway |
| 4062 | STAT2; GNAI1; JAK2; PIK3CB; SOS1 | Activated | .006643 | Chemokine signaling pathway |
| 4915 | GNAI1; PIK3CB; SOS1 | Activated | .010433 | Estrogen signaling pathway |
| 4919 | NCOA1; NCOA2; CTNNB1; PIK3CB | Activated | .010433 | Thyroid hormone signaling pathway |
| 4064 | CD40LG; TNF | Activated | .025082 | NF-κB signaling pathway |
| 4010 | ECSIT; SOS1; TNF | Activated | .025713 | MAPK signaling pathway |
| 4668 | PIK3CB; TNF | Activated | .025713 | TNF signaling pathway |
GO enrichment
The differentially expressed proteins in PMA + ionomycin-treated cells were analyzed for enrichment of GO Biological Processes (Table 4 and Supplementary Files S4 and S5). A number of processes relevant to RNAP II transcription of the integrated HIV-1 provirus were enriched: histone modification, chromatin modification, nucleic acid metabolic process, and RNA metabolic process. Interestingly, processes involved in symbiont interactions with the host were also enriched, suggesting that differentially expressed proteins involved in viral–host interactions were affected by PMA + ionomycin stimulation. Finally, the mitochondrial translation process GO term was highly enriched, reflecting the downregulation of certain proteins involved in mitochondrial protein synthesis (Table 2).
Table 4.
GO Biological Processes
| GOBPID | p | Count | Size | Term |
|---|---|---|---|---|
| GO:0032543 | 1.78E-14 | 13 | 120 | Mitochondrial translation |
| GO:0010508 | 8.01E-05 | 5 | 81 | Positive regulation of autophagy |
| GO:0044144 | 8.37E-05 | 3 | 16 | Modulation of growth of symbiont involved in interaction with host |
| GO:0016570 | .000115 | 10 | 429 | Histone modification |
| GO:0044117 | .000121 | 3 | 18 | Growth of symbiont in host |
| GO:0044110 | .000143 | 3 | 19 | Growth involved in symbiotic interaction |
| GO:0044116 | .000143 | 3 | 19 | Growth of symbiont involved in interaction with host |
| GO:0016569 | .000164 | 11 | 538 | Chromatin modification |
| GO:0090304 | .000463 | 43 | 5,042 | Nucleic acid metabolic process |
| GO:0016070 | .000949 | 39 | 4,546 | RNA metabolic process |
| GO:0032543 | 1.78E-14 | 13 | 120 | Mitochondrial translation |
PPI network
The network associated with the upregulated proteins in PMA + ionomycin-stimulated cells was extracted from the human PPI network (Fig. 4). To generate the PPI network, several databases (BIND, HPRD, DIP, and MINT) that contain experimentally observed PPIs were searched. As shown in Figure 4, edges were drawn to connect two proteins if any previously reported interactions were found in a database for these two proteins. The edge width was calculated based upon the number of shortest paths that a node lies on, which reflects the node's importance in controlling information in a network. The remarkable feature of this network is the unknown PPIs for the great majority of upregulated proteins. As it is believed that most proteins exist in multiprotein complexes in cells,28 this absence of documented PPIs for these upregulated proteins was unexpected. The lack of established PPIs with these upregulated proteins suggests that this set of proteins has been relatively understudied.
FIG. 4.

PPI network. The PPI network for upregulated proteins in PMA + ionomycin-stimulated CCL19-treated cells is indicated. PPI, protein–protein interaction.
Discussion
In this study, we have documented changes in the proteome under conditions in which latent HIV-1 is reactivated in the CCL19 primary CD4+ T cell model of latency. Identification of differentially expressed proteins is generally more informative than identification of differentially regulated mRNAs, as there is not a strong correspondence in mammalian cells between levels of mRNAs and levels of the encoded proteins.11,12 We identified 61 proteins that are upregulated and 36 proteins that are downregulated when CCL19-treated cells are stimulated with PMA + ionomycin, a condition that potently reactivates HIV-1. Our criteria for identification of differentially expressed proteins were a ≥2-fold change in two donors. Our data set, therefore, lacks proteins whose quantitation for one or both donors was below a twofold difference. If we set our threshold for ≥1.5-fold change in both donors, we can identify 79 upregulated proteins and 52 downregulated proteins.
We note that although CCL9-treated cultures were infected with an HIV-1 reporter virus in this study to verify successful reaction of latent viruses, only a fraction of cells in cultures were infected with the reporter virus. The proteomic profiles, therefore, reflect changes in the bulk cultures of CD4+ T cells. It is possible that the subset of cells that were infected possess unique proteomic features not found in uninfected cells. Regardless of this potential limitation of our study, the set of differentially regulated proteins reported here provides a useful resource for future mechanistic studies.
A major mechanism of HIV-1 latency is transcriptional repression of the integrated provirus, and this is largely the consequence of epigenetic repression and limiting levels of essential transcription factors. It is notable that we identified KDM6B (JMJD3) as an upregulated protein. This lysine demethylase has activity for dimethylated or trimethylated lysine 27 of histone H3 (H3K27me2 or H3K27me3). Because H3K27 methylation is repressive, removal of this histone mark by upregulated KDM6B may be critical for viral reactivation. We identified 10 upregulated proteins that are thought to function as transcription factors (Table 1). The induction of these proteins may contribute to viral reactivation, either directly through effects on RNAP II transcription of the integrated provirus or indirectly through transcriptional induction of cellular genes whose protein products contribute to reactivation.
We note that our study did not evaluate changes in protein post-translational modifications (PTMs) after stimulation of CCL19-treated cells. PTMs that occur after T cell stimulation can be essential for reactivation of latent HIV-1. For example, the T-loop of CDK9 requires phosphorylation for active P-TEFb and the viral Tat protein's transcriptional elongation function. This phosphorylation is low in quiescent CD4+ T cells that harbor latent HIV-1 and T cell stimulation that induces T-loop phosphorylation correlates with reactivation of latent HIV-1.10,25,29 Future studies that characterize changes in PTMs after reactivation of latent HIV-1 in a primary CD4+ T cell model will provide an additional valuable data set for studies of HIV-1 latency.
Our proteomic analysis made two unexpected observations—downregulation of proteins involved in mitochondrial protein synthesis (Table 2) and absence in PPI networks for the majority of upregulated proteins (Fig. 4). Because T cell activation induces an elevation in mitochondrial metabolism,30,31 it is puzzling why PMA + ionomycin stimulation of CCL19-treated cells would lead to downregulation of mitochondrial protein synthesis. In addition, the significance of absence of PPI networks for upregulated proteins is unclear and may be the consequence of limited previous study of this set of proteins. Future studies with these upregulated proteins will likely place them in PPI networks.
In summary, our proteomic analysis has identified 61 upregulated proteins and 36 downregulated proteins. These proteins can be analyzed in mechanistic studies of HIV-1 latency and reactivation. The upregulated proteins are candidates for important regulatory factors for viral reactivation, whereas the downregulated proteins are candidates for regulatory factors for the maintenance of latency.
Supplementary Material
Acknowledgments
This work was supported by the National Institutes of Health grant AI116173 (to A.P.R.) and National Science Foundation grant 1620957 (to H.M.). We thank Dr. Anna Malovannaya for helpful discussion.
Author Disclosure Statement
No competing financial interests exist.
References
- 1.Martin AR, Siliciano RF: Progress toward HIV eradication: Case reports, current efforts, and the challenges associated with cure. Annu Rev Med 2016;67:215–228 [DOI] [PubMed] [Google Scholar]
- 2.Churchill MJ, Deeks SG, Margolis DM, Siliciano RF, Swanstrom R: HIV reservoirs: What, where and how to target them. Nat Rev Microbiol 2016;14:55–60 [DOI] [PubMed] [Google Scholar]
- 3.Spina CA, Anderson J, Archin NM, Bosque A, Chan J, Famiglietti M, Greene WC, Kashuba A, Lewin SR, Margolis DM, Mau M, Ruelas D, Saleh S, Shirakawa K, Siliciano RF, Singhania A, Soto PC, Terry VH, Verdin E, Woelk C, Wooden S, Xing S, Planelles V: An in-depth comparison of latent HIV-1 reactivation in multiple cell model systems and resting CD4+ T cells from aviremic patients. PLoS Pathog 2013;9:e1003834. [DOI] [PMC free article] [PubMed] [Google Scholar]
- 4.Tyagi M, Pearson RJ, Karn J: Establishment of HIV latency in primary CD4+ cells is due to epigenetic transcriptional silencing and P-TEFb restriction. J Virol 2010;84:6425–6437 [DOI] [PMC free article] [PubMed] [Google Scholar]
- 5.Budhiraja S, Famiglietti M, Bosque A, Planelles V, Rice AP: Cyclin T1 and CDK9 T-loop phosphorylation are downregulated during establishment of HIV-1 latency in primary resting memory CD4+ T cells. J Virol 2013;87:1211–1220 [DOI] [PMC free article] [PubMed] [Google Scholar]
- 6.Cameron PU, Saleh S, Sallmann G, Solomon A, Wightman F, Evans VA, Boucher G, Haddad EK, Sekaly RP, Harman AN, Anderson JL, Jones KL, Mak J, Cunningham AL, Jaworowski A, Lewin SR: Establishment of HIV-1 latency in resting CD4+ T cells depends on chemokine-induced changes in the actin cytoskeleton. Proc Natl Acad Sci U S A 2010;107:16934–16939 [DOI] [PMC free article] [PubMed] [Google Scholar]
- 7.Saleh S, Solomon A, Wightman F, Xhilaga M, Cameron PU, Lewin SR: CCR7 ligands CCL19 and CCL21 increase permissiveness of resting memory CD4+ T cells to HIV-1 infection: A novel model of HIV-1 latency. Blood 2007;110:4161–4164 [DOI] [PubMed] [Google Scholar]
- 8.Saleh S, Lu HK, Evans V, Harisson D, Zhou J, Jaworowski A, Sallmann G, Cheong KY, Mota TM, Tennakoon S, Angelovich TA, Anderson J, Harman A, Cunningham A, Gray L, Churchill M, Mak J, Drummer H, Vatakis DN, Lewin SR, Cameron PU: HIV integration and the establishment of latency in CCL19-treated resting CD4(+) T cells require activation of NF-kappaB. Retrovirology 2016;13:49. [DOI] [PMC free article] [PubMed] [Google Scholar]
- 9.Wightman F, Lu HK, Solomon AE, Saleh S, Harman AN, Cunningham AL, Gray L, Churchill M, Cameron PU, Dear AE, Lewin SR: Entinostat is a histone deacetylase inhibitor selective for class 1 histone deacetylases and activates HIV production from latently infected primary T cells. AIDS 2013;27:2853–2862 [DOI] [PMC free article] [PubMed] [Google Scholar]
- 10.Jamaluddin MS, Hu PW, Danels YJ, Siwak ES, Rice AP: The broad spectrum histone deacetylase inhibitors vorinostat and panobinostat activate latent HIV in CD4+ T cells in part through phosphorylation of the T-loop of the CDK9 Subunit of P-TEFb. AIDS Res Hum Retroviruses 2016;32:169–173 [DOI] [PMC free article] [PubMed] [Google Scholar]
- 11.Schwanhausser B, Busse D, Li N, Dittmar G, Schuchhardt J, Wolf J, Chen W, Selbach M: Global quantification of mammalian gene expression control. Nature 2011;473:337–342 [DOI] [PubMed] [Google Scholar]
- 12.Vogel C, Marcotte EM: Insights into the regulation of protein abundance from proteomic and transcriptomic analyses. Nat Rev Genet 2012;13:227–232 [DOI] [PMC free article] [PubMed] [Google Scholar]
- 13.Liu W, Chang J, Liu M, Yuan J, Zhang J, Qin J, Xia X, Wang Y: Quantitative proteomics profiling reveals activation of mTOR pathway in trastuzumab resistance. Oncotarget 2017;8:45793–45806 [DOI] [PMC free article] [PubMed] [Google Scholar]
- 14.Jung SY, Choi JM, Rousseaux MW, Malovannaya A, Kim JJ, Kutzera J, Wang Y, Huang Y, Zhu W, Maity S, Zoghbi HY, Qin J: An anatomically resolved mouse brain proteome reveals parkinson disease-relevant pathways. Mol Cell Proteomics 2017;16:581–593 [DOI] [PMC free article] [PubMed] [Google Scholar]
- 15.Dembele D, Kastner P: Fold change rank ordering statistics: A new method for detecting differentially expressed genes. BMC Bioinformatics 2014;15:14. [DOI] [PMC free article] [PubMed] [Google Scholar]
- 16.Tarca AL, Draghici S, Khatri P, Hassan SS, Mittal P, Kim JS, Kim CJ, Kusanovic JP, Romero R: A novel signaling pathway impact analysis. Bioinformatics 2009;25:75–82 [DOI] [PMC free article] [PubMed] [Google Scholar]
- 17.Falcon S, Gentleman R: Using GOstats to test gene lists for GO term association. Bioinformatics 2007;23:257–258 [DOI] [PubMed] [Google Scholar]
- 18.Razick S, Magklaras G, Donaldson IM: iRefIndex: A consolidated protein interaction database with provenance. BMC Bioinformatics 2008;9:405. [DOI] [PMC free article] [PubMed] [Google Scholar]
- 19.Peri S, Navarro JD, Kristiansen TZ, Amanchy R, Surendranath V, Muthusamy B, Gandhi TK, Chandrika KN, Deshpande N, Suresh S, Rashmi BP, Shanker K, Padma N, Niranjan V, Harsha HC, Talreja N, Vrushabendra BM, Ramya MA, Yatish AJ, Joy M, Shivashankar HN, Kavitha MP, Menezes M, Choudhury DR, Ghosh N, Saravana R, Chandran S, Mohan S, Jonnalagadda CK, Prasad CK, Kumar-Sinha C, Deshpande KS, Pandey A: Human protein reference database as a discovery resource for proteomics. Nucleic Acids Res 2004;32:D497–D501 [DOI] [PMC free article] [PubMed] [Google Scholar]
- 20.Lynn DJ, Winsor GL, Chan C, Richard N, Laird MR, Barsky A, Gardy JL, Roche FM, Chan TH, Shah N, Lo R, Naseer M, Que J, Yau M, Acab M, Tulpan D, Whiteside MD, Chikatamarla A, Mah B, Munzner T, Hokamp K, Hancock RE, Brinkman FS: InnateDB: Facilitating systems-level analyses of the mammalian innate immune response. Mol Syst Biol 2008;4:218. [DOI] [PMC free article] [PubMed] [Google Scholar]
- 21.Bullen CK, Laird GM, Durand CM, Siliciano JD, Siliciano RF: New ex vivo approaches distinguish effective and ineffective single agents for reversing HIV-1 latency in vivo. Nat Med 2014;20:425–429 [DOI] [PMC free article] [PubMed] [Google Scholar]
- 22.Besnard E, Hakre S, Kampmann M, Lim HW, Hosmane NN, Martin A, Bassik MC, Verschueren E, Battivelli E, Chan J, Svensson JP, Gramatica A, Conrad RJ, Ott M, Greene WC, Krogan NJ, Siliciano RF, Weissman JS, Verdin E: The mTOR complex controls HIV latency. Cell Host Microbe 2016;20:785–797 [DOI] [PMC free article] [PubMed] [Google Scholar]
- 23.Maldarelli F, Wu X, Su L, Simonetti FR, Shao W, Hill S, Spindler J, Ferris AL, Mellors JW, Kearney MF, Coffin JM, Hughes SH: HIV latency. Specific HIV integration sites are linked to clonal expansion and persistence of infected cells. Science 2014;345:179–183 [DOI] [PMC free article] [PubMed] [Google Scholar]
- 24.Nabel G, Baltimore D: An inducible transcription factor activates expression of human immunodeficiency virus in T cells. Nature 1987;326:711–713 [DOI] [PubMed] [Google Scholar]
- 25.Ramakrishnan R, Dow EC, Rice AP: Characterization of Cdk9 T-loop phosphorylation in resting and activated CD4(+) T lymphocytes. J Leukoc Biol 2009;86:1345–1350 [DOI] [PMC free article] [PubMed] [Google Scholar]
- 26.Kim YK, Mbonye U, Hokello J, Karn J: T-cell receptor signaling enhances transcriptional elongation from latent HIV proviruses by activating P-TEFb through an ERK-dependent pathway. J Mol Biol 2011;410:896–916 [DOI] [PMC free article] [PubMed] [Google Scholar]
- 27.Kinoshita S, Chen BK, Kaneshima H, Nolan GP: Host control of HIV-1 parasitism in T cells by the nuclear factor of activated T cells. Cell 1998;95:595–604 [DOI] [PubMed] [Google Scholar]
- 28.Malovannaya A, Lanz RB, Jung SY, Bulynko Y, Le NT, Chan DW, Ding C, Shi Y, Yucer N, Krenciute G, Kim BJ, Li C, Chen R, Li W, Wang Y, O'Malley BW, Qin J: Analysis of the human endogenous coregulator complexome. Cell 2011;145:787–799 [DOI] [PMC free article] [PubMed] [Google Scholar]
- 29.Ramakrishnan R, Liu H, Rice AP: SAHA (Vorinostat) induces CDK9 Thr-186 (T-Loop) phosphorylation in resting CD4 T cells: Implications for reactivation of latent HIV. AIDS Res Hum Retroviruses 2014;31:137–141 [DOI] [PMC free article] [PubMed] [Google Scholar]
- 30.Michalek RD, Rathmell JC: The metabolic life and times of a T-cell. Immunol Rev 2010;236:190–202 [DOI] [PMC free article] [PubMed] [Google Scholar]
- 31.Almeida L, Lochner M, Berod L, Sparwasser T: Metabolic pathways in T cell activation and lineage differentiation. Semin Immunol 2016;28:514–524 [DOI] [PubMed] [Google Scholar]
Associated Data
This section collects any data citations, data availability statements, or supplementary materials included in this article.