

Abstract
The Ca2+-independent phospholipases A2 (iPLA2s) are part of a diverse family of PLA2s, manifest activity in the absence of Ca2+, are ubiquitous, and participate in a variety of biological processes. Among the iPLA2s, the cytosolic iPLA2β has received considerable attention and ongoing studies from various laboratories suggest that dysregulation of iPLA2β can have a profound impact on the onset and/or progression of many diseases (e.g., cardiovascular, neurological, metabolic, autoimmune). Therefore, appropriate approaches are warranted to gain a better understanding of the role of iPLA2β in vivo and its contribution to pathophysiology. Given that iPLA2β is very labile, its basal expression is low in a number of cell systems, and that crystal structure of iPLA2β is not yet available, careful and efficient protocols are needed to appropriately assess iPLA2β biochemistry, dynamics, and membrane association. Here, step-by-step details are provided to (a) measure iPLA2β-specific activity in cell lines or tissue preparations (using a simple radiolabel-based assay) and assess the impact of stimuli and inhibitors on resting- and disease-state iPLA2β activity, (b) purify the iPLA2β to near homogeneity (via sequential chromatography) from cell line or tissue preparations, enabling concentration of the enzyme for subsequent analyses (e.g., proteomics), and (c) employ hydrogen/deuterium exchange mass spectrometry analyses to probe both the structure of iPLA2β and dynamics of its association with the membranes, substrates, and inhibitors.
1. INTRODUCTION
The Ca2+-independent phospholipases A2 (iPLA2s) are members of a diverse family of PLA2s that hydrolyze the sn-2 substituent from membrane phospholipids to release a free fatty acid and a lysophospholipid (Dennis, Cao, Hsu, Magrioti, & Kokotos, 2011; Gijon & Leslie, 1997). The iPLA2s comprise Group VI PLA2s and, in contrast to s(ecretory)PLA2s and c(ytosolic)PLA2s, do not require Ca2+ for either translocation to membrane or activity. Between 1994 and 2016, the Group VI PLA2s have expanded to seven members: iPLA2β (VIA-1 and 2), iPLA2γ (VIB), iPLA2δ (VIC), iPLA2ε (VID), iPLA2ζ (VIE), and iPLA2η (VIF). Due to their shared homology with patatin, the iPLA2s are included in the patatin-like protein family and also referred to as PNPLAs. The iPLA2s also share a consensus GXSXG catalytic motif contained within a patatin-like lipase domain. The iPLA2s manifest a variety of activities in addition to PLA2, are ubiquitously expressed, and participate in a multitude of biological processes including fat catabolism, cell differentiation, maintenance of mitochondrial integrity, phospholipid remodeling, cell proliferation, signal transduction, and cell death. As such, dysregulation of iPLA2s can influence the metabolic state, CNS function, cardiovascular performance, and cell survival and therefore have a profound impact on onset/progression of many diseases. To date, the best-characterized iPLA2s are iPLA2β, localized predominantly in the cytosol, and membrane-associated iPLA2γ (Mancuso, Jenkins, & Gross, 2000).
The iPLA2β (PNPLA9) is the most widely described of the iPLA2s and expression of its activity was first described in P388D1 macrophage-like cells in 1994 (Ackermann, Kempner, & Dennis, 1994) and later shown to be the same enzyme (Balboa, Balsinde, Jones, & Dennis, 1997) as that cloned from Chinese hamster ovary cells in 1997 (Balboa et al., 1997; Jones et al., 1996; Tang et al., 1997). Unlike cPLA2, which exhibits preference for hydrolysis of arachidonic acid from the sn-2 position of glycerophospholipids (Ghosh, Tucker, Burchett, & Leslie, 2006), the iPLA2s do not demonstrate sn-2 substrate specificity. The iPLA2s manifest PLA2/PLA1, lysophospholipase (Lio & Dennis, 1998; Wolf & Gross, 1996), transacylase (Jenkins et al., 2004; Lio & Dennis, 1998), and thioesterase (Carper, Zhang, Turk, & Ramanadham, 2008; Jenkins, Yan, Mancuso, & Gross, 2006) activities.
1.1 iPLA2β Characteristics
The iPLA2β is an 84–88 kDa cytosolic protein with a serine lipase consensus sequence (GTSGT) in its catalytic domain that is preceded by eight N-terminal ankyrin repeats (Gross, Ramanadham, Kruszka, Han, & Turk, 1993; Ma et al., 1997; Tang et al., 1997). The 88 kDa isoform is a product of a mRNA species that arises from an exon-skipping mechanism of alternative pre-mRNA splicing (Larsson, Claesson, & Kennedy, 1998) and contains a 54-amino acid sequence that interrupts the eighth ankyrin repeat. The iPLA2β protein contains a caspase-3 cleavage site (DVTD), a putative bipartite nuclear localization sequence (KREFGEHTKMTDVKKPK), and, upon stimulation, can associate with multiple subcellular-localized proteins and mobilize into various subcellular organelles (Golgi, endoplasmic reticulum [ER], mitochondria, and nucleus).
To date, there are two recognized catalytic activators of iPLA2β (ATP and calmodulin kinase IIβ) and one of its transcription (sterol regulatory element-binding protein). Inhibitors of iPLA2β include arachidonyl trifluoromethyl ketone (AACOCF3), methyl arachidonyl fluorophosphonate (MAFP), and palmitoyl trifluoromethyl ketone (PACOCF3), which are sometimes used for “selective” inhibition of cPLA2. In contrast, the bromoenol lactone (BEL) suicide inhibitor has been demonstrated to be a more selective inhibitor of iPLA2 with little or no effect on cPLA2 or sPLA2 (Hazen, Zupan, Weiss, Getman, & Gross, 1991; Jenkins et al., 2004; Ma, Ramanadham, Hu, & Turk, 1998). Further, the S- and R-enantiomers of BEL exhibit selective potency for iPLA2β and iPLA2γ, respectively (Jenkins, Han, Mancuso, & Gross, 2002), and they have been used to distinguish biological processes impacted by the two isoforms. Fluoroketone- and oxadiazole-based compounds currently under development are proving to be just as potent as BEL, while being more specific for iPLA2β and exhibiting reversible inhibition, without discernible toxicity (Ali et al., 2013; Dennis et al., 2011; Kalyvas et al., 2009; Kokotos et al., 2010; Li et al., 2011; Lopez-Vales et al., 2011, 2008; Mouchlis, Limnios, et al., 2016; Ong, Farooqui, Kokotos, & Farooqui, 2015).
2. EXPERIMENTAL PROCEDURES
2.1 iPLA2β Activity Assay
Described is a facile assay that will provide rapid, selective, and quantifiable measurement of iPLA2β-specific activity in a given preparation, without requiring purification of the enzyme.
Solutions needed
Homogenization buffer (HB, 250 mM sucrose, 40 mM Tris–HCl, pH 7.1 @ 4°C)
Assay buffer (AB, 200 mM Tris–HCl, pH 7.5 @ 37°C, 10 mM EGTA)
EGTA (10 mM)
ATP (Sigma, St. Louis, MO, A-5394; 1 or 10 mM)
S-BEL inhibitor (Cayman 10006801, prepare 10 mM stock in DMSO and store at −20°C in small aliquots. Do not reuse thawed aliquot. Final concentrations [0.10–10.0 μM] should be contained in less than 1% by volume of DMSO.)
Radiolabeled substrate Perkin Elmer (NEC765010UC, L-α-1-palmitoyl-2-arachidonyl-sn-phosphatidylcholine [arachidonyl-1-14C], or 16:0a/20:4-PC or PAPC, 2.5–5 μM in 5 μL EtOH)
Oleate standard (Sigma 143-19-1; 5 mg/mL CHCl3)
TLC solvent (petroleum ether/ethyl ether/acetic acid, 80/20/1 by volume). This solvent composition resolves fatty acids (Rf 0.58) from monoacylglycerol (Rf 0.24) and diacylglycerol (Rf 0.21)
100% ethanol
1-Butanol
Scintillation cocktail
Glycerol
β-Mercaptoethanol
Specific supplies/equipment needed
Centrifuge
Cold microfuge
Shaking water bath
Scintillation counter
Vortex
Stopwatch
Compressed nitrogen tank
Hair dryer
10×75 mm glass assay tubes (best for viewing separation of organic and aqueous phases)
TLC tank
Silica gel G channeled/scored TLC plates (Analtech Uniplate 31711)
Iodine (Sigma 376558)
Glass Hamilton syringes (50 μL for substrate stock, 10 μL for diluted substrate for assay, 50 μL for TLC spotting; keep these separate and do not interchange.)
Repeater pipet for reagent additions (i.e., HB, AB, EGTA, butanol)
Scraper blade
3″ × 5″ weighing paper
Scintillation vials (7 mL)
Scintillation cocktail (RPI 3a70B or equivalent)
Basic assay concept
iPLA2β in a given sample will hydrolyze the sn-2 (radiolabeled) fatty acid substituent from the provided substrate under zero-Ca2+ (no added Ca2++EGTA) conditions. The released fatty acid is then resolved by TLC, recovered for scintillation counting, and dpm used to determine specific enzyme activity.
Assay protocol (Fig. 1)
Fig. 1.

iPLA2β activity assay flow.
Using your established methods, prepare sample (cytosolic, mitochondrial, ER, or nuclear fractions) from cells or tissues in HB. If only Ca2+-independent PLA2 activity is to be measured, EGTA can be included in the HB. Otherwise, it can be added to activity assay tubes. At all times, keep the sample preparation, assay reagents, and substrate on ice.
Measure protein concentration in the sample. Approximately 25–50 μg protein in aliquots of less than 50 μL should be the target and the volume of HB used in Step 1 volume should be titrated accordingly. For cells in 100 mm dish, use 200 μL HB for harvesting. For tissues, use sufficient volume (<1 mL) to allow efficient sonication and adjust the volume as needed during assay development. It is best to prepare a concentrated sample, which can be diluted subsequent to [protein] determination.
-
During sample preparation
Water shaking bath. Turn on and equilibrate to 37°C.
Set up the activity assay tubes. An initial protocol to establish the presence of iPLA2β activity in a sample will include assays in the absence and presence of ATP (1 or 10 mM, activator of iPLA2β) or S-BEL (0.1–10.0 μM, selective irreversible inhibitor of iPLA2β). A typical assay template is as follows (tubes 2–5 are singlicates for a given sample; 6 on are for additional sample sets):
Prepare the substrate fresh each time. PAPC is a common choice for the radiolabeled substrate, although 1-palmitoyl-2-palmitoyl-sn-glycero-3-phosphocholine (DPPC), 1-palmitoyl-2-lauroyl-sn-glycero-3-phosphocholine (PLPC), and 1-O-(Z)-hexadec-1′-enyl-2-[9,10-3H2]octadec-9′-enoyl-sn-glycero-3-phosphocholine [(16:0p/18:1)-PC] are also suitable. The latter substrate is a plasmalogen phospholipid, containing a vinyl ether linkage in the sn-1 position, and is an extremely favored substrate by iPLA2β. However, it can be more expensive (to buy or synthesize) and very labile. In initial experiments, one can use the final substrate concentration of 2.5–10 μM. For a [14C]-labeled substrate, 100,000 dpm in 5 μL is added to the assay tube and this is typically contained in 1 μL of the stock substrate. After determining the number (N) of assay tubes (including replicates), transfer (N+2)μL of stock substrate into a clean 12×75 mm glass tube using the Hamilton syringe designated for stock (highest counts). Commercial radiolabeled substrates are usually prepared in chloroform or methanol. Using a nitrogen stream, evaporate the solvent in the tube and then resuspend the lipid in 5× (N+2)μL of ethanol. This will provide an extra 10 μL of substrate. Count 2 μL prior to assay to ensure that it contains ~40,000 dpm (=100,000 in 5 μL) using a second Hamilton syringe (second most counts). At the end of the assay, during sample counting, count 5 μL of the substrate to confirm total added dpm to assay tubes and for calculation of % substrate hydrolyzed by iPLA2β in the sample aliquot.
Scintillation vials. Set aside the required number (N) of scintillation vials with 5 mL scintillation cocktail. Number the caps. Scintillation cocktail splashing will wipe off markings on the tube!!
TLC plates. Number the TLC plates at the top of each lane with a pencil (Fig. 2, “x” at top of lanes). If the assay requires more than one plate, make sure to include a blank for each plate. If less than one plate is sufficient, snap off extra lanes and save.
Oleate standard. Place a drop (~10 μL) of oleic acid solution into the middle of the loading area in each lane (Fig. 2, lane 2). Set aside and let air-dry. Free fatty acid will comigrate with the oleic acid standard, which will be visible upon exposure to iodine vapor.
TLC tank. In a fume hood, prepare the TLC tank by inserting a U-shaped double-folded Whatman paper into the tank. Place solvent (100 mL) at bottom, cover the container, and apply a weight on top. Monitor solvent migration upward on the Whatman filter paper. This preparation is good for multiple runs (four plates) on the same day as long as the tank is kept air-tight. You can run TLC plates back to back or by using paper click separators, up to four plates at one time.
Iodine vapor tank. In a fume hood, add a few crystals of iodine to a separate tank and cover. This tank can be used repeatedly for the same purpose until the iodine is exhausted.
-
Preparing the assay tubes (done at room temperature [RT], unless otherwise noted)
To all tubes, first add AB and EGTA.
-
Second, add HB to all tubes. To the blank tubes, add 100 μL. For sample tubes, HB=100 μL minus protein volume. Initial experiments should determine optimal protein amount that allows for linear accumulation of product during the course of the assay (to be contained in less than 50 μL).
⇒ Subsequent steps need to be performed rapidly.
Third, add source of protein in HB.
If testing ATP, add prior to substrate.
If testing S-BEL, add after Step c and incubate at RT for 3 min. Include this in the time frame described in Step 6.
When adding ATP and/or S-BEL, reduce the dH2O volume by same amount.
Assay. Start the assay by adding substrate to tube. Prior to first addition, remove dead space in the second Hamilton syringe by flushing it with substrate two to three times (do not discard the substrate, empty it back into tube). Now, take up 5 μL into the syringe, immerse it to the bottom of assay tube, and deliver the substrate. Quickly vortex the tube and add it to the shaking water bath. Dip the syringe in a clean tube of EtOH to wash off the tip (do not flush the syringe again), prior to taking up the next aliquot of substrate.
-
Stopping the reaction. At a predetermined time (Step 6a), add 100 μL butanol (RT) to the tube, remove it from water bath. Vortex for 5 s and set aside (RT) in a test tube rack.
Initial experiments should test the optimal assay time (from 1 to 10 min), during which substrate hydrolysis is linear with respect to time. The iPLA2β-catalyzed hydrolysis typically occurs rapidly, between 3 and 5 min.
The time elapsed between substrate and butanol additions should equal the chosen assay time. For example, if a 3-min assay duration is chosen, start with substrate addition to tube 1 at 0 min, tube 2 at 15 s, tube 3 at 30 s, …, and tube 12 at 2:45 min. Starting at 3 min, stop reaction at 15 s intervals. This interval can be lengthened or shortened depending on the individual. Keep in mind to include at least one blank to each separate set of assay runs.
Separating the hydrolyzed FA. After all assay tubes have been collected, centrifuge them (RT, 2000×g, 5 min) to separate the organic (upper) from the aqueous phase. The interface will be a thin protein band. Continue with the next step without delay.
Spotting TLC lanes. Tilt the tube toward you and using the third Hamilton syringe (lowest counts) and without piercing the interface, carefully remove 25 μL (a fourth) of the upper layer. Gently apply this aliquot onto the loading area (Fig. 2, lane 3). Dry the lanes with the hair dryer and place in the TLC tank.
Identifying hydrolyzed FA region. After the solvent migrates to the top of the TLC plate, remove the plate from tank and allow residual solvent to evaporate in a fume hood. Place the TLC plate in the iodine tank. When the oleic acid standard is visualized (by appearance of a yellow streak across the plate, Fig. 2, lane 8), remove the plate from tank and mark the boundaries of the standard (Fig. 2, lane 9). Allow the iodine to sublime under hood using a hair dryer. At this point, the plate can be set aside for later processing.
Harvesting the hydrolyzed FA. Using a blade, scrape the marked off region (Fig. 2, lane 11) into a counting vial (Fig. 2, lane 12). Add scintillation cocktail to vial, cap, and mix vigorously by hand.
Counting. Allow an O/N quenching period and then count the samples in a 14C channel and record decays/minute (dpm). If only counts/minute (cpm) are reported, calculate dpms using efficiency of the counter.
- Activity calculation. Subtract averaged blank dpm from spotted sample (25% of total) dpm and use that value to determine Specific Enzyme Activity:
Fig. 2.
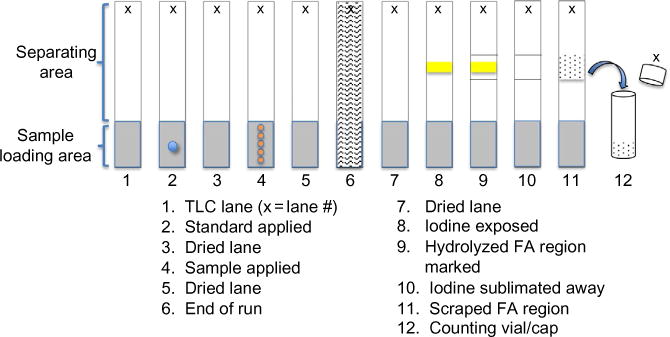
Recovery of hydrolyzed fatty acid for quantitation.
Keys to achieving optimal results
iPLA2β is very labile and sensitive to increases in temperature for pro-longed periods. Therefore, any preparation in which iPLA2β activity is to be measured needs to be maintained on ice.
When using a sonicator to prepare protein sample, use 1 s ON and 0.5 s OFF pulse for 15–20 s (~20% power, once for cells/2–3 times for tissue homogenate). Keep the sample tube immersed in ice during sonication.
Due to lability of iPLA2β, it is best to perform the assay soon after the sample has been generated.
Utilizing samples prepared from frozen cells or tissues will give activity measurements, but they will tend to be much lower than freshly prepared samples.
iPLA2β is stabilized by ATP, even at 37°C. Thus, storing a sample with ATP addition will preserve the activity. However, ATP is an activator of iPLA2β and the specific activity measured will be higher than in the absence of ATP. This will preclude comparisons between samples prepared and assayed right away in the absence of ATP.
Once the activity assay procedure has commenced, it is best to carry through until the TLC plate has been run. The scraping and counting can be done later.
2.2 iPLA2β Purification
(A) Below are details on how to purify iPLA2β starting from tissue (i.e., brain, skeletal muscle, heart, >25–50 g) or cultured cells (15–20×175 cm2 flasks; Carper et al., 2008; Ramanadham, Wolf, Jett, Gross, & Turk, 1994; Wolf & Gross, 1996) when a homogeneous concentrated enzyme preparation is needed for subsequent analyses.
Buffers needed (adjust pH of buffers first before adding DTT)
HB (250 mM sucrose, 10 mM imidazole, 10 mM KCl, pH 7.8 @ 4°C).
Pre-DEAE (anion exchange) dialysis buffer (15 mM imidazole, 5 mM K2HPO4, 10% glycerol, pH 7.8 @ 4°C).
DEAE column elution buffer (10 mM imidazole, 10 mM KCl, 100 mM NaCl, 10% glycerol, 1 mM DTT, pH 8.0 @ 4°C).
Pre-CF (chromatofocusing) dialysis buffer (10 mM imidazole, 10 mM KCl, 25% glycerol, 1 mM DTT, pH 8.4 @ 4°C).
CF column elution buffer (10% polybuffer 96 [GE Healthcare Life Sciences, Pittsburgh, PA, 17-0714-01], 5% polybuffer 74 [BOC Sciences, Shirley, NY, 82658-85-3], 25% glycerol, 1 mM DTT [Calbiochem, San Diego, CA, 578517], pH 6.9 @ 4°C).
ATP column elution buffer (10 mM imidazole, 25% glycerol, 1 mM DTT, pH 8.3 @ 4°C).
Calmodulin column elution buffer (10 mM HEPES, 1 mM EDTA, 340 mM sucrose, 1 mM DTT, 1 mM Triton X-100, pH 7.5).
Equipment/supplies needed
Cold room
Buffer pump
UV monitor
Chromatography columns and reservoirs (GE Healthcare)
DEAE Sephacel (GE Healthcare 17-0500-01) and PBE-94 CF (Axsyn, Chesham, UK, AX-9NNB) resins
ATP Agarose (Sigma A-9264) and Calmodulin-Sepharose (GE Healthcare 17-0529-01) column resins
Glass wool (Fisher, Hampton, NH, 22–289336)
Spectra/Por 1 dialysis tube (Spectrum Laboratories Inc., Rancho Dominguez, CA, 23 mm × 100 ft [132650], 40 mm × 100 ft [132660], and 50 mm × 100 ft [132665]; 6–8 kDa molecular weight cutoff)
Filters for buffers (Millipore, Darmstadt, Germany, GSWP04700)
Nunc freezing vials (ThermoFisher Scientific, Waltham, NH, 374080 [0.50 mL] and 374081 [1 mL])
Activity assay needs, as described in Section 2.1.
Columns preparation prior to sample loading
-
DEAE-Sephacel column
On Day 1, place resin (160 mL for a 5 × 8 cm column) in a Buchner funnel with filter and wash with 1 M NaCl, 100 mM Na Acetate, pH 4 (1 L).
Wash the resin with dH2O (1 L).
-
Wash with Buffer 2 (1.5 L).
-
⇒
During each wash/rinse, gently swirl the resin using a glass rod; apply gentle vacuum to keep filter in place, allow resin to settle for 5 min; apply vacuum to remove wash but do not let the resin dry.
-
⇒
Place washed resin in 500 mL Buffer 2 in a filtering flask with side-arm. Degas and allow resin to settle at 4°C.
-
Remove floating particles by aspiration and pour resin mixture into column in the cold room and equilibrate with Buffer 2 (1.5–2 L, O/N, 1.5–2 mL/min).
-
⇒
While loading the DEAE column, prepare remaining buffers.
-
⇒
Cannot reuse this column, prepare fresh each time.
-
⇒
-
CF Column (can be prepared at the same time and similarly to the DEAE column)
Wash CF resin (60 mL) with 1 M NaCl, 100 mM Na Acetate, pH 4 (500 mL).
Rinse resin with dH2O (1 L).
Rinse resin with Buffer 4 (1 L).
Degas resin in Buffer 4 (200 mL) and allow resin to settle.
Aspirate floating particles and load slurry into column.
Level the column and apply air pressure to generate flow rate of 1.6 mL/min.
After column has packed, pump Buffer 4 at 1.6 mL/min for 15 min to pack the column and then at 1.0 mL/mL O/N through Day 2.
-
Allow Buffer 4 containing 1 mM DTT to flow through column (2 L @ 1.6 mL/min O/N into Day 3).
-
⇒
Can reuse the column after washing with buffer containing 1 M NaCl, 100 mM Na Acetate, pH 4 (2 L, O/N). Then, wash with dH2O and store column in 30% EtOH.
-
⇒
-
ATP column
Apply ATP-Agarose affinity resin to column (1 × 1 cm).
Rinse with dH2O to remove EtOH.
Wash with 1 M NaCl (30–50 mL, 4°C).
Rinse column from top to bottom exhaustively with dH2O.
-
Equilibrate with Buffer 6 (20 mL) and plug bottom until sample loading. Make sure to leave some buffer in the column so the resin does not dry.
-
⇒
Can reuse column after washing with 1 M NaCl (30 mL) followed by dH2O. Store column in 30% EtOH.
-
⇒
-
Calmodulin column
Apply to column 1 mL of the Calmodulin-Sepharose slurry.
Wash column with 25 mL of 25 mM imidazole (pH 8.0).
-
Wash column with 25 mL of 25 mM imidazole (pH 8.0) containing 5 mM CaCl2.
-
⇒
Do not reuse this column—prepare it fresh each time.
-
⇒
Purification protocol (all purification columns to be performed at 4°C)
Day 1
1. Prepare crude cytosolic fraction in Buffer 1, using your established protocol.
2. Dialyze the fraction overnight against Buffer 2, using dialysis tubing previously equilibrated in the same buffer at 4°C.
Day 2
3. Load dialyzed fraction onto DEAE column (1.5 × 8 cm). Pass the eluent by gravity through a UV monitor to record the absorbance.
4. Wash DEAE columns with Buffer 2 containing 1 mM DTT, until the A280 returns to baseline.
5. Elute iPLA2β activity (in 3–5 mL fractions) using Buffer 3.
6. Measure iPLA2β activity, as a reflection of activity present in each fraction. This can be achieved by immediate counting (@ 0.5 min) and will allow proceeding to the next step without delay. The fractions can be recounted after overnight quenching.
7. Pool fractions with activity and dialyze overnight against Buffer 4, at 4°C.
Day 3
8. Apply the dialyzed pool to PBE-94 CF column (1×8 cm, 1.8 mL/min).
9. Wash the CF column with Buffer 4.
10. Elute iPLA2β activity (in 3–5 mL fractions) using Buffer 4.
11. Measure iPLA2β activity in the fractions and pool fractions with activity.
12. Immediately load pool onto a 12×1 cm N6-[(6-aminohexyl) carbamomethyl]-ATP-agarose column. Reapply void one additional time.
13. Wash column with Buffer 6 (25–50 mL).
14. Wash the column with Buffer 6, Buffer 6 containing 10 mM AMP (Sigma A-2252; 5 × 5 mL fractions).
15. Wash the column exhaustively with Buffer 6 to remove the AMP.
16. Elute iPLA2β with Buffer 6 containing 1 mM ATP (Sigma A-5394; 0.5–1.0 mL fractions).
17. The AMP and ATP fractions can be saved at 4°C and assayed for iPLA2β activity the following day.
Day 4
18. Pool the fractions with activity and increase [Ca2+] in pool to 5 mM.
19. Load pool onto a Calmodulin-Sepharose column (1 × 1 cm).
20. Collect the void and reload onto the column.
21. Wash column with Buffer 7 containing 0.5 mM CaCl2.
22. Elute iPLA2β with Buffer 7 containing 8 mM EGTA (0.5–1.0 mL fractions).
23. Measure activity and pool fractions with activity.
24. Concentrate pool to dryness in the presence of 10% SDS by lyophilization.
25. Resuspend in small volume (based on subsequent assay protocols) of buffer containing 25 mM Tris–HCl (pH 6.8), 5% glycerol, 0.5% β-mercaptoethanol.
26. Store sample in Nunc cryotubes at −80°C in small aliquots and before use, thaw aliquots on ice. Use aliquot only once; do not refreeze.
(B) An abbreviated alterative protocol can be employed if less starting material is available or if low basal activity in the sample is predicted, as follows:
Sonicate sample in HB (10 mM HEPES, 1 M EDTA, 340 mM sucrose, 1 mM DTT, pH 7.5).
Centrifuge sonicate (1000×g, 10 min, 4°C).
Precipitate protein in the supernatant with the addition of ammonium sulfate (50%).
Centrifuge mixture (20,000×g, 30 min, 4°C).
Resuspend pellet in Buffer 7.
Proceed with ATP and Calmodulin Sepharose column elution steps as earlier.
Concentrate and store sample as described earlier.
Calculations
Prior to loading a column, save a small aliquot of the pool to determine total loaded protein/activity.
Record each column load volume.
Keep track of the fraction volumes collected.
These will allow subsequent determination of specific enzyme activity and fold purification following each step.
Keys to optimal purification yields
Perform all purification steps at 4°C (or cold room).
Do not let the columns dry.
Make sure to add DTT to elute activity from the DEAE column. Use fresh resin for each preparation.
If the DEAE Sephacel resin is mishandled, cracks will develop when poured into column or after sample is loaded. In that case, gently swirl the column section with crack.
The CF column is unforgiving and if the resin dries at any point after protein loading, fresh column and sample will need to be prepared!!
Do not delay in proceeding from the CF to ATP column steps.
Eluant from the ATP column is stable and can be assayed the following day. Store at 4°C until assay.
Do not use peristaltic pump to elute protein out of any column as iPLA2β will stick to pump tubing and can be denatured by the pump action.
2.3 Membrane Association of iPLA2β
Like many other members of the PLA2 family, iPLA2β is a water-soluble protein that must associate with lipid membranes to bind substrate. Indeed, the iPLA2β catalytic cycle has been described as consisting of four steps: (1) membrane association, (2) extraction of a substrate molecule into the active site, (3) catalysis, and (4) diffusion of reaction products away from the active site, setting the stage for another round of catalysis (Batchu, Hokynar, Jeltsch, Mattonet, & Somerharju, 2015; Mouchlis, Bucher, McCammon, & Dennis, 2015; Mouchlis & Dennis, 2016). Although iPLA2β-selective inhibitors have been identified (Ali et al., 2013; Dennis et al., 2011; Hazen et al., 1991; Jenkins et al., 2004; Kalyvas et al., 2009; Kokotos et al., 2010; Li et al., 2011; Lopez-Vales et al., 2011, 2008; Ma et al., 1998; Mouchlis, Limnios, et al., 2016; Ong et al., 2015), a more thorough understanding of the molecular mechanisms underlying the membrane association, substrate binding, and even catalytic mechanism could lead to development of more efficacious and potentially clinically relevant inhibitors.
Investigation of these mechanisms has been hampered because a high-resolution structure of iPLA2β is not yet available. However, Dennis and coworkers have developed an elegant approach to gain insight into the structure of iPLA2β and the molecular mechanisms underlying its association with membranes, substrates, and inhibitors that relies on the coordinated use of three approaches: selective enzyme assays (like the one described earlier), molecular dynamics, and hydrogen/deuterium exchange mass spectrometry (DXMS; Cao, Burke, & Dennis, 2013; Hamuro et al., 2004; Hsu et al., 2013; Hsu, Burke, Li, Woods, & Dennis, 2009; Mouchlis et al., 2015; Mouchlis & Dennis, 2016; Mouchlis, Limnios, et al., 2016; Mouchlis, Morisseau, et al., 2016). DXMS has been broadly used to study protein dynamics, protein–protein, and protein–ligand interactions (Hamuro et al., 2004; Percy, Rey, Burns, & Schriemer, 2012). In principle, DXMS measures solvent accessibility of amide protons by quantifying their exchange for deuterium when a protein is incubated in D2O. Although there are other potential explanations for hydrogen/deuterium exchange (i.e., changes in hydrogen bonding, oligomerization, distal changes in protein conformation, and interaction with ligand), DXMS can be informative about local changes in protein conformation when coupled with other structural information (Cao et al., 2013; Gallagher & Hudgens, 2016; Percy et al., 2012). This approach has led to mapping of conformational changes in the group IVA phospholipase A2 (cPLA2α) and group IA phospholipase A2 upon binding to membranes, substrates, inhibitors, and divalent cations (Burke et al., 2009, 2008; Cao et al., 2013; Hsu et al., 2008; Mouchlis et al., 2015; Mouchlis & Dennis, 2016). In all of these reports, the DXMS data were interpreted and confirmed through molecular dynamics simulations and comparisons to the high-resolution 3D structures of each enzyme.
As noted earlier, such data are not yet available for iPLA2β. To circumvent this, homology modeling approaches were used to predict structures of the ankyrin repeat (residues 88–474) and catalytic (residues 475–806) domains of human iPLA2β (Hsu et al., 2009). A BLAST homology search revealed that the ankyrin domain of iPLA2β is 51% homologous to human ankyrin-R (PDB 1N11) and the catalytic domain is 34% homologous to the potato acyl hydrolase patatin (PDB 1OXW; Hsu et al., 2009; Mouchlis & Dennis, 2016). After applying a variety of modeling approaches (Bennett-Lovsey, Herbert, Sternberg, & Kelley, 2008; Hsu et al., 2009; Rost, Yachdav, & Liu, 2004), homology models were developed that exhibited template modeling (TM, a measure of the similarity of two protein structures) scores of 0.77 (ankyrin domain) and 0.76 (catalytic domain; Hsu et al., 2009). The predicted structures were validated with DXMS, performed as described later.
2.3.1 Hydrogen/DXMS
The DXMS protocol essentially consists of four phases: (1) incubation of enzyme (±substrate, inhibitor, source of “membrane” or a combination) in D2O buffer for various periods of time (10–10,000 s); (2) quenching of the exchange (reduce to pH 2.5 and temperature to 0°C) and denaturation of the enzyme (guanidine hydrochloride); (3) online pepsin digestion followed by C18 reverse-phase HPLC of the resultant peptides; and (4) analyses of deuterated peptides through electrospray ionization tandem mass spectrometry (ESI-MS/MS). For additional detail on the theory, implementation, and optimization of DXMS, the reader is referred to two excellent reviews (Gallagher & Hudgens, 2016; Percy et al., 2012). The optimized protocol for analysis of iPLA2β is described in detail later:
Phase 1
Preparation of deuterated samples
DXMS has been used to assess changes in iPLA2β conformation induced by binding to substrate, inhibitor, and membranes (Hsu et al., 2013, 2009; Mouchlis et al., 2015; Mouchlis & Dennis, 2016). In general, 40 μg of iPLA2β protein in 25 μL of protein buffer (25 mM Tris–HCl, pH 7.5, 50 mM NaCl, 10 mM urea, 250 mM imidazole, 2 mM ATP, 30% glycerol) is added to 75 μL of D2O buffer (50 mM MOPS, pH 6.9, 100 mM NaCl, 2 mM DTT, 2 mM ATP; final D2O concentration =71%). Enzyme is preincubated with substrates, inhibitors, and membranes before addition of D2O buffer. For membrane experiments, the ratio of lipid to iPLA2β is typically >60, to ensure that saturation of the enzyme (Cao et al., 2013) and enzyme is preincubated with inhibitor in such experiments to prevent extensive hydrolysis of the membranes (Cao et al., 2013; Hsu et al., 2009). Samples are then incubated at RT (23°C) for 10, 30, 100, 300, 1000, 3000, and 10,000 s.
Phase 2
Quenching and denaturation
As exchange of amide protons is negligible at pH 2.5 (Gallagher & Hudgens, 2016), the hydrogen/deuterium exchange reaction is quenched through addition of 100 μL of 0.8% formic acid, 2 M guanidine hydrochloride. This solution also denatures the protein, in preparation for protease digestion in the next phase. The quenched reactions are immediately frozen on dry ice and then stored at −80°C.
Phase 3
Pepsin digestion and collection of peptides
All subsequent processing steps are performed at 0°C. Given its acid pH optimum, pepsin is among the most commonly used proteases to generate peptides for DXMS analyses (Gallagher & Hudgens, 2016; Percy et al., 2012). Porcine pepsin (Sigma, cat # P6887) is immobilized at 30 mg/mL on an Upchurch Scientific guard column (66 μL bed volume; cat # C.130B) packed with Poros 20 AL-activated affinity medium (ThermoFisher, cat # 1602802). The quenched deuterium exchange reactions are passed over the pepsin affinity column in 0.05% trifluoroacetic acid (TFA) at 100 μL/min for 1 min (resulting digestion time =13 sc) before resultant peptides are passed onto a 1×50 mm reversed-phase C18 column (Vydac columns, Fisher; cat # 501120911). Peptides are eluted with a linear gradient of 0.046% TFA, 6.4% acetonitrile (v/v) to 0.03% TFA, 38.4% acetonitrile at 50 μL/min for 30 min (Hsu et al., 2008). This online digestion approach minimizes back exchange (Cao et al., 2013; Gallagher & Hudgens, 2016; Percy et al., 2012). For reactions containing vesicles (typically at lipid to protein ratios of 60 or greater), it is advisable to pass the samples through a C8 precolumn to remove the lipids (Cao et al., 2013).
Phase 4
Mass spectrometry analysis of deuterated peptides
The peptides are analyzed by ESI-MS/MS. Specifically, iPLA2β analyses are performed using a Finnigan LCQ mass spectrometer, capillary temperature 200°C (Burke et al., 2008; Hamuro et al., 2004; Hsu et al., 2008).
Data analysis
The first step in data analysis is to identify and curate the deuterated peptides, using the SEQUEST software from Thermo Finnigan. Once overlapping peptides have been identified/aligned, a variety of software packages can be used to assess rate of hydrogen/deuterium exchange for each peptide (Gallagher & Hudgens, 2016). Solvent exchange rates are higher in solvent-exposed peptides than in peptides buried in the interior of the protein. Changes in the rate of exchange upon protein association with substrate, inhibitor, ligand, membranes, or oligomeric partners can provide mechanistic information about changes in conformation induced by these interactions (Cao et al., 2013; Gallagher & Hudgens, 2016; Percy et al., 2012). As noted earlier, there are alternative explanations for changes in the exchange rate of amide protons that can confound interpretation of DXMS data. As such, the iPLA2β DXMS experiments should be interpreted in the context of data generated in MD simulations, using the homology models described earlier (Hsu et al., 2013, 2009; Mouchlis et al., 2015; Mouchlis & Dennis, 2016). It is also important to include two control experiments to account for any back exchange that occurs during processing. In the first (“back exchange” control), a fully deuterated protein is generated (D2O labeling of denatured protein) and then carried through the processing step to assess deuterium atoms lost during processing. The second control (“on exchange” control) is generated by adding D2O to protein in quenching buffer to assess exchange induced during the processing steps (Cao et al., 2013). Back exchange can also be minimized by optimizing experimental conditions (Gallagher & Hudgens, 2016; Percy et al., 2012).
2.3.2 Outcomes of DXMS Analyses of iPLA2β
The protease digestion and processing phases have been optimized to yield 88% coverage of the iPLA2β primary sequence (Hsu et al., 2009, 2013). Several regions of the ankyrin repeat domain (205–211, 390–404, 439–450, 458–470) and two regions in the catalytic domain (617–629; 708–730) show rapid hydrogen/deuterium exchange on the order of >70% at 10 s. These observations suggest that these regions are highly solvent exposed, a supposition that is borne out in the homology model and in additional DXMS experiments which indicate that the amphipathic alpha helix formed by residues 708–730 becomes buried upon exposure to membrane vesicles (Hsu et al., 2009). Binding of a fluoroketone inhibitor (1,1,1,3-tetrafluoro-7-phenylheptan-2-one) induces decreased hydrogen/deuterium exchange in five regions of iPLA2β (residues 483–493, 516–525, 544–549, 631–655, 773–778) that are localized near the active-site serine (S519) and aspartic acid (D652) (Hsu et al., 2013). Comparable changes are observed in several regions of the catalytic domain when iPLA2β is exposed to small unilamellar vesicles composed of 1-palmitoyl-2-arachidonoyl-sn-phosphatidylcholine, a membrane mimetic (Hsu et al., 2009). Upon binding to membrane, the catalytic domain of iPLA2β exhibits reduced hydrogen/deuterium exchange in regions composed of residues 631–655, 658–664, 708–730, and 773–778. As noted earlier, the alpha helix in regions 708–730 exhibits the largest reduction (13.2 deuterons, 70% decrease), suggesting a dramatic shift in conformation/localization of this helix when iPLA2β binds to membranes. When taken together and considered in light of molecular dynamics simulations, these observations lead to a model wherein the function of the 708–730 helix region is analogous to that of the “cap” region in group IVA PLA2 (cPLA2) (Hsu et al., 2009; Mouchlis et al., 2015). Upon membrane binding, this region is proposed to convert iPLA2β from a “closed” to an “open” state, by penetrating the membrane and orienting such that its hydrophilic face (R710, K719) is positioned to interact with phospholipid head groups and its hydrophobic face (P711; P714; W715; L717; L721; W722) is positioned to interact with the fatty acid chains (Bucher, Hsu, Mouchlis, Dennis, & McCammon, 2013; Mouchlis et al., 2015). Based on these observations, an intriguing hypothesis has been proposed that the membrane is an allosteric regulator of iPLA2β activity (Mouchlis et al., 2015).
In short, DXMS has provided novel insights into the molecular mechanisms governing iPLA2β interaction with both substrate phospholipids and the membranes in which these molecules reside. A notable corollary to these studies is the potential to apply DXMS (together with other biophysical, structural, and biochemical approaches) to facilitate rational design of selective inhibitors of iPLA2β (Mouchlis, Limnios, et al., 2016).
3. SUMMARY
iPLA2β-derived lipids have critical roles in various biological processes and altered accumulation of these bioactive lipids, due to dysregulation of iPLA2β expression or activation, can have profound consequences. Continued studies of this enzyme and its biology will therefore lead to a greater understanding of the roles that bioactive lipids play in the onset and progression of various disease states. They will also facilitate identification of novel pathways that can be targeted for drug therapy. The approaches described herein will facilitate measurement of iPLA2β activity, purification of iPLA2β from biological samples, and further delineation of conformational changes in iPLA2β subsequent to membrane/substrate/inhibitor binding. Also provided are means to assess membrane dynamics of iPLA2β. For a more comprehensive review of the iPLA2s and related citations, the reader is kindly directed to the recent publication by Ramanadham et al. (2015).
| Tube # | Protein (μL) |
HB (μL) |
dH2O (μL) |
AB (μL) |
EGTA (μL) |
ATP (μL) |
S-BEL (μL) |
Substrate (μL) |
TV (μL) |
|---|---|---|---|---|---|---|---|---|---|
| 1 (blank) | 0 | 100 | 35 | 50 | 10 | 0 | 0 | 5 | 200 |
| 2 | Total=100 | 35 | 50 | 10 | 0 | 0 | 5 | 200 | |
| 3 | Total=100 | -ATP (μL) | 50 | 10 | 10 | 0 | 5 | 200 | |
| 4 | Total=100 | -BEL (μL) | 50 | 10 | 0 | 10 | 5 | 200 | |
| 5 | Total=100 | -ATP -BEL (μL) |
50 | 10 | 10 | 10 | 5 | 200 | |
| 6 | Total=100 | 35 | 50 | 10 | 0 | 0 | 5 | 200 | |
| Total=100 | 35 | 50 | 10 | 200 | |||||
| Total=100 | 35 | 50 | 10 | 200 | |||||
| Total=100 | 35 | 50 | 10 | 200 | |||||
| N (blank) | 0 | 100 | 35 | 50 | 10 | 0 | 0 | 5 | 200 |
Acknowledgments
Methods described here were developed in association with projects funded by the American Diabetes Association and NIH/NIDDK (R01-69455).
References
- Ackermann EJ, Kempner ES, Dennis EA. Ca2+-independent cytosolic phospholipase A2 from macrophage-like P388D1 cells. Isolation and characterization. The Journal of Biological Chemistry. 1994;269:9227–9233. [PubMed] [Google Scholar]
- Ali T, Kokotos G, Magrioti V, Bone RN, Mobley JA, Hancock W, et al. Characterization of FKGK18 as inhibitor of group VIA Ca2+-independent phospholipase A2 (iPLA2β): Candidate drug for preventing beta-cell apoptosis and diabetes. PLoS One. 2013;8:e71748. doi: 10.1371/journal.pone.0071748. [DOI] [PMC free article] [PubMed] [Google Scholar]
- Balboa MA, Balsinde J, Jones SS, Dennis EA. Identity between the Ca2+- independent phospholipase A2 enzymes from P388D1 macrophages and Chinese hamster ovary cells. The Journal of Biological Chemistry. 1997;272:8576–8580. doi: 10.1074/jbc.272.13.8576. [DOI] [PubMed] [Google Scholar]
- Batchu KC, Hokynar K, Jeltsch M, Mattonet K, Somerharju P. Substrate efflux propensity is the key determinant of iPLA2β-mediated glycerophospholipid hydrolysis. Journal of Biological Chemistry. 2015;290(16):10093–10103. doi: 10.1074/jbc.M115.642835. [DOI] [PMC free article] [PubMed] [Google Scholar]
- Bennett-Lovsey RM, Herbert AD, Sternberg MJ, Kelley LA. Exploring the extremes of sequence/structure space with ensemble fold recognition in the program Phyre. Proteins. 2008;70:611–625. doi: 10.1002/prot.21688. [DOI] [PubMed] [Google Scholar]
- Bucher D, Hsu YH, Mouchlis VD, Dennis EA, McCammon JA. Insertion of the Ca2+-independent phospholipase A2 into a phospholipid bilayer via coarse-grained and atomistic molecular dynamics simulations. PLoS Computational Biology. 2013;9:e1003156. doi: 10.1371/journal.pcbi.1003156. [DOI] [PMC free article] [PubMed] [Google Scholar]
- Burke JE, Babakhani A, Gorfe AA, Kokotos G, Li S, Woods VL, Jr, et al. Location of inhibitors bound to group IVA phospholipase A2 determined by molecular dynamics and deuterium exchange mass spectrometry. Journal of the American Chemical Society. 2009;131:8083–8091. doi: 10.1021/ja900098y. [DOI] [PMC free article] [PubMed] [Google Scholar]
- Burke JE, Karbarz MJ, Deems RA, Li S, Woods VL, Jr, Dennis EA. Interaction of group IA phospholipase A2 with metal ions and phospholipid vesicles probed with deuterium exchange mass spectrometry. Biochemistry. 2008;47:6451–6459. doi: 10.1021/bi8000962. [DOI] [PMC free article] [PubMed] [Google Scholar]
- Cao J, Burke JE, Dennis EA. Using hydrogen/deuterium exchange mass spectrometry to define the specific interactions of the phospholipase A2 superfamily with lipid substrates, inhibitors, and membranes. The Journal of Biological Chemistry. 2013;288:1806–1813. doi: 10.1074/jbc.R112.421909. [DOI] [PMC free article] [PubMed] [Google Scholar]
- Carper MJ, Zhang S, Turk J, Ramanadham S. Skeletal muscle group VIA phospholipase A2 (iPLA2beta): Expression and role in fatty acid oxidation. Biochemistry. 2008;47:12241–12249. doi: 10.1021/bi800923s. [DOI] [PMC free article] [PubMed] [Google Scholar]
- Dennis EA, Cao J, Hsu YH, Magrioti V, Kokotos G. Phospholipase A2 enzymes: Physical structure, biological function, disease implication, chemical inhibition, and therapeutic intervention. Chemical Reviews. 2011;111:6130–6185. doi: 10.1021/cr200085w. [DOI] [PMC free article] [PubMed] [Google Scholar]
- Gallagher ES, Hudgens JW. Mapping protein–ligand interactions with proteolytic fragmentation, hydrogen/deuterium exchange-mass spectrometry. In: Zvi K, editor. Methods in enzymology. Cambridge, MA: Academic Press; 2016. pp. 357–404. [chapter 14] [DOI] [PubMed] [Google Scholar]
- Ghosh M, Tucker DE, Burchett SA, Leslie CC. Properties of the Group IV phospholipase A2 family. Progress in Lipid Research. 2006;45:487–510. doi: 10.1016/j.plipres.2006.05.003. [DOI] [PubMed] [Google Scholar]
- Gijon MA, Leslie CC. Phospholipases A2. Seminars in Cell & Developmental Biology. 1997;8:297–303. doi: 10.1006/scdb.1997.0151. [DOI] [PubMed] [Google Scholar]
- Gross RW, Ramanadham S, Kruszka KK, Han X, Turk J. Rat and human pancreatic islet cells contain a calcium ion independent phospholipase A2 activity selective for hydrolysis of arachidonate which is stimulated by adenosine triphosphate and is specifically localized to islet beta-cells. Biochemistry. 1993;32:327–336. doi: 10.1021/bi00052a041. [DOI] [PubMed] [Google Scholar]
- Hamuro Y, Anand GS, Kim JS, Juliano C, Stranz DD, Taylor SS, et al. Mapping intersubunit interactions of the regulatory subunit (RIalpha) in the type I holoenzyme of protein kinase A by amide hydrogen/deuterium exchange mass spectrometry (DXMS) Journal of Molecular Biology. 2004;340:1185–1196. doi: 10.1016/j.jmb.2004.05.042. [DOI] [PubMed] [Google Scholar]
- Hazen S, Zupan L, Weiss R, Getman D, Gross R. Suicide inhibition of canine myocardial cytosolic calcium-independent phospholipase A2. Mechanism-based discrimination between calcium-dependent and -independent phospholipases A2. The Journal of Biological Chemistry. 1991;266:7227–7232. [PubMed] [Google Scholar]
- Hsu YH, Bucher D, Cao J, Li S, Yang SW, Kokotos G, et al. Fluoroketone inhibition of Ca2+-independent phospholipase A2 through binding pocket association defined by hydrogen/deuterium exchange and molecular dynamics. Journal of the American Chemical Society. 2013;135:1330–1337. doi: 10.1021/ja306490g. [DOI] [PMC free article] [PubMed] [Google Scholar]
- Hsu YH, Burke JE, Li S, Woods VL, Jr, Dennis EA. Localizing the membrane binding region of Group VIA Ca2+-independent phospholipase A2 using peptide amide hydrogen/deuterium exchange mass spectrometry. The Journal of Biological Chemistry. 2009;284:23652–23661. doi: 10.1074/jbc.M109.021857. [DOI] [PMC free article] [PubMed] [Google Scholar]
- Hsu YH, Burke JE, Stephens DL, Deems RA, Li S, Asmus KM, et al. Calcium binding rigidifies the C2 domain and the intradomain interaction of GIVA phospholipase A2 as revealed by hydrogen/deuterium exchange mass spectrometry. The Journal of Biological Chemistry. 2008;283:9820–9827. doi: 10.1074/jbc.M708143200. [DOI] [PMC free article] [PubMed] [Google Scholar]
- Jenkins CM, Han X, Mancuso DJ, Gross RW. Identification of calcium-independent phospholipase A2 (iPLA2)beta, and not iPLA2gamma, as the mediator of arginine vasopressin-induced arachidonic acid release in A-10 smooth muscle cells. Enantioselective mechanism-based discrimination of mammalian iPLA2s. The Journal of Biological Chemistry. 2002;277:32807–32814. doi: 10.1074/jbc.M202568200. [DOI] [PubMed] [Google Scholar]
- Jenkins CM, Mancuso DJ, Yan W, Sims HF, Gibson B, Gross RW. Identification, cloning, expression, and purification of three novel human calcium-independent phospholipase A2 family members possessing triacylglycerol lipase and acylglycerol transacylase activities. The Journal of Biological Chemistry. 2004;279:48968–48975. doi: 10.1074/jbc.M407841200. [DOI] [PubMed] [Google Scholar]
- Jenkins CM, Yan W, Mancuso DJ, Gross RW. Highly selective hydrolysis of fatty acyl-CoAs by calcium-independent phospholipase A2beta. Enzyme auto-acylation and acyl-CoA-mediated reversal of calmodulin inhibition of phospholipase A2 activity. The Journal of Biological Chemistry. 2006;281:15615–15624. doi: 10.1074/jbc.M511623200. [DOI] [PubMed] [Google Scholar]
- Jones SS, Tang J, Kriz R, Shaffer M, Knopf J, Seehra J. Isolation, molecular cloning and expression of a novel calcium-independent phospholipase A2. The FASEB Journal. 1996;10:A977. [Google Scholar]
- Kalyvas A, Baskakis C, Magrioti V, Constantinou-Kokotou V, Stephens D, Lopez-Vales R, et al. Differing roles for members of the phospholipase A2 superfamily in experimental autoimmune encephalomyelitis. Brain: A Journal of Neurology. 2009;132:1221–1235. doi: 10.1093/brain/awp002. [DOI] [PMC free article] [PubMed] [Google Scholar]
- Kokotos G, Hsu YH, Burke JE, Baskakis C, Kokotos CG, Magrioti V, et al. Potent and selective fluoroketone inhibitors of group VIA calcium-independent phospholipase A2. Journal of Medicinal Chemistry. 2010;53:3602–3610. doi: 10.1021/jm901872v. [DOI] [PMC free article] [PubMed] [Google Scholar]
- Larsson PKA, Claesson HE, Kennedy BP. Multiple splice variants of the human calcium-independent phospholipase A2 and their effect on enzyme activity. The Journal of Biological Chemistry. 1998;273:207–214. doi: 10.1074/jbc.273.1.207. [DOI] [PubMed] [Google Scholar]
- Li H, Zhao Z, Antalis C, Zhao Z, Emerson R, Wei G, et al. Combination therapy of an inhibitor of group VIA phospholipase A2 with paclitaxel is highly effective in blocking ovarian cancer development. The American Journal of Pathology. 2011;179:452–461. doi: 10.1016/j.ajpath.2011.03.027. [DOI] [PMC free article] [PubMed] [Google Scholar]
- Lio YC, Dennis EA. Interfacial activation, lysophospholipase and transacylase activity of group VI Ca2+-independent phospholipase A2. Biochimica et Biophysica Acta. 1998;1392:320–332. doi: 10.1016/s0005-2760(98)00049-6. [DOI] [PubMed] [Google Scholar]
- Lopez-Vales R, Ghasemlou N, Redensek A, Kerr BJ, Barbayianni E, Antonopoulou G, et al. Phospholipase A2 superfamily members play divergent roles after spinal cord injury. The FASEB Journal. 2011;25:4240–4252. doi: 10.1096/fj.11-183186. [DOI] [PMC free article] [PubMed] [Google Scholar]
- Lopez-Vales R, Navarro X, Shimizu T, Baskakis C, Kokotos G, Constantinou-Kokotou V, et al. Intracellular phospholipase A2 group IVA and group VIA play important roles in Wallerian degeneration and axon regeneration after peripheral nerve injury. Brain: A Journal of Neurology. 2008;131:2620–2631. doi: 10.1093/brain/awn188. [DOI] [PMC free article] [PubMed] [Google Scholar]
- Ma Z, Ramanadham S, Hu Z, Turk J. Cloning and expression of a group IV cytosolic Ca2+-dependent phospholipase A2 from rat pancreatic islets. Comparison of the expressed activity with that of an islet group VI cytosolic Ca2+-independent phospholipase A2. Biochimica et Biophysica Acta. 1998;1391:384–400. doi: 10.1016/s0005-2760(98)00027-7. [DOI] [PubMed] [Google Scholar]
- Ma Z, Ramanadham S, Kempe K, Chi XS, Ladenson J, Turk J. Pancreatic islets express a Ca2+-independent phospholipase A2 enzyme that contains a repeated structural motif homologous to the integral membrane protein binding domain of ankyrin. The Journal of Biological Chemistry. 1997;272:11118–11127. [PubMed] [Google Scholar]
- Mancuso DJ, Jenkins CM, Gross RW. The genomic organization, complete mRNA sequence, cloning, and expression of a novel human intracellular membrane-associated calcium-independent phospholipase A2. The Journal of Biological Chemistry. 2000;275:9937–9945. doi: 10.1074/jbc.275.14.9937. [DOI] [PubMed] [Google Scholar]
- Mouchlis VD, Bucher D, McCammon JA, Dennis EA. Membranes serve as allosteric activators of phospholipase A2, enabling it to extract, bind, and hydrolyze phospholipid substrates. Proceedings of the National Academy of Sciences of the United States of America. 2015;112:E516–E525. doi: 10.1073/pnas.1424651112. [DOI] [PMC free article] [PubMed] [Google Scholar]
- Mouchlis VD, Dennis EA. Membrane and inhibitor interactions of intracellular phospholipases A2. Advances in Biological Regulation. 2016;61:17–24. doi: 10.1016/j.jbior.2015.11.011. [DOI] [PMC free article] [PubMed] [Google Scholar]
- Mouchlis VD, Limnios D, Kokotou MG, Barbayianni E, Kokotos G, McCammon JA, et al. Development of potent and selective inhibitors for group VIA calcium-independent phospholipase A2 guided by molecular dynamics and structure-activity relationships. Journal of Medicinal Chemistry. 2016;59:4403–4414. doi: 10.1021/acs.jmedchem.6b00377. [DOI] [PMC free article] [PubMed] [Google Scholar]
- Mouchlis VD, Morisseau C, Hammock BD, Li S, McCammon JA, Dennis EA. Computer-aided drug design guided by hydrogen/deuterium exchange mass spectrometry: A powerful combination for the development of potent and selective inhibitors of Group VIA calcium-independent phospholipase A2. Bioorganic & Medicinal Chemistry. 2016 doi: 10.1016/j.bmc.2016.05.009. http://dx.doi.org/10.1016/j.bmc.2016.05.009. pii: S0968-0896(16)30333-9. [Epub ahead of print] [DOI] [PMC free article] [PubMed]
- Ong WY, Farooqui T, Kokotos G, Farooqui AA. Synthetic and natural inhibitors of phospholipases A2: Their importance for understanding and treatment of neurological disorders. ACS Chemical Neuroscience. 2015;6:814–831. doi: 10.1021/acschemneuro.5b00073. [DOI] [PubMed] [Google Scholar]
- Percy AJ, Rey M, Burns KM, Schriemer DC. Probing protein interactions with hydrogen/deuterium exchange and mass spectrometry—A review. Analytica Chimica Acta. 2012;721:7–21. doi: 10.1016/j.aca.2012.01.037. [DOI] [PubMed] [Google Scholar]
- Ramanadham S, Ali T, Ashley JW, Bone RN, Hancock WD, Lei X. Calcium-independent phospholipases A2 and their roles in biological processes and diseases. Journal of Lipid Research. 2015;56:1643–1668. doi: 10.1194/jlr.R058701. [DOI] [PMC free article] [PubMed] [Google Scholar]
- Ramanadham S, Wolf MJ, Jett PA, Gross RW, Turk J. Characterization of an ATP-stimulatable Ca2+-independent phospholipase A2 from clonal insulin-secreting HIT cells and rat pancreatic islets: A possible molecular component of the beta-cell fuel sensor. Biochemistry. 1994;33:7442–7452. doi: 10.1021/bi00189a052. [DOI] [PubMed] [Google Scholar]
- Rost B, Yachdav G, Liu J. The PredictProtein server. Nucleic Acids Research. 2004;32:W321–W326. doi: 10.1093/nar/gkh377. [DOI] [PMC free article] [PubMed] [Google Scholar]
- Tang J, Kriz RW, Wolfman N, Shaffer M, Seehra J, Jones SS. A novel cytosolic calcium-independent phospholipase A2 contains eight ankyrin motifs. The Journal of Biological Chemistry. 1997;272:8567–8575. doi: 10.1074/jbc.272.13.8567. [DOI] [PubMed] [Google Scholar]
- Wolf MJ, Gross RW. Expression, purification, and kinetic characterization of a recombinant 80-kDa intracellular calcium-independent phospholipase A2. The Journal of Biological Chemistry. 1996;271:30879–30885. doi: 10.1074/jbc.271.48.30879. [DOI] [PubMed] [Google Scholar]