Abstract
Bacteria in the human gut have the ability to activate, inactivate, and reactivate drugs with both intended and unintended effects. For example, the drug digoxin is reduced to the inactive metabolite dihydrodigoxin by the gut Actinobacterium E. lenta, and patients colonized with high levels of drug metabolizing strains may have limited response to the drug. Understanding the complete space of drugs that are metabolized by the human gut microbiome is critical for predicting bacteria-drug relationships and their effects on individual patient response. Discovery and validation of drug metabolism via bacterial enzymes has yielded >50 drugs after nearly a century of experimental research. However, there are limited computational tools for screening drugs for potential metabolism by the gut microbiome. We developed a pipeline for comparing and characterizing chemical transformations using continuous vector representations of molecular structure learned using unsupervised representation learning. We applied this pipeline to chemical reaction data from MetaCyc to characterize the utility of vector representations for chemical reaction transformations. After clustering molecular and reaction vectors, we performed enrichment analyses and queries to characterize the space. We detected enriched enzyme names, Gene Ontology terms, and Enzyme Consortium (EC) classes within reaction clusters. In addition, we queried reactions against drug-metabolite transformations known to be metabolized by the human gut microbiome. The top results for these known drug transformations contained similar substructure modifications to the original drug pair. This work enables high throughput screening of drugs and their resulting metabolites against chemical reactions common to gut bacteria.
Keywords: Chemoinformatics, Matched molecular pair, Vector embedding, Drug metabolism, Microbiome
1. Introduction
The trillions of microorganisms that colonize the human gastrointestinal tract (the gut microbiome) encode a diverse array of enzymes that catalyze the biotransformation of therapeutics drugs prior to or after absorption. The downstream microbial metabolites can have clinically relevant changes to their pharmacological properties, including the activation of prodrugs, drug inactivation, and the reactivation of drugs subsequent to host metabolism.1 The cardiac drug digoxin is a textbook example, wherein gut bacterial drug inactivation prior to drug absorption can reduce the bioavailability and thus efficacy of this essential medication. Digoxin is used to treat cardiac arrhythmia and heart failure and has a narrow therapeutic index. Although the bacterial metabolism of digoxin by the gut Actinobacterium Eggerthella lenta was originally described in 1983,2 the enzymes responsible remained unknown for 30 years. Our prior work identified a 2-gene operon, referred to as the cardiac glycoside reductase (cgr) operon, unique to a digoxin metabolizing strain of E. lenta.3; 4 Similar studies have implicated the gut microbiome in the metabolism of >50 distinct drugs, spanning multiple diseases,1; 5 but no systematic experimental or computational analyses have been performed on the full set of FDA-approved compounds. Thus, the full scope of drugs that are metabolized or transformed by the human gut microbiome is currently unknown, representing a major gap in the scientific literature with immediate clinical implications.
The major bottleneck to a comprehensive view of gut microbial drug metabolism is the challenge of developing high-throughput analytical approaches to quantifying the parent compounds and all its possible metabolites. Typically, this is done by incubating cultured gut bacteria with a given drug and analyzing cell-free supernatants by mass spectrometry, a chemical-level technique used to detect quantities of molecules in a given substance.6 Mass spectrometry interrogates the gut microbiome and its effects on forming metabolites in plasma, feces and urine.7 While experimental techniques provide evidence of drug metabolism, they become time intensive and challenging when applied to large quantities of drugs. Therefore, there is a need for in silico methods that do not rely solely on experimental techniques. Quantitative structure-activity relationship (QSAR) modeling includes a set of computational techniques that are used for predicting the bioactivities of drugs by extrapolating from data observed for similar structures.8 However, traditional QSAR methods have limited ability to address biotransformations, because they focus on individual molecules, while chemical transformations are defined over pairs of molecules.9 Thus, there remains a need for efficient and effective in silico approaches for characterizing the properties of molecular transformations to enhance our understanding of drug metabolism in the human gut.
Matched molecular pair analysis (MMPA) is a specialized branch of QSAR modeling predicated on the concept of matched molecular pairs (MMPs) – two chemical structures that differ by a small, well-defined transformation.10 For example, substrate-product pairs arising from hydroxylation by CYP3A4 are matched molecular pairs. A number of approaches to MMPA have been developed.11 Fragment indexing based methods12 are the most popular because they are efficient, but limited by exact matches. Such methods may fail to identify near-MMPs transformations relevant to an analysis, such as multiple site substitutions or transformations that do not occur at non-ring single bond sites.13 Furthermore, they consider transformations independent of the surrounding molecular context.14 We have reported an approach to address these limitations using kernel PCA embedded vector representations of molecules and principals of compositional semantics from computational linguistics.15 While computational methods exist to compare, classify, and search enzymatic reactions16–21, they frequently rely on direct comparison of molecular fingerprints as well as specific bond or atom changes within the molecule. Our approach allows for the representation of chemical transformations as algebraic expressions of chemical structure vectors. We hypothesize that molecules in chemical reactions can form analogous pairs with molecules in other reactions and be used to identify similar classes of reactions. Furthermore, we can use such methods to identify chemical reactions with high similarity to drug-metabolite pairs. These methods could give us the tools to build a system that leverages the structural properties of chemical reactions and their enzymes as a proxy for drug metabolism.
While experimental methods for linking the human gut microbiome to drug metabolism are accelerating, there are still no high-throughput screening tools that could be broadly applied to all current drugs. Our work provides an important step towards this grand challenge by combining chemical reaction data with the concept of vector embeddings for molecules. We demonstrate the feasibility of detecting potential drug metabolism via bacteria in the human gut.
2. Methods
We introduce a pipeline for constructing a vector space for chemical reactions. This pipeline includes data processing, vector space construction and characterization, and chemical reaction and drug querying.
2.1. Data sources and processing
The chemical space and reaction set contained compounds and reactions from the MetaCyc metabolic pathway database.22 We used the primary metabolic pathways provided by MetaCyc to generate a reaction list, react_list, that contained reaction name, direction, primary substrate compound, primary product, and Simplified Molecular Input Line Entry Specification codes (SMILES)23 for each reaction. The unfiltered react_list contained 10,180 reactions, of which 8,981 were bacterial and 670 were E. coli specific. In addition, we constructed a list of 23 drug-metabolite pairs with identifiable structures from a curated list of known drugs modified by gut bacteria from Spanogiannopoulos et al.1 These transformations were also added to react_list. Additionally, we removed reactions with high molecular weight compounds (>700) and those where the primary compounds are common types from a curated list, including “proton”, “coenzyme-A”, “water”, "NADP", "NADPH", etc. in order to include only relevant small molecules in the transformations. The final react_list contained 5,241 reactions, including 23 drug reactions, 5,116 bacterial reactions and 394 E. coli-specific reactions. To create the vector space we used all compounds from our dataset, not just those found in react_list. This compound set contained 11,893 unique compounds, a set we define as compound_dataset with size num_compounds.
2.2. Constructing molecular vector space
The pipeline for constructing a molecular vector space is depicted in Figure 1 and previously described.15 In summary, the pipeline takes SMILES as input, generates molecular fingerprints, and embeds the molecular fingerprints using kernel principal component analysis (KPCA).24 From all compounds in reactions in compound_dataset, we used the corresponding SMILES string to generate chemical fingerprints. Specifically, we stored each compound using MACCS keys to encode molecular structure in a condensed bit vector.25 To construct each vector, we used RDKit, an open source cheminformatics software for Python.26 We used Tanimoto similarity (aka Jaccard index)27 as the kernel function for kernel PCA using the molecular fingerprints. Therefore the resulting vector space matrix, Transformed Vector Space Matrix (TVSM), is of dimension (num_compounds, num_dimensions). We stored the mappings of row numbers in TVSM to compound names in a separate data structure. Next, we generated a scree plot to determine which components of the decomposition account for the majority of the variance in data (Figure S1). Since the scree plot plateaued at d = 8, we used that as a cutoff for the number of dimensions for each compound in TVSM. Using this cutoff, TVSM’s final dimensions were 11,893 by 8.
Fig. 1.
Pipeline for constructing a vector space for a set of compounds. Starting with the full set of compounds, we generated fingerprints of all compounds, computed their pairwise Tanimoto similairities, and finally transformed the similarity matrix to the vector space matrix (TVSM) using kernel PCA. Matrix dimensions are included for both the similarity matrix and the vector space matrix (TVSM).
2.3. Characterizing vector spaces
Next, we evaluated the effectiveness of the TVSM.
2.3.1. Molecule-level Analysis
To characterize types of chemical compound information stored in the TVSM, we clustered the vectors representing compounds using KMeans and performed an enrichment analysis to detect clusters of given chemical types. We computed the gap statistic28, using a Python implementation29, in order to find appropriate values of k at both the molecular and reaction levels.
To visualize the space, we used t-Distributed Stochastic Neighbor Embedding (t-SNE), a method which uses probability distributions to transform high dimensional data into 2 or 3-dimensions.30
We performed a hypergeometric enrichment analysis with a Bonferroni correction to determine enriched molecule types for each cluster. We used Chemical Entities of Biological Interest (ChEBI)31 ontology, which contains hierarchies for a large portion of the compounds found in our dataset. To give each molecule a ChEBI label, we observed that all molecules have the same top-level ChEBI term, either 72695 (for organic molecule) or 50860 (organic molecular entity). We then take the following three ChEBI terms downstream in the tree and create a tuple out of them. If there are multiple paths, we include all of these as descriptor types. An example tuple is depicted in Figure S2. For each compound in compound_dataset, we generated its ChEBI tuple and ran enrichment analysis on a clustering of the data.
2.3.2. Reaction-Level Analysis
To detect types of chemical reactions encoded in the vector space, we applied KMeans clustering to reaction vectors constructed using MetaCyc reactions. We constructed a vector for each reaction by subtracting vector A from vector B from TVSM for all reactions A → B in react_list. We applied the same KMeans methodology and series of experiments from the molecule clustering to these difference vectors. Additionally to evaluate the effectiveness of reaction clusters created using KMeans, we performed an enrichment analysis to characterize clusters by enzymes that catalyze the reactions. For this task, we wished to glean what reaction types were characteristic of each cluster using enzymes as a proxy for the reaction type. We performed these analyses using data from MetaCyc: both unigram and bigram enzyme names (see Suppl), Enzyme Consortium (EC) class numbers, and Gene Ontology (GO) codes for Molecular Function.32
2.4. Querying drug-metabolite pairs against reaction vectors
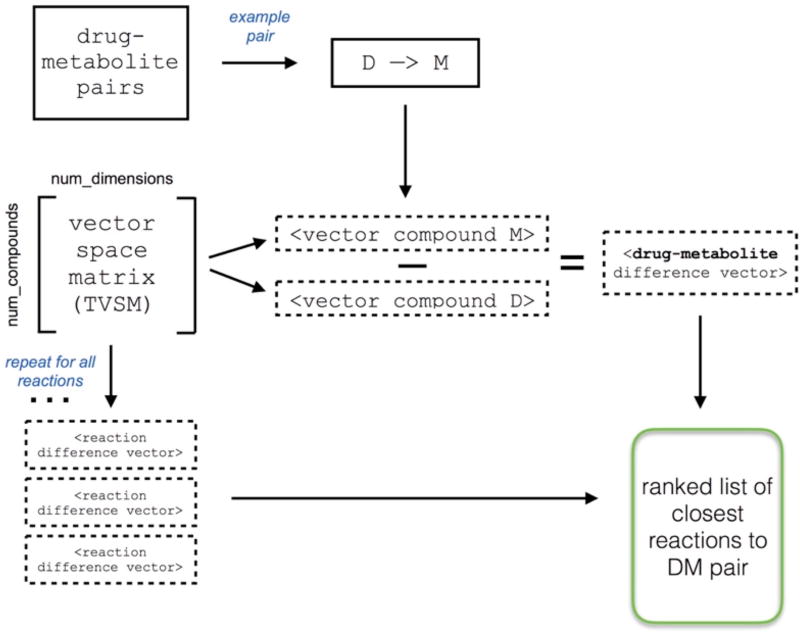
To find the most similar chemical reactions in the TVSM, we queried reactions against drug-metabolite pairs. The query pipeline is depicted in Figure 2. To detect the most similar reactions to the query, we selected the k most similar difference vectors, using both Euclidean and cosine distance metrics. For each drug-metabolite pair, we constructed a difference vector by subtracting the drug vector from the metabolite vector. We next computed the similarity between the drug transformation vector and each reaction difference vector in our dataset. This resulted in a ranked list of all reactions for each drug-metabolite pair based on similarity between the drug and reaction difference vectors.
Fig. 2.
Pipeline for querying reactions for drug-metabolite pairs. For each drug-metabolite pair, we subtract the drug vector from the metabolite vector to construct a difference vector. We repeat this process for all reactions in the dataset to create a ranked list of reactions most similar to the original drug-metabolite query.
3. Results
3.1. Molecule-level analysis
KMeans clustering of all compounds using the TVSM resulted in clusters of similar compounds. Using the gap statistic, the optimal number of clusters was k=40 (from range k=1–50).
To visualize the high dimensional space of TVSM, we used t-SNE to visualize both 2D and 3D representations of the data. Molecules in this space, particularly at the 2D level, are clustered close to others in the cluster (Figure 3A). This suggests that the points in the clusters formed from this method have small intra-cluster distances, which is confirmed when adding another dimension (Figure 3B).
Fig. 3.
t-SNE plots in 2D(A), 3D(B) of molecules in TVSM, clustered using KMeans with k=40. Colors identify clusters and are the same across Figures 3A and 3B.
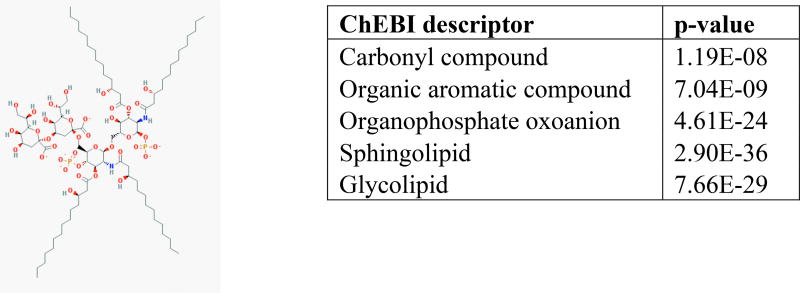
After performing an enrichment test using ChEBI tuples, we found that many of the clusters contained similar ChEBI terms. For example, one cluster was predominantly made up of ring structures, another of lipids, and others, such as cluster 25 depicted in Figure 4, captured many different types. For cluster 25 specifically, the molecules in the cluster were a combination of the enriched terms. In addition, clusters contained high intra-cluster molecular similarity (mean pairwise Tanimoto similarity of molecular MACCS keys in Table S9).
Fig. 4.
Results from enrichment analysis on cluster 25 from KMeans clustering with k=40 on TVSM. We also show an example structure (alpha-Kdo-(2–>4)-alpha-Kdo-(2–>6)-lipid IVA) from this cluster. Full results can be found in Supplementary Table S1.
3.2. Reaction-level analysis
To select k for KMeans clustering on the reaction vectors, we computed k = 32 using the gap statistic. To visualize the high dimensional space of reaction vectors, we used t-SNE to visualize a 2D representation of the data. After clustering the reaction vectors with k = 32, we discovered that the reaction vectors were not evenly distributed between different clusters, but instead one cluster contained 38% of the data (labeled cluster 12 during clustering). During visualization using t-SNE (Figure 5A), this cluster spanned the entire two-dimensional space and did not contain signal for specific reactions. To detect further clusters within cluster 12, we performed k-means clustering (computed k = 45) on reactions occurring within this cluster. Using t-SNE for 2-D visualization in Figure 5B, points within individual clusters are closer to each other than those in other clusters. This is in direct contrast to the t-SNE plot for the full data in Figure 5A, where the points in cluster 12 spanned the entire space.
Fig. 5.
t-SNE plots in 2D for all reaction vectors (A) and reactions in cluster 12 (B), clustered using KMeans. Colors identify clusters.
Reaction cluster enrichment results for GO Molecular Function terms and EC numbers from three of the clusters are found in Table 1. The enriched GO codes matched the functionality of the enzymes and were corroborated by the enriched EC numbers and expanded on the unigram, bigram, and GO enrichment results (Tables S2–S6). For example, cluster 20 mapped to GO:0047893, which is consistent with EC number 2.4.1 hexosyltransferase and cluster 23 mapped to GO:0008934 inositol monophosphate 1-phosphatase activity, which is consistent with EC number 3.1.3 (phosphoric monoester hydrolases). In addition, cluster 3 is enriched with GO term “3-beta-hydroxy-delta5-steroid dehydrogenase activity”, consistent with enrichment with EC class 1.1.1.-(oxidoreductases, acting on the CH-OH group of donors, with NAD(+) or NADP(+) as acceptor).
Table 1.
Results from enrichment analysis on select clusters from KMeans clustering (k = 32). We report one enriched group for each category in three clusters. Full results can be found in Supplementary Tables S2–S5.
| Cluster | EC number (p-value) | GO-code (p-value) |
|---|---|---|
| 3 | 1.1.1 Oxidoreductases, acting on the CH-OH group of donors, with NAD(+) or NADP(+) as acceptor. (3.12e-36) | 0003854 3-beta-hydroxy- delta5-steroid dehydrogenase activity (5.09e-10) |
| 20 | 2.4.1 hexosyltransferase (2.28e-84) | 0047893 flavonol 3-O-glucosyltransferase activity (1.22e-07) |
| 23 | 3.1.3 Phosphoric monoester hydrolases (2.11e-50) | 0008934 inositol monophosphate-1- phosphatase activity (8.16e-08) |
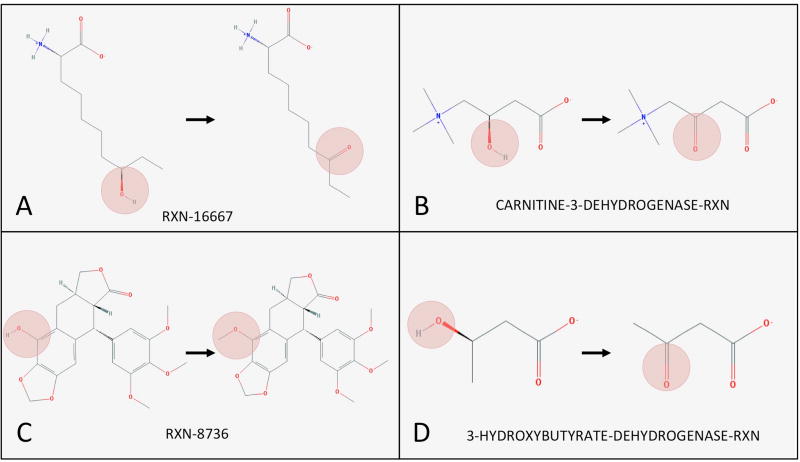
For cluster 3 from Table 1, we show sample reactions in Figure 6. The oxidation of an OH group is found in A, B, and D in Figure 6. While the cluster is enriched for dehydrogenase reactions, the cluster is not composed solely of those reactions. In particular, reaction C in Figure 6 is methylation. Despite the inclusion of additional types of reactions in individual clusters, the clusters contained signal for specific types of reactions compared to the overall set of reactions in the dataset.
Fig. 6.
Sample reactions from cluster #3 from KMeans clustering on reaction vectors. Reactions in this cluster were predominantly characterized by oxidation. The transformations in the sample reactions are highlighted. Reaction identifiers from MetaCyc are included for each reaction.
3.3. Querying reaction vectors against drug-metabolite pairs
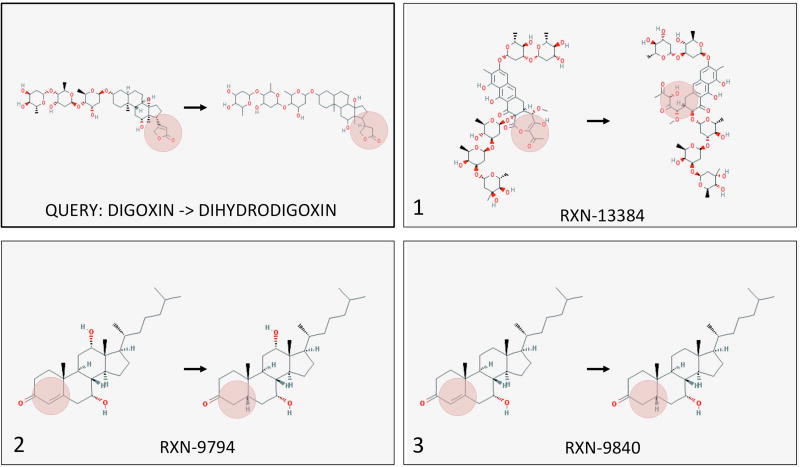
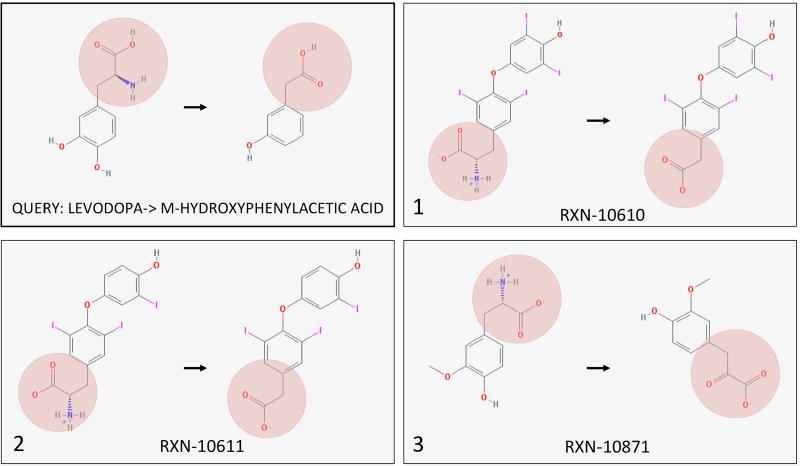
For each drug metabolite pair, we ranked all reactions by similarity of their reaction vector to the drug-metabolite vector to find the top 10 closest reactions. Here, we show examples of the drugs Digoxin and Levodopa in Figures 7 and 8, respectively. Full results can be found in the Supplementary Tables S7 and S8. As we are particularly interested in bacterial reactions, we mapped each reaction to any bacterial pathway or more specifically E. coli as a representative gut bacterial species. While all top 10 reactions for all 23 drugs existed in bacterial pathways, several top hits were present in E. coli pathways. For example, the transformation of sorivudine to E-5-(2-bromovinyl)uracil was similar to the transformation of beta-nicotinate D-ribonucleotide to nicotinate adenine dinucleotide. Similarly, the second closest reaction vector to the transformation of zonisamide to 2-sulfamoylacetylphenol was present in E. coli metabolic pathways.
Fig. 7.
The three closest reactions to drug-metabolite pair digoxin-dihydrodigoxin. The retrieved reactions are categorized by the hydrogenation of a double bond in a ring.
Fig. 8.
The three closest reactions to drug-metabolite pair levodopa-m-hydroxyphenylacetic acid. The retrieved reactions are characterized by deamination to form a ketone and then decarboxylation of the ketone, occurring near a ring structure.
Figure 7 depicts the three closest reactions to digoxin and its inactive metabolite dihydrodigoxin. While our current experimental data suggests that the cgr operon of E. lenta is capable of reducing the double bond in the α,β-unsaturated lactone of digoxin, the top reaction represents a more complex ring opening reaction. The second and third ranked reactions were more in line with our expectations, depicting reduction of a double bond in a ring. For levodopa (another drug metabolized by gut bacteria), we see the deamination to form a ketone and then decarboxylation of the ketone, occurring near a ring structure (Figure 8). The second ranked reaction was nearly identical to levodopa, and the first and third reactions were highly similar to each other. Because the reaction set contained all reactions regardless of similarity within the set, it is unsurprising that similar reactions rank highly to the same query drug-metabolite pair. In both figures it is apparent that while the top reactions have different overall structures, their local transformations are similar.
4. Discussion
Understanding the space of reactions that occur in the gut microbiome is a critical step towards predicting the intricacies of drug metabolism in the human gut. Bacteria can metabolize drugs via many different enzymes, in particular those catalyzing reduction and oxidation reactions.1; 33; 34 Knowledge of types of reaction transformations occurring in bacteria as well as specific bacterial enzymes are necessary for predicting potential drug metabolism. Not only do we know of relatively few cases of drug metabolism, research is ongoing for detecting bacterial enzymes relevant to the gut microbiome.35 In this work, we described a pipeline for constructing chemical embeddings for chemical reactions. In addition, we characterized the resulting reaction vectors using enzymes from MetaCyc. While all 23 drugs in our system had transformation vectors close to bacterial reaction vectors, four drugs had at least one reaction from E. coli in the three closest reaction vectors. While MetaCyc does not contain the complete set of enzymatic reactions occurring in the gut microbiome, similar reactions may provide hypotheses for drug metabolism and thus can be used for high throughput computational screening and hypothesis generation for drug metabolism in the human gut microbiome. In addition, known enzymes or transformations found in specific gut microbial species36 can be used to screen for similar drug transformations in the vector space. In this way, one can computationally generate hypotheses for drug transformations that may occur via the gut microbiome.
We were able to transform molecules into a computational vector space, characterize and then fine-tune the space to best reflect properties at both the molecular and reaction level. Furthermore, we showed preliminary drug-metabolite queries inside a vector landscape. By detecting similar reaction and drug-metabolite vectors, we showed a first step toward modeling drug metabolism by gut microbes using the vector space. We found evidence of successful reaction vector clustering, as shown by trends of clusters enriched with enzymes with similar functions (Table 1, Supplementary Tables S2–S5). For example, cluster 3 is enriched for a specific type of oxidoreductases and cluster 20 is enriched for glucosyltransferases. Because enzymes can catalyze multiple types of reactions, we performed enrichment analyses using GO terms and EC classes for reactions. The enriched EC classes were consistent with the GO terms. Therefore, despite having one cluster that accounts for close to 40% of the data and some clusters sharing EC class, the smaller clusters have significant enrichment indicating that these methods can be used to differentiate reaction transformations.
Vector addition and subtraction in the vector space can describe transformation properties of drug metabolism. For example, the centroid for a highly enriched reductase cluster could be classified as a ‘reductase vector’. Using such enzyme vectors, we can add compound vectors to find compounds that may undergo the transformation. Additionally, drug metabolism does not occur in a single step, but occurs over a sequence of transformations in order for the drug to become active in the body and eventually be eliminated. Through the use of transformation vectors with additional drug metabolites and similar compounds, we can use this technique to detect the transformation pathway from one compound to another, based on enzyme vectors. This automatic construction of drug-related pathways would aid current manual curation efforts for pathway construction at drug databases like PharmGKB37 and provide an initial automatically constructed pathway for other users that do not require a high quality curated pathway for their work.
Characterizing reaction vectors was a more challenging task compared to the molecule vectors because the reaction vectors reflect the transformation between the two molecules. Observing the silhouette plots for clustering done with the best k for both TVSM and reaction vectors, we noticed that the former is significantly better distributed, with clusters around the same size. The reaction vector silhouette plot had one large cluster (cluster 12) that dominated the clustering and captured many different types of reactions. The reaction vector clusters we found within cluster 12 are closer to each other than the original reaction clusters.
In addition to the challenge of classifying reaction vectors effectively, limited data provided another obstacle for clustering. Although the MetaCyc database contains a large curated set of metabolic pathways, it is limited in examples especially critical to the understanding the metabolism of drugs in the human gut. Since this approach is completely data-driven, limited data in the types of transformations necessary for this type of metabolism hinders the model’s ability to learn meaningful representations of molecules and their reactions. Thus, when querying drugs in the space, the resulting reactions may not be the most useful in terms of correlating with drug-metabolite interactions. One solution is to only use bacterial reactions in the drug queries; however, this approach is limited by the data available in MetaCyc. To add additional bacterial reactions to the database, one solution is to incorporate bacterial reactions described in the literature.
While this computational approach is more efficient and time-effective, supplementing the methods outlined here with experimental features would bolster the model. Even though we have shown that structure is a large component in making these predictions, incorporating empirical data would give us even more information to build on. Lastly, we queried from a very small subset of drugs, and for this proof-of-concept to be implementable for predictions, we must add in a larger set of drug-metabolite pairs. This remains challenging because most of the public information about drug metabolites is in text, image, or PDF format.
5. Conclusion
We developed a pipeline for computing similarities between chemical reactions and drugmetabolite transformations catalyzed by bacterial enzymes in the human gut microbiome. We show meaningful clusters for molecules and reactions in the transformed vector space based on chemical similarity, and how this data can be used to understand drug metabolism. Further development of these analytical pipelines and inclusion of larger chemical and reaction datasets pertaining specifically to the microbiome will enable high throughput screening of drugs and their resulting metabolites against chemical reactions common to gut bacteria.
Supplementary Material
Acknowledgments
The authors acknowledge Dr. Michael Fischbach for discussions regarding drug metabolism via the microbiome, and Dr. Larry Callahan, Dr. Frank Switzer, and Ms. Elaine Johanson for insights regarding chemistry and FDA work. This publication was made possible by grant U01FD004979 from the FDA, which supports the UCSF-Stanford Center of Excellence in Regulatory Science. Its contents are solely the responsibility of the authors and do not necessarily represent the official views of the HHS or FDA. EKM is supported by NIH NRSA F31 LM012354. SER is supported by NIH GM102365 and NIH GM61374. PJT is supported by NIH R01HL122593 and the Searle Scholars Program.
References
- 1.Spanogiannopoulos P, et al. Nature reviews. Microbiology. 2016;14:273–287. doi: 10.1038/nrmicro.2016.17. [DOI] [PMC free article] [PubMed] [Google Scholar]
- 2.Saha JR, et al. Science. 1983;220:325–327. doi: 10.1126/science.6836275. [DOI] [PubMed] [Google Scholar]
- 3.Haiser HJ, et al. Gut microbes. 2014;5:233–238. doi: 10.4161/gmic.27915. [DOI] [PMC free article] [PubMed] [Google Scholar]
- 4.Haiser HJ, et al. Science. 2013;341:295–298. doi: 10.1126/science.1235872. [DOI] [PMC free article] [PubMed] [Google Scholar]
- 5.Koppel N, Maini Rekdal V, Balskus EP. Science. 2017;356 doi: 10.1126/science.aag2770. [DOI] [PMC free article] [PubMed] [Google Scholar]
- 6.Lefebvre DE, et al. Nanotoxicology. 2015;9:523–542. doi: 10.3109/17435390.2014.948091. [DOI] [PubMed] [Google Scholar]
- 7.Wallace BD, Redinbo MR. Current opinion in chemical biology. 2013;17:379–384. doi: 10.1016/j.cbpa.2013.04.011. [DOI] [PMC free article] [PubMed] [Google Scholar]
- 8.Cherkasov A, et al. Journal of medicinal chemistry. 2014;57:4977–5010. doi: 10.1021/jm4004285. [DOI] [PMC free article] [PubMed] [Google Scholar]
- 9.Sheridan RP, Hunt P, Culberson JC. J Chem Inf Model. 2006;46:180–192. doi: 10.1021/ci0503208. [DOI] [PubMed] [Google Scholar]
- 10.Dossetter AG, Griffen EJ, Leach AG. Drug Discov Today. 2013;18:724–731. doi: 10.1016/j.drudis.2013.03.003. [DOI] [PubMed] [Google Scholar]
- 11.Tyrchan C, Evertsson E. Computational and structural biotechnology journal. 2017;15:86–90. doi: 10.1016/j.csbj.2016.12.003. [DOI] [PMC free article] [PubMed] [Google Scholar]
- 12.Hussain J, Rea C. J Chem Inf Model. 2010;50:339–348. doi: 10.1021/ci900450m. [DOI] [PubMed] [Google Scholar]
- 13.Griffen E, et al. Journal of medicinal chemistry. 2011;54:7739–7750. doi: 10.1021/jm200452d. [DOI] [PubMed] [Google Scholar]
- 14.Papadatos G, et al. J Chem Inf Model. 2010;50:1872–1886. doi: 10.1021/ci100258p. [DOI] [PubMed] [Google Scholar]
- 15.Rensi S, Altman RB. Computational and structural biotechnology journal. 2017;15:320–327. doi: 10.1016/j.csbj.2017.03.003. [DOI] [PMC free article] [PubMed] [Google Scholar]
- 16.Kraut H, et al. J Chem Inf Model. 2013;53:2884–2895. doi: 10.1021/ci400442f. [DOI] [PubMed] [Google Scholar]
- 17.Hu QN, et al. PloS one. 2012;7:e52901. doi: 10.1371/journal.pone.0052901. [DOI] [PMC free article] [PubMed] [Google Scholar]
- 18.Schneider N, et al. J Chem Inf Model. 2015;55:39–53. doi: 10.1021/ci5006614. [DOI] [PubMed] [Google Scholar]
- 19.Rahman SA, et al. Nature methods. 2014;11:171–174. doi: 10.1038/nmeth.2803. [DOI] [PMC free article] [PubMed] [Google Scholar]
- 20.Hu QN, et al. Bioinformatics. 2011;27:2465–2467. doi: 10.1093/bioinformatics/btr413. [DOI] [PubMed] [Google Scholar]
- 21.Giri V, et al. Bioinformatics. 2015;31:3712–3714. doi: 10.1093/bioinformatics/btv416. [DOI] [PubMed] [Google Scholar]
- 22.Caspi R, et al. Nucleic acids research. 2016;44:D471–480. doi: 10.1093/nar/gkv1164. [DOI] [PMC free article] [PubMed] [Google Scholar]
- 23.Anderson E, Veith GD, Weininger D. Environmental Research Laboratory-Duluth. Report No. EPA/600/M-87/021. 1987 [Google Scholar]
- 24.Bernhard S, et al. Neural Computation. 1998;10:1299–1319. [Google Scholar]
- 25.Durant JL, et al. J Chem Inf Comput Sci. 2002;42:1273–1280. doi: 10.1021/ci010132r. [DOI] [PubMed] [Google Scholar]
- 26.Landrum G. 2016 http://www.rdkit.org.
- 27.Bajusz D, Rácz A, Héberger K. Journal of Cheminformatics. 2015;7:20. doi: 10.1186/s13321-015-0069-3. [DOI] [PMC free article] [PubMed] [Google Scholar]
- 28.Tibshirani R, Walther G, Hastie T. Journal of the Royal Statistical Society: Series B (Statistical Methodology) 2001;63:411–423. [Google Scholar]
- 29.Sang K. 2016 https://github.com/minddrummer/gap.
- 30.Pedregosa F, et al. Journal of Machine Learning Research. 2011;12:2825–2830. [Google Scholar]
- 31.Hastings J, et al. Nucleic acids research. 2013;41:D456–463. doi: 10.1093/nar/gks1146. [DOI] [PMC free article] [PubMed] [Google Scholar]
- 32.Gene Ontology Consortium. Nucleic acids research. 2015;43:D1049–D1056. doi: 10.1093/nar/gku1179. [DOI] [PMC free article] [PubMed] [Google Scholar]
- 33.Sousa T, et al. International journal of pharmaceutics. 2008;363:1–25. doi: 10.1016/j.ijpharm.2008.07.009. [DOI] [PubMed] [Google Scholar]
- 34.Saad R, Rizkallah MR, Aziz RK. Gut pathogens. 2012;4:16. doi: 10.1186/1757-4749-4-16. [DOI] [PMC free article] [PubMed] [Google Scholar]
- 35.Levin BJ, et al. Science. 2017;355 doi: 10.1126/science.aai8386. [DOI] [PMC free article] [PubMed] [Google Scholar]
- 36.Heinken A, et al. Gut microbes. 2013;4:28–40. doi: 10.4161/gmic.22370. [DOI] [PMC free article] [PubMed] [Google Scholar]
- 37.Whirl-Carrillo M, et al. Clinical pharmacology and therapeutics. 2012;92:414–417. doi: 10.1038/clpt.2012.96. [DOI] [PMC free article] [PubMed] [Google Scholar]
Associated Data
This section collects any data citations, data availability statements, or supplementary materials included in this article.


