

Fibroblasts transition into myofibroblasts in a highly tensed growth front and revert back to fibroblasts as the tissue matures.
Abstract
Myofibroblasts orchestrate wound healing processes, and if they remain activated, they drive disease progression such as fibrosis and cancer. Besides growth factor signaling, the local extracellular matrix (ECM) and its mechanical properties are central regulators of these processes. It remains unknown whether transforming growth factor–β (TGF-β) and tensile forces work synergistically in up-regulating the transition of fibroblasts into myofibroblasts and whether myofibroblasts undergo apoptosis or become deactivated by other means once tissue homeostasis is reached. We used three-dimensional microtissues grown in vitro from fibroblasts in macroscopically engineered clefts for several weeks and found that fibroblasts transitioned into myofibroblasts at the highly tensed growth front as the microtissue progressively closed the cleft, in analogy to closing a wound site. Proliferation was up-regulated at the growth front, and new highly stretched fibronectin fibers were deposited, as revealed by fibronectin fluorescence resonance energy transfer probes. As the tissue was growing, the ECM underneath matured into a collagen-rich tissue containing mostly fibroblasts instead of myofibroblasts, and the fibronectin fibers were under reduced tension. This correlated with a progressive rounding of cells from the growth front inward, with decreased α–smooth muscle actin expression, YAP nuclear translocation, and cell proliferation. Together, this suggests that the myofibroblast phenotype is stabilized at the growth front by tensile forces, even in the absence of endogenously supplemented TGF-β, and reverts into a quiescent fibroblast phenotype already 10 μm behind the growth front, thus giving rise to a myofibroblast-to-fibroblast transition. This is the hallmark of reaching prohealing homeostasis.
INTRODUCTION
Throughout our lifetime, most of our tissues remodel and regrow to adapt to changing requirements and to regenerate from damage or disease. In wound repair, myofibroblasts are responsible for wound closure. Their transition from tissue-resident fibroblasts or other mesenchymal precursors (1) is promoted by soluble factors such as transforming growth factor–β1 (TGF-β1) and by mechanical cues (2–6). The fibroblast-to-myofibroblast transition is described as a multifactorial process that involves enhanced force generation with enlarged focal adhesions and incorporation of α–smooth muscle actin (α-SMA) into stress fibers (7, 8). Furthermore, increased contraction of extracellular matrix (ECM) fibers can uncage TGF-β from its latent complex and release it into the medium (9). However, little is known, at the organ level, about the fate of myofibroblasts after successful wound closure—whether they undergo apoptosis, become senescent, or revert to a fibroblast phenotype. Although washing away or blocking the action of TGF-β1 in myofibroblast two-dimensional (2D) cell cultures is sufficient to revert the phenotype in vitro, until recently, the reversibility of the myofibroblast phenotype has not been demonstrated in animals [for review, see Van De Water et al. (6)], with one exception in a rat liver fibrosis model (10). Pathological and persistent myofibroblast activation can lead to hypertrophic scars or tissue fibrosis, ultimately resulting in a loss of organ function (3, 6, 8, 11–13). Successful treatment of these pathologies, as well as proper healing and remodeling after injury or implantation, requires that tissue homeostasis be reestablished. This major clinical challenge can only be addressed by a better understanding of how biochemical and physical cues instruct fibroblasts to proliferate and become myofibroblasts, contract the wound site, and deposit new ECM. Moreover, the repaired tissue must return to a quiescent, homeostatic state to prevent fibrotic states.
In a wound site, many factors interplay, such as cell-generated forces to contract a wound, the rigidity and composition of the ECM of the injured tissue that is interwoven with the fibrin gel from the blood clot, and soluble factors released by blood cells entrapped in the blood clot and by invading cells, including fibroblasts and macrophages. Disentangling this mechanically driven growth factor–cell-matrix reciprocity to understand how forces and ECM properties drive myofibroblast differentiation and vice versa is difficult in a real wound model because too many factors contribute, and in 2D cell culture models due to their inherent limitations. The native ECM deposited by cells on flat culture substrates is limited to a thickness of 20 to 30 μm and remains randomly organized under static conditions (14), whereas 3D fibrous scaffolds, such as collagen gels or matrigels, have a much higher fiber density than native tissue and lack much of the biochemical complexity and remodeling dynamics of native tissue ECM. Although most drugs are still screened and tested in 2D cell culture, it is well established that the drug dose response (15) and radioresponse (16) depend on the 3D microenvironment that the cells experience. Moreover, the long-term effects of tissue maturation on myofibroblast differentiation (17) are poorly understood, because existing in vitro approaches are often limited to a few hours or days.
Here, we studied the progressively changing relationship between cellular forces, tissue maturation, and myofibroblast differentiation over several weeks in an in vitro 3D microtissue model (18) that addresses several of these limitations. In this assay, de novo tissue was grown from fibroblasts, and the cells assembled their own ECM as they were gradually closing millimeter-sized concave scaffold clefts. New tissue emerged at the growth front (19), whereas increasing tissue depth corresponds to increasing tissue maturity as transient cellular forces are gradually converted into a permanent tissue prestress (19). To address the challenge outlined above, we advanced the previous assay (19) and grew normal human dermal fibroblast (NHDF) microtissues in the corners of polydimethylsiloxane (PDMS) scaffolds with rectangular holes. We developed automated image analysis tools to quantify fibronectin (FN) fiber stretch, proliferation, and myofibroblast differentiation as a function of tissue age. With this approach, we aim to improve our understanding of how tissue maturation and tension-guided cell matrix reciprocity orchestrate the fibroblast-to-myofibroblast transition and myofibroblast activation, as well as the transition back to a homeostatic, quiescent state. Our ultimate aim is to apply the insights derived from these control principles to develop novel approaches to promote healing and remodeling in the context of regenerative therapies.
RESULTS
Primary human dermal fibroblasts grow de novo microtissues progressively closing engineered clefts
Microfabricated PDMS scaffolds with macroscopic square-shaped clefts were attached to the bottom of passivated cell culture wells using spacers (Fig. 1A and fig. S5). After seeding, fibroblasts adhered to the FN–cross-linked scaffold surfaces, but not to the well bottom, and started to proliferate until a dense monolayer had formed on all sides, including on the vertical cleft walls. After typically 3 to 4 days, the corners of the rectangular clefts started to fill with a thick 3D tissue (Fig. 1B). During the subsequent 2 to 3 weeks of culture, the tissues grew larger until they merged, and only a round opening remained in the center of the square-shaped scaffold clefts. This is in agreement with earlier tissue growth studies performed in macroscopic scaffolds with mouse preosteoblasts (18) and human mesenchymal stromal cells (20). To characterize the architecture of the de novo formed microtissues, we fixed the tissues after 3 weeks in culture and stained them for actin, collagen-I (Col-I), and nuclei. We found that both FN and Col-I were present throughout the tissue, consistent with previous observations in osteoblasts (Fig. 1E). Actin, FN, and Col-I were all highly polarized and aligned at the tissue-medium interface but appeared less organized in the bulk of the more mature tissue.
Fig. 1. De novo microtissue growth rate increased with cytoskeletal tension.
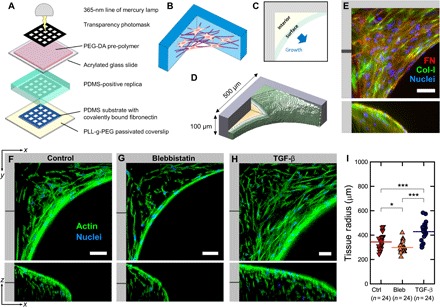
(A) Schematic of the microfabrication process used to produce thick 3D PDMS substrates with controlled macroscopic geometry. Detailed illustrations of the fabrication process are shown in fig. S5. (B) Illustration of 3D tissue growing in the corners of rectangular substrate pores. (C and D) Illustration of surface and interior regions and tissue dimensions. (E) Maximum intensity projection of the resulting 3D tissue containing cells (blue) and ECM (red, FN; green, Col-I; blue, nuclei). The tissue is rich in both FN and Col-I fibers. (F to H) Single slices through tissues (green, actin; blue, nuclei) at the indicated depth in xy and xz directions, under normal conditions (left) and under conditions of inhibited (middle) and elevated (right) cytoskeletal tension in the presence of 10 μM blebbistatin or TGF-β1 (1 ng/ml), respectively. The individual channels and an animated z fly-through are shown in fig. S1 and movie S1, respectively. (I) Quantification of tissue radius (distance between the scaffold corner and the growth front at 40 μm of z depth) after 19 days of growth under normal conditions and in the presence of 10 μM blebbistatin or TGF-β1 (1 ng/ml), respectively. Increased cytoskeletal tension results in increased tissue volume. Scale bars, 50 μm. Data points indicate the tissue radius for individual tissues.
Cytoskeletal tension up-regulates the volumetric growth rate of the tissue
To investigate the role of cellular traction forces in the de novo tissue growth, we down- or up-regulated the cytoskeletal contractility through the supplementation of the medium by blebbistatin (10 μM) or TGF-β1 (1 ng/ml), respectively (Fig. 1I). Under control conditions, tissue radius (see Materials and Methods) was 344 ± 13 μm, whereas under conditions of increased and reduced cytoskeletal tension, tissue radius increased to 428 ± 16 μm and decreased to 298 ± 9 μm, respectively (Fig. 1, F to I, and movie S1). This shows that the volume of the tissue formed by NHDFs in rectangular scaffold pores as measured by the radius depends on cytoskeletal tension.
The tissue-medium interface is high in proliferating cells and defines the growth front
To ask whether tissue volume increases mainly by cell proliferation in the growth front, or within the entire tissue, we supplemented the medium at day 18 with EdU (5-ethynyl-2′–deoxyuridine), which incorporates only into newly synthesized DNA (Fig. 2). Although EdU-positive nuclei appear throughout the tissue, the density of EdU-positive cells is highest in the growth front (Fig. 2, A to C, fig. S2, and movie S2). This could result either from a higher proliferation rate or from a higher overall cell density in the growth front. Therefore, we performed a quantitative analysis of proliferation by determining the ratio of EdU-positive to the total number of cells as a function of tissue depth and hence tissue age. Our results show that relative EdU intensity, and hence cell proliferation, decreased with tissue depth (Fig. 2E). EdU incorporation was always higher at the growth front compared to the interior, with no significant differences between conditions, that is, control or treatment with blebbistatin or TGF-β1 (Fig. 2F). The higher EdU incorporation at the growth front correlated with a flatter and more polarized appearance of the cell nuclei compared to a more isotropic nuclear shape in the tissue interior, which is known to mediate the cellular response to physical cues (21, 22). Although there was no significant difference in proliferation between conditions of different cell contractility, cell density was significantly increased in TGF-β1–treated samples (Fig. 2, G and H), suggesting that the overall proliferation during the entire growth period was higher.
Fig. 2. Spatial mapping of EdU incorporation reveals that cells preferentially proliferate in the surface growth front.
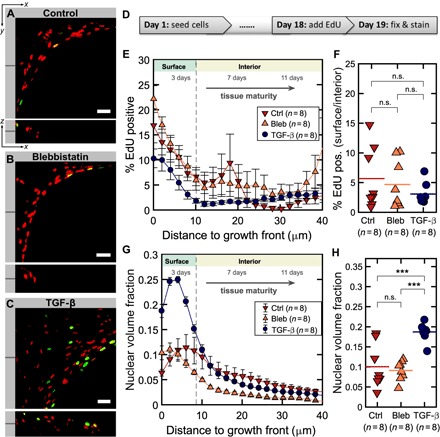
(A to C) Single slices through tissues at the indicated z depth showing EdU signals from proliferating nuclei (green) and Hoechst counterstain of all nuclei (red) for all three conditions in xy and xz directions. Scale bars, 50 μm. The individual channels and an animated z fly-through are shown in fig. S2 and movie S2, respectively. (D) Time course of proliferation experiments. Tissues were cultured for 19 days under normal conditions and in the presence of 10 μM blebbistatin or TGF-β1 (1 ng/ml), respectively. (E) Percentage of EdU-positive volume compared to total nuclear volume as a function of tissue depth and age. (F) Ratio of EdU-positive cells in growth front compared to interior. (G) Nuclear volume fraction as a measure for cell density as a function of tissue depth and age. (H) Mean nuclear volume fraction for all three conditions. Error bars indicate SEM. Data points in (F) and (H) indicate ratios and fractions for individual tissues.
Newly deposited FN fibers are more stretched at the growth front compared to FN fibers in the tissue interior
Because FN fiber tension was shown in 2D cell culture to be up-regulated with cytoskeletal tension (23, 24), we added fluorescence resonance energy transfer (FRET)–labeled FN (5 μg/ml) together with a ninefold excess of unlabeled FN to the medium of growing tissues to prevent intermolecular FRET, and allowed cells to incorporate the FN-FRET probe into their ECM for the last 24 hours of growth. Thus, we only visualize the FN fibers that got assembled in the last 24 hours (14). To be sensitive to a large range of conformational changes, we labeled dimeric human plasma FN with acceptors on the native cysteins in modules FNIII7 and FNIII15, respectively, and randomly with donors as previously described (23–25). The batch exploited here had a donor-to-acceptor ratio of 2.5. After this incubation period, tissues were fixed, and 3D image stacks of the FN matrix in the tissues were recorded by exciting the donor fluorophores and recording the emission from the donor and the acceptor fluorophores separately (Fig. 3A). As the efficiency of FRET decreases with increasing distance between donors and acceptors, a low intensity ratio between acceptor and donor means that FN fibers are on average more stretched compared to a high intensity ratio (26). We found that the FRET intensity ratio between acceptors and donors declined as FN fibers got progressively more stretched (Fig. 3, B to E, and movie S3) in response to increased cytoskeletal tension, in agreement with previous observations (23, 24, 26).
Fig. 3. FN fiber tension is highest in the growth front and decays as the tissue matures.
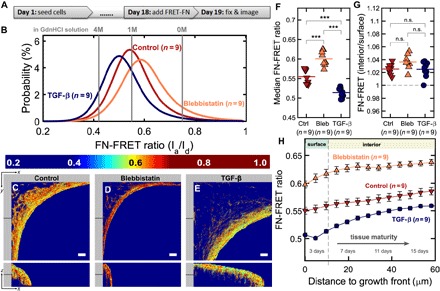
(A) Time course showing the late supplementation of the medium by the FN-FRET probes. (B) Histograms of FN-FRET ratios of FN fibers within the ECM for three different medium supplementations. The FN-FRET probe was added to the medium 24 hours before fixing the cells. The FN-FRET ratios in solution for the same batch are also given in different concentrations of the denaturant GdnHCl (gray lines). (C to E) Single slices through tissues at the indicated z depth showing the FN-FRET ratio for all three conditions. Scale bars, 50 μm. Notice how overall tissue volume depends on up-regulation (TGF-β1, 1 ng/ml) or down-regulation (10 μM blebbistatin) of cell contractility. An animated z fly-through is shown in movie S3. (F) Median FRET ratio is significantly different between all three conditions. (G) Median FN-FRET ratio was always higher in the interior compared to the growth front, with no significant differences between the three conditions. (H) FN-FRET ratio as a function of distance to the growth front or, equivalently, tissue maturity, for all three conditions. Tissues were cultured for 19 days. Error bars indicate SEM. Data points in (F) and (G) indicate median values and ratios for individual tissues.
To quantify differences in FN fiber tension between the tissue growth front and interior, and hence as a function of tissue age, we calculated the 3D Euclidean distance map of the tissue volume from the growth front. As a result, each voxel in the tissue gets assigned its Euclidean distance to the tissue surface. We found that FN-FRET gradually increased with the distance from the growth front, suggesting a decrease of FN fiber stretch with tissue age (Fig. 3, F to H). Because this method only detects FN fibers assembled during the last 24 hours of exposure to FN-FRET, the results show that cells in the growth front assemble a more stretched FN fiber network compared to cells in the more mature interior (Fig. 3G). Regions of high FN fiber stretch coincide with regions where F-actin, FN, and Col-I ECM appear highly aligned with the growth front, as described above.
Cytoskeletal tension regulates FN fiber tension in the ECM at the growth front
We next determined whether the molecular stretch in the newly deposited FN fibrils in the growth front is sensitive to cytoskeletal tension and how this might correlate with the tissue growth rate. When blebbistatin was present at low concentrations (10 μM) during the entire growth period to allow for cell proliferation while reducing cytoskeletal tension, the FN fibrils at the growth front were on average less extended compared to control conditions (Fig. 3F). In contrast and when cytoskeletal tension was increased by supplementing the medium with TGF-β at a concentration of 1 ng/ml during the entire growth period, FN fibrils were more stretched compared to the control. In all cases, FN was significantly more extended close to the growth front compared to the tissue interior.
α-SMA is expressed mostly at the growth front, even without TGF-β supplementation
Because α-SMA expression is characteristic for the more contractile myofibroblasts, but not fibroblasts, the microtissues were grown without TGF-β supplementation and stained for α-SMA (red) after fixation and counterstained for actin with phalloidin (green). Significantly, the growth front is enriched in α-SMA, whereas only a small number of α-SMA–positive cells were found to reside in the tissue interior (Fig. 4, A to C, fig. S4, and movie S4). Quantification of the normalized α-SMA signal density as a function of the distance to the growth front reveals a steep decline of α-SMA–expressing cells over the very first 10 μm behind the growth front.
Fig. 4. α-SMA intensity and YAP nuclear localization were highest in the growth front.
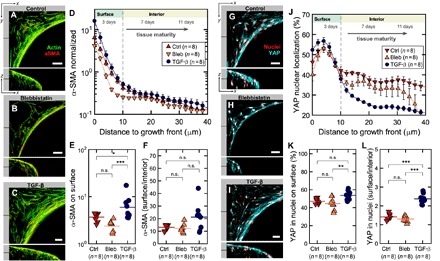
(A to C) Single slices through tissues at the indicated locations for all three conditions. F-actin is shown in green, and α-SMA fibers are shown in red. Individual channels are shown in fig. S3, and an animated z fly-through in movie S4. (D) Ratio of α-SMA signal density in fibers and in background as a function of tissue depth and age shows preferential α-SMA expression on the outermost layer within 10 μm from the tissue growth front. Addition of TGF-β1 (1 ng/ml) results in an increase of α-SMA signal, whereas blebbistatin (10 μM) reduces it. (E) Average α-SMA expression on surface and (F) ratio of α-SMA expression between growth front and interior. (G to I) Single slices through tissues at the indicated locations showing YAP signal (cyan) overlaid with nuclei (red) for all three conditions. Individual channels are shown in fig. S4, and an animated z fly-through is shown in movie S5. (J) Ratio of YAP signal in nuclei over total YAP signal shows a decrease from up to 60% nuclear localization on the tissue surface to nearly 25% deeper in the tissue. Addition of TGF-β results in a larger difference (gradient) in nuclear localization between tissue growth front and interior. (K) YAP nuclear localization in the growth front and (L) ratio of YAP nuclear localization between growth front and interior. Tissues were cultured for 19 days. Error bars indicate SEM. Data points in (E) and (F), and (K) and (L) indicate ratios and percentages for individual tissues. Scale bars, 50 μm.
TGF-β1 or blebbistatin supplementations tune α-SMA expression levels but do not affect the overall phenomenon
Because the expression of α-SMA was associated with TGF-β–induced myofibroblast differentiation (8), we next determined whether the observation that α-SMA is mostly expressed within the first 10 μm of the growth front depends on TGF-β stimulation by adding exogenous TGF-β1 or blebbistatin to increase and inhibit cytoskeletal tension and the associated pathways, respectively. The expression of α-SMA at the growth front was significantly increased under the presence of TGF-β1 (1 ng/ml), whereas the presence of 10 μM blebbistatin had a slight but not statistically significant decreasing effect on α-SMA expression (Fig. 4, D to F). In all cases, the level of α-SMA was still significantly higher at the growth front compared to the tissue interior. The fact that the presence of supplemented TGF-β1 cannot convert the resident fibroblasts in the tissue interior into a myofibroblast phenotype suggests that the stimulation of these microtissues by exogenous TGF-β1 cannot override the stimulation imposed by the reduced tensile forces compared to the growth front, as well as by the ECM microenvironment.
YAP nuclear localization is highest at the growth front
Because the nuclear translocation of YAP is up-regulated in response to mechanical signals and promotes cell proliferation (27, 28), we next investigated the translocation of the transcription factor YAP/TAZ from cytoplasm to nucleus as a function of the cell distance to the growth front. For the 3D distance analysis from the growth front, we used 4′,6-diamidino-2-phenylindole (DAPI)–stained nuclei as masks to distinguish the nuclear and cytoplasmic signals (Fig. 4, G to I, and movie S5). We found that the percentage of nuclear YAP signal intensity decreased from nearly 55% at the growth front down to about 35% within the tissue interior, indicating a significantly larger degree of nuclear localization and therefore activity of YAP at the growth front (Fig. 4, J to L). Upon TGF-β1 supplementation (1 ng/ml), the YAP nuclear localization again declined rapidly within the first 10 μm, and was actually lower in the tissue interior compared to the control and the blebbistatin-treated tissues (10 μM) (Fig. 4, J to L).
DISCUSSION
Although fibroblasts in 2D cell culture can be stimulated with TGF-β1 to transition into myofibroblasts and revert back to the fibroblast phenotype when TGF-β1 is washed away or by blocking the action of TGF-β1, the reversibility of the myofibroblast phenotype has not been demonstrated in animals until recently [for review, see Van De Water et al. (6)], with one exception in a rat liver fibrosis model (10). Even without TGF-β1 supplementation, we found a high density of myofibroblasts in the highly tensed growth front of microtissues that were grown in engineered clefts, whereas the tissue interior that filled the corners contained mostly quiescent fibroblasts (Figs. 3 and 4). Furthermore, cell proliferation (Fig. 2), expression of contractile α-SMA fibers (Fig. 4, A to F), and nuclear localization of YAP (Fig. 4, G to L) were all significantly up-regulated along the growth front compared to the interior. FN-FRET probes revealed that the newly deposited FN fibers were significantly more stretched along the growth front compared to the tissue interior that gradually filled up the corners and were aligned parallel to the actin cable (Fig. 3). In Fig. 5, these differences in cell phenotype and matrix stretch that define “tissue maturation” are graphically summarized. Supplementation of TGF-β1 to the medium only enhanced the phenomena seen without TGF-β supplementation but did not change it fundamentally: TGF-β1 supplementation increased the tissue growth rate (Fig. 1), promoted higher stretch of FN fibrils in the growth front and in the interior (Fig. 3), increased α-SMA expression along the growth front and its thickness (Fig. 4), and reduced nuclear localization of YAP in the tissue interior (Fig. 4). In contrast, inhibition of myosin-II with blebbistatin resulted in lower tissue volume (Fig. 1) and lower FN fiber extension in ECM (Fig. 3) and had little effect on YAP nuclear translocation compared to the control (Fig. 4).
Fig. 5. The myofibroblast-to-fibroblast transition illustrating how the highly tensed growth front rich in myofibroblasts drives tissue growth and how myofibroblasts revert to quiescent fibroblasts as the tissue matures.
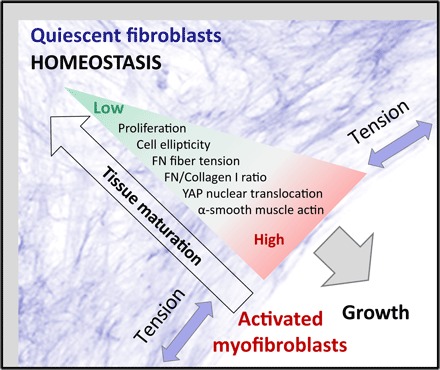
As the tissue grows tensed by cell contractility, and new cells and ECM are added at the growth front in a layer-by-layer process, a gradient emerges from the growth surface toward the tissue interior. The arrow of tissue maturation denotes the emerging gradients in tissue properties over space and time from the surface to the core. In the growth front, cells proliferate, are well spread and elongated, and deposit and stretch an early, 2D FN-rich ECM, whereas within the tissue interior, cells are more isotropic and embedded into a 3D Col-I–rich ECM. This gradient in ECM properties correlates with a gradient in cell phenotype, from activated myofibroblasts in the growth front toward a quiescent fibroblast phenotype that maintains tissue homeostasis in the interior.
These findings, as summarized in Fig. 5, suggest the following succession of events during tissue growth: First and directly after seeding, fibroblasts migrate and proliferate homogeneously on the scaffold surface until they colonize the entire surface. Within the first 3 days after seeding, a dense and contractile cell monolayer forms on all surfaces of the scaffold with a highly stretched FN-rich ECM that initially does not grow thicker than 20 to 30 μm, as observed on other planar culture substrates before (14). As time progresses (typically after 4 to 5 days), the contractile forces acting on the scaffold walls at an angle result in a lift-off, as observed previously (18, 19, 29), resulting in a bridging of the opposing scaffold walls by a highly contractile cell sheet while gradually filling in the scaffold corners. Tensile force acting on the cells is highest in the growth front, and we propose here that they drive the transition of fibroblasts into myofibroblasts, and thus the fibroblast-to-myofibroblast transition, even in the absence of TGF-β supplementation. Enhancing cell contractility up-regulates the tissue growth rate, as shown here by supplementing the medium with TGF-β1 (Fig. 1), and the same effect can be induced by decreasing the cleft angle (18). This interpretation is in agreement with in vivo data because cytoskeletal tension was reported to up-regulate myosin dynamics during Drosophila embryonic wound repair (4), whereby myosin activity is regulated by RhoA/Rock. Also in agreement with the data, we found previously that FN fiber tension in early ECM is up-regulated in a RhoA-dependent manner (25).
Second, the myofibroblasts at the growth front continue to assemble a highly stretched FN matrix that, as the tissue growth front advances, matures underneath and gets interlaced with Col-I fibers (19). The growth front seems to bear the major load acting on the opposing scaffold walls because the cells in the maturing tissue have a more rounded cell shape. The FN matrix deposited and remodeled by these cells in the tissue interior was less stretched, and cells adopted a quiescent, less proliferative phenotype with low α-SMA expression and cytosolic localization of YAP. The presence of thicker and partially radially oriented collagen fibers in the interior furthermore indicates maturation of the tissue with increasing age (19). Because collagen rather than FN is the major force-bearing component of mature ECM (30), these more rigid collagen cables likely shield the FN fibers from cell-generated tension as the FN and collagen meshworks are interwoven, or because the cells preferentially engage with the collagen integrin receptors. This, together with the more rounded and thus less contractile fibroblasts (Fig. 1), can account for the reduced FN fiber tension seen in the maturing tissue interior.
Previous studies in collagen-based contractile 3D microtissues have shown a direct connection between tissue tension and geometry as defined by the anchor points, evident by cell and collagen fiber alignment (31), but not FN fiber stretch (32), likely due to the presence of thick collagen bundles. Microsurgically induced wounds in these tissues healed within 24 hours, with highly motile cells contracting the tissue and pulling new FN fibers to close the gap (33). Also, this agrees well with our observation of increased mobility and FN fiber assembly at the growth front compared to the interior (movie S6). We performed laser cutting experiments in a previous study (19), inspired by the developmental biology literature (34). Cutting the actin cable-like growth front caused an instantaneous nick, which “healed” within 24 hours. Reducing the active cellular tension by adding blebbistatin before the experiment resulted in a smaller nick angle, indicating the presence of both actively generated and permanently stored mechanical tension at the tissue edge.
Our data show that the activation of fibroblasts into contractile, proliferative myofibroblasts is transient and that myofibroblasts can undergo a myofibroblast-to-fibroblast transition in the presence of TGF-β (Fig. 4). Even without addition of exogenous TGF-β, we observed expression of α-SMA in the growth region (Fig. 4), but not in the interior at later time points. Because all cells were exposed to the same growth medium, it is the cell-generated tissue microenvironment as modulated by cell-generated traction forces that drives the fibroblast-myofibroblast-fibroblast transition. Future research has to reveal whether this transition is driven by tension gradients alone or whether other factors contribute as well. These factors could include switching the exposure of binding sites of integrin, growth factor, or cytokines on FN fibers by releasing fiber tension or an up-regulated presence of collagen fibers and of other ECM components.
Our results suggest that the cells, starting from a homogeneous population of fibroblasts, transition into contractile, proliferative, ECM-synthesizing myofibroblasts in the growth front and revert back into quiescent fibroblasts at later time points in the more mature tissue interior. This is remarkable, because the fate of myofibroblasts after a successful wound closure is still debated (3, 6, 10). Although washing away or blocking the action of TGF-β1 in myofibroblast cultures was sufficient to revert the phenotype in vitro (6), it was only recently shown that not all myofibroblasts undergo apoptosis in vivo but that some revert back to an inactive fibroblast phenotype in liver fibrosis (10, 35). We cannot completely rule out myofibroblast apoptosis in our microtissues as an alternative explanation, yet the absence of apoptotic cells on the growth front and the low proliferation rate in the tissue interior speak against this interpretation.
If the fibroblast-to-myofibroblast transition would be irreversible, then there should be a higher number of myofibroblast-like compared to fibroblast-like cells, because proliferation is much higher at the growth front. This gradient in cell phenotype and ECM already emerges at earlier time points (fig. S6). The only other explanation is migration of nondifferentiated cells from outside the tissue into the interior. However, time lapse recording of the tissue dynamics (movie S6) shows a very dynamic growth surface but a rather static interior. This indicates enhanced FN fiber assembly at the growth front but contradicts the presence of enhanced cell migration in the interior. Moreover, the same FN matrix assembled by the cells in the growth front is found a few days later in the tissue interior (19). Therefore, a transient phenotypic change is the only model that is consistent with our data.
Developing a mechanistic understanding of whether myofibroblasts undergo apoptosis or revert back to a fibroblast phenotype has major implications on how to treat progressive fibrotic diseases where learning how to revert the tissue back to homeostasis is urgently needed (3, 6, 10, 35). Upon tissue damage, myofibroblasts are responsible for wound repair and closure, and excessive fibroproliferation is a common complication after injury (36). Aberrations from normal wound healing, resulting in prolonged inflammation, scarring, and fibrosis, present a major clinical challenge (37). These complications are associated with expression of myofibroblast markers, increased contractility, and disturbed ECM remodeling, which are mediated by TGF-β signaling (3, 5, 9, 38). For a wound to heal properly, the right balance of fibroblast and myofibroblast phenotype must be maintained, but strategies to efficiently control this balance are currently lacking (8). Here, we discovered that the ability of cells to generate contractile forces is the key parameter that controls the transient appearance of a myofibroblast-like phenotype and, promoted by a proper ECM architecture and composition, its reversal back into quiescent fibroblasts. The steepness of the gradients in ECM architecture and composition depends on, and can be controlled by, the macroscopic geometry of a wound or scaffold (19, 33). Although our model system lacks the provisional fibrin matrix that fills the wound space and gets remodeled or resorbed in a physiological scenario, the principles we discovered still apply: Contraction of a wound requires healthy surrounding tissue to balance the contractile force. In addition to using scaffolds as guiding structures for ECM organization during tissue regeneration (39), the dynamic feedback process between cells and matrix acting during the growth process must be taken into account to induce proper healing. The same principles apply during embryogenesis, where geometry-dependent patterns of tensile forces are increasingly recognized as cues for controlling cell fate and tissue structure (40). Our findings thus have significant implications for understanding and controlling biological processes of growth and regeneration in the context of wound healing, tissue engineering, development, and stem cells.
MATERIALS AND METHODS
Substrate fabrication
Master fabrication
Master structures of tissue growth substrates were made using microscope projection lithography (41), summarized in fig. S5. This method allows for fast and easy fabrication of thick master structures at a fraction of the cost of standard photolithography and without the need for clean room equipment. With careful tuning of the exposure parameters, resolutions down to few micrometers can be achieved, which is sufficient for the large-scale features used in this study. We used a variation of the method described by Kim et al. (42). A layer of polyethylene glycol diacrylate (PEG-DA; molecular weight, 700; Sigma-Aldrich) mixed with a photocrosslinker (Irgacure 2959, BASF) at 2% (w/v) was sandwiched between a microscopy glass slide that had been activated with 3-(trimethoxysilyl)propyl methacrylate (Sigma-Aldrich) and a coverglass (#1, 24 mm × 60 mm) passivated using fluorosilane [trichloro(1H,1H,2H,2H-perfluorooctyl)silane, Sigma-Aldrich] in vapor phase. Two standard coverslips (#1, 22 mm × 22 mm) were used as spacers, leading to a feature thickness of about 340 μm. First, a frame was polymerized around the feature area by covering it with a piece of opaque tape and exposing it to the light of an ultraviolet (UV) lamp (365 nm). Subsequently, the tape was removed, and the master was mounted on an inverted fluorescence microscope (Zeiss Axiovert 200m, Zeiss) with the coverslip facing the objective, and a rectangular mask (2 mm × 2 mm) was inserted into the field stop slider of the fluorescence pathway. Using the automated shutter and motorized XY stage of the microscope, a regular array of rectangular features was polymerized by illuminating the master with the DAPI channel of the microscope through a 5× objective (numerical aperture, 0.12) using an exposure time of 500 ms. After exposure, the top coverslip was carefully removed, and the remaining prepolymer was washed off using acetone.
Microfabrication of PDMS scaffolds
To create PDMS replicas, the master with the negative features was first passivated using fluorosilane in vapor phase. A positive stamp was made, passivated, and used as a master for another negative structure in PDMS. This secondary negative master was then passivated and used to print the final scaffold grids. For making the scaffolds, PDMS was mixed in the standard ratio of 10:1 and poured over the negative PDMS master, slightly overfilling the structure to fill all gaps, and degassed at 50 bar for 30 min to remove trapped air bubbles. After precuring for 6 min at 80°C, the excess PDMS was skimmed with a glass slide, and the remaining PDMS was cured for another 2 hours at 80°C. This proved to be the most reliable method to generate open PDMS grids without residual membranes. After removal from the master, the substrates were stored in ethanol.
Functionalization and passivation of the PDMS scaffolds
To prepare the scaffolds for tissue growth experiments (as summarized in fig. S5), they were first cleaned and sterilized in 70% ethanol in an ultrasonic bath for 20 min. Subsequently, FN was covalently attached to the surfaces of the scaffold using a heterobifunctional cross-linker (Sulfo-SANPAH, 1 mg/ml, Thermo Fisher Scientific), as described previously (43). The procedure was carried out for each side separately to ensure homogeneous functionalization. Using optical glue NOA-61 (Norland Optical Adhesive 61, Norland) and small PDMS spacers, the functionalized substrates were then attached to an ibidi-treated glass-bottom dish (μ-Dish, 35 mm, ibidi) that had previously been passivated using PLL (poly-l-lysine)-g-PEG (0.1 mg/ml, SuSoS). This construction restricted cell growth to the scaffold while allowing for imaging through the bottom coverglass. After assembly, the culture system was incubated with medium at 37°C for at least 1 hour before seeding cells to equilibrate the surface and allow air bubbles to escape from the pores.
Microtissue growth experiments
Cell culture
Primary NHDFs (passage numbers 3 to 6, Lonza) were maintained in α–minimum essential medium supplemented with 10% fetal bovine serum and 1% penicillin-streptomycin. For experiments, cells were trypsinized and seeded at a density of 2 × 10⁵ cells per substrate. The medium for experiments was additionally supplemented with ascorbic acid (50 μg/ml) to stimulate collagen assembly, unless indicated otherwise. To down- or up-regulate cell contractility, we supplemented the medium with blebbistatin (10 μM, Sigma-Aldrich) or human recombinant TGF-β1 (1 ng/ml, Invitrogen), respectively. After seeding, medium was exchanged every 2 to 3 days during the entire experiment. All cultured cells in the laboratory were routinely checked for mycoplasma infection.
Fixation and immunofluorescence
After the end of the experiment, the scaffolds were fixed in 3% paraformaldehyde (Thermo Fisher Scientific) for 15 min and permeabilized in 1% Triton X-100 (Sigma-Aldrich) for 20 min. The actin cytoskeleton and cell nuclei were stained with Alexa Fluor 488 phalloidin (1:1000, A12379, Thermo Fisher Scientific) and DAPI (2 μg/ml, D1306, Invitrogen), respectively. Col-I primary antibody (ab90395, Abcam plc) was added to the medium at a dilution of 1:200 30 min before fixation to facilitate ECM staining, as described previously (44), and counterstained with AAlexa Fluor 633 goat anti-mouse secondary antibody (A-21052, Thermo Fisher Scientific) at 1:50. YAP was stained with YAP (63.7) primary mouse monoclonal antibody (sc-101199, Santa Cruz Biotechnology) at 1:200 and counterstained with Alexa Fluor 633 goat anti-mouse secondary antibody (A-21052, Thermo Fisher Scientific) at 1:50. α-SMA was stained with primary mouse anti–α-SMA antibody [0.N.5] (ab18147, Abcam plc) at 1:100 and counterstained with Alexa Fluor 546 goat anti-mouse secondary antibody (A-11030, Thermo Fisher Scientific) at 1:100. After washing with phosphate-buffered saline (PBS), primary and secondary antibodies were applied for 30 min each except for Col-I primary antibody, as mentioned above.
Fabrication of the FN-FRET probe
FN was isolated from human plasma, FRET-labeled, and characterized according to previously published protocols (24). In short, FN-DA was double-labeled with Alexa Fluor 546 C-5 maleimide (A10258, Thermo Fisher Scientific) as acceptor on free cysteines, and with Alexa Fluor 488 succinimidyl ester (A20100, Thermo Fisher Scientific) as donor on lysines, and stored in PBS (0.5 mg/ml) at −80°C. The labeling ratio was determined by UV absorption measurements as 3.9 acceptors and 8.8 donors per molecule, respectively. The FN-FRET probe was calibrated as reported previously (24, 25) by measuring the FRET intensity ratios upon denaturation by different concentrations of GdnHCl in solution. For FN-FRET experiments, FN-DA was mixed with unlabeled FN at a ratio of 1:9 to prevent intermolecular energy transfer and added to the culture medium at the specified time point at a concentration of 50 μg/ml.
Proliferation assay
EdU (Thermo Fisher Scientific) was added to the cell medium of growing tissues at 10 μM at day 18, where it was incorporated into newly synthesized DNA during the G1/S phase of the cell cycle. Cells were fixed after 16 hours, stained for EdU with Alexa Fluor 647 azide (A10277, Thermo Fisher Scientific), and counterstained for chromatin using Hoechst 33342 (H3570, Thermo Fisher Scientific) (Fig. 3A). The number of EdU-positive cells relative to the total number of cells then yielded a readout for the probability of cells to be in the G1/S phase during the incubation period.
Microscopy and image analysis
Confocal microscopy
Tissues were imaged on an Olympus FV1000 confocal laser scanning microscope for FN-FRET using a 10× objective. FRET donor excitation was at 488 nm, and detection windows were at 514 to 526 nm (donor) and 566 to 578 nm (acceptor), with a 50/50 beam splitter dividing the emitted light between the two detectors. All settings (photomultiplier tube voltage, pixel dwell time, and laser power) were kept constant across all FRET experiments. EdU and other stainings were imaged on a Leica TCS SMD confocal laser scanning microscope using a 20× air or a 63× water-immersion objective. Fluorophores were excited with 405-, 488-, 546-, and 633-nm laser lines, with detection windows set according to the emission band of the labels. Confocal stacks for the different channels were acquired in sequential mode to minimize cross-talk between the different acquisition channels. Only scaffold corners where tissue had formed were included in the analysis.
Detection of tissue boundaries and 3D age-distance map
All image and data analyses were carried out using custom-written MATLAB scripts (MATLAB R2016a, MathWorks) on a Xeon E5-2697 v2 machine with 12 cores at 2.7 GHz and 64 GB RAM (random-access memory). Confocal image stacks were converted from vendor-specific formats into MATLAB arrays using the OME Bio-Formats library (45). Tissue orientation was determined automatically from the intensity distribution, and stacks were rotated around the z axis such that the scaffold was always in the top left corner. Constant background was removed by finding the first maximum of the intensity histogram, subtracting this value from all voxels, and setting negative intensities to zero. The original image slices were then downscaled in the xy plane to obtain isotropic 3D resolution. Scaffold boundaries were detected by summing up the downscaled stack in z direction, applying a Gaussian filter (size = 7, σ = 3) to the result, and finding the tissue boundaries on the top and left from the projected intensities, defined as the point were 20% of the maximum intensity is reached. To detect the tissue surface, the normalized cumulative sum of the stack in the z direction was Gaussian-filtered (size = 11, σ = 5), converted to a mask using a fixed threshold of 0.12, and combined with the previously detected scaffold walls. Any remaining holes inside the tissue volume were removed by morphological closing. To obtain the age-distance map, the 3D Euclidean distance map of the tissue mask from the tissue surface was calculated, thus assigning a “tissue depth” with respect to the growth front to each location inside the tissue. This distance map was then divided into bins with a spacing corresponding to the z step size. Finally, the scaffold and tissue masks, as well as the distance map, were rescaled to the original image resolution and saved for later use. Because differences in tissue volume are difficult to assess if the tissue is larger than the field of view, we estimated tissue size by measuring the tissue radius, that is, the distance between the corner of the scaffold and the growth front, at a constant z depth of 40 μm for all image stacks.
Determination of FN-FRET ratios in microtissues
FRET experiments were conducted and analyzed by adapting previously published protocols (24, 32) for our 3D microtissues. In brief, donor and acceptor stacks were corrected for detector dark current, sensitivity, and donor bleed-through into the acceptor channel as previously described (32) before calculating the FRET intensity ratio (IA/ID). In addition, we determined the chromatic aberration–induced offset of both channels in the z direction by incorporating 100-nm TetraSpeck beads (T7279, Thermo Fisher Scientific) into unstained tissues before fixation. After applying a corresponding subpixel shift to the donor stack to align both channels, the “control” FRET ratio for TetraSpeck beads remained constant throughout the tissue volume. This offset correction was only performed for FRET measurements, because the other experiments did not involve pixel-wise intensity ratios and were therefore not sensitive to subpixel offsets. Three-dimensional distance maps of the tissue from the surface and from the wall were determined automatically as described above, and resulting FRET values were correlated to distance and tissue age on a per-voxel basis.
α-SMA expression
To determine the relative amount of α-SMA expression in different locations and between conditions, tissues were fixed and stained against α-SMA and F-actin, and confocal Z stacks of both channels were recorded. Image stacks were background-corrected, and individual slices were low-pass–filtered by convolution with a Gaussian (size = 5, σ = 1) to reduce high-frequency noise. The actin channel was automatically thresholded using Otsu’s algorithm on individual normalized slices. Three-dimensional distance maps of the tissue from the surface and from the wall were determined automatically as described above. The binarized actin image was applied to the α-SMA stack channel as a mask to discriminate signal (colocalized with F-actin fibers) and background. Any α-SMA signal not colocalized with F-actin fibers was treated as background, because α-SMA is expected to localize at actin stress fibers rather than in the cytoplasm. The expression of α-SMA was quantified as the actin-colocalized α-SMA signal density (signal per actin volume) divided by the background α-SMA signal density (signal per background volume) to avoid effects of cell density and actin signal strength. The results were plotted as a function of distance to the surface.
YAP nuclear translocation
To quantify the nuclear localization of YAP, tissues were fixed and stained against YAP using an antibody and against nuclei using DAPI. Image stacks were background-corrected, and individual slices were low-pass–filtered by convolution with a Gaussian (size = 5, σ = 1) to reduce high-frequency noise. To obtain a mask of the nuclei, the DAPI signal was separated from the background by automated thresholding using Otsu’s algorithm on each individual slice. The same thresholding method was applied to the images of YAP-stained tissue to obtain a mask of the cells, because YAP is located both in the nucleus and in the cytoplasm. Three-dimensional distance maps of the tissue from the surface and from the wall were determined automatically as described above. Each voxel in the YAP channel was categorized as nuclear, cytoplasmic, or background depending on whether it matched both masks (nuclei and cells), only the cell mask, or neither of the two. To quantify the nuclear-to-cytoplasmic ratio, the YAP signal densities were divided by each other for each distance bin.
EdU imaging
To map cell proliferation as a function of location and tissue age, EdU was incorporated, and nuclei were stained for proliferating cells (EdU positive) and counterstained using Hoechst (all cells). Confocal image stacks were background-corrected, and individual slices were low-pass–filtered by convolution with a Gaussian (size = 5, σ = 1) to reduce high-frequency noise. To obtain a mask of the nuclei, both channels were individually separated from the background by automated thresholding using Otsu’s algorithm on each individual slice. Three-dimensional distance maps of the tissue from the surface and from the wall were determined automatically as described above, but using slightly larger Gaussian kernels to account for the more localized intensity distribution, because only nuclei were labeled in this case. To quantify the percentage of proliferating cells, the total volume of all EdU-positive nuclei was divided by the total volume of all nuclei for each distance bin.
Statistical analysis
All parameters were tested for differences between the three conditions using one-way analysis of variance (ANOVA) and corrected for multiple testing using Bonferroni correction. For the data in Fig. 2F, nonparametric ANOVA (Kruskal-Wallis) was used. Each reported assay includes data from 8 different tissues (9 in the case of FRET) per condition, as stated in the figure legends, from at least two different independent tissue growth experiments for each condition and assay, amounting to a total of 99 tissues analyzed. In the figures, significance levels for differences between groups are indicated as *P < 0.05, **P < 0.01, and ***P < 0.001. All data analysis was carried out using fully automated scripts to prevent investigator bias.
Supplementary Material
Acknowledgments
Funding: Parts of the research leading to these results have received funding from the European Union Seventh Framework Programme (FP7/2007–2013) under grant agreement no. 327065 (P.K.), a European Research Council (ERC) Advanced Grant (233157) from the ERC (V.V.), the Swiss Science Foundation through project CR32I3-156931 (V.V.), and from ETH Zurich. Author contributions: P.K., C.M.B., J.W.C.D., P.F., and V.V. designed research. P.K., C.M.B., and J.W.C.D. developed experimental methods and data analysis. P.K. conducted experiments and analyzed data. All authors discussed the results. P.K. and V.V. wrote the manuscript. Competing interests: The authors declare that they have no competing interests. Data and materials availability: All data needed to evaluate the conclusions in the paper are present in the paper and/or the Supplementary Materials. Additional data related to this paper may be requested from the authors. All data and the MATLAB code to produce the plots from the data are available for download from the author homepage.
SUPPLEMENTARY MATERIALS
Supplementary material for this article is available at http://advances.sciencemag.org/cgi/content/full/4/1/eaao4881/DC1
fig. S1. Individual channels of images from Fig. 1, F to H.
fig. S2. Individual channels of images from Fig. 2, A to C.
fig. S3. Individual channels of images from Fig. 4, A to C.
fig. S4. Individual channels of images from Fig. 4, G to I.
fig. S5. Illustration of the scaffold fabrication method.
fig. S6. Gradients of cell phenotype and FN stretch after 11 days.
movie S1. Z stack showing actin (green) and nuclei (blue).
movie S2. Z stack showing nuclei (red) and EdU (green).
movie S3. Z stack showing color-coded FN-FRET signals.
movie S4. Z stack showing actin (green) and α-SMA (red).
movie S5. Z stack showing nuclei (red) and YAP (cyan).
movie S6. Time lapse recording of a tissue with fluorescently labeled FN.
REFERENCES AND NOTES
- 1.LeBleu V. S., Taduri G., O’Connell J., Teng Y., Cooke V. G., Woda C., Sugimoto H., Kalluri R., Origin and function of myofibroblasts in kidney fibrosis. Nat. Med. 19, 1047–1053 (2013). [DOI] [PMC free article] [PubMed] [Google Scholar]
- 2.Hinz B., The role of myofibroblasts in wound healing. Curr. Res. Transl. Med. 64, 171–177 (2016). [DOI] [PubMed] [Google Scholar]
- 3.Kis K., Liu X., Hagood J. S., Myofibroblast differentiation and survival in fibrotic disease. Expert Rev. Mol. Med. 13, e27 (2011). [DOI] [PMC free article] [PubMed] [Google Scholar]
- 4.Kobb A. B., Zulueta-Coarasa T., Fernandez-Gonzalez R., Tension regulates myosin dynamics during Drosophila embryonic wound repair. J. Cell Sci. 130, 689–696 (2017). [DOI] [PubMed] [Google Scholar]
- 5.O’Connor J. W., Gomez E. W., Biomechanics of TGFβ-induced epithelial-mesenchymal transition: Implications for fibrosis and cancer. Clin. Transl. Med. 3, 23 (2014). [DOI] [PMC free article] [PubMed] [Google Scholar]
- 6.Van De Water L., Varney S., Tomasek J. J., Mechanoregulation of the myofibroblast in wound contraction, scarring, and fibrosis: Opportunities for new therapeutic intervention. Adv. Wound Care (New Rochelle) 2, 122–141 (2013). [DOI] [PMC free article] [PubMed] [Google Scholar]
- 7.Guo F., Carter D. E., Leask A., miR-218 regulates focal adhesion kinase–dependent TGFβ signaling in fibroblasts. Mol. Biol. Cell 25, 1151–1158 (2014). [DOI] [PMC free article] [PubMed] [Google Scholar]
- 8.Hinz B., Phan S. H., Thannickal V. J., Prunotto M., Desmoulière A., Varga J., De Wever O., Mareel M., Gabbiani G., Recent developments in myofibroblast biology: Paradigms for connective tissue remodeling. Am. J. Pathol. 180, 1340–1355 (2012). [DOI] [PMC free article] [PubMed] [Google Scholar]
- 9.Klingberg F., Chow M. L., Koehler A., Boo S., Buscemi L., Quinn T. M., Costell M., Alman B. A., Genot E., Hinz B., Prestress in the extracellular matrix sensitizes latent TGF-β1 for activation. J. Cell Biol. 207, 283–297 (2014). [DOI] [PMC free article] [PubMed] [Google Scholar]
- 10.Kisseleva T., Cong M., Paik Y., Scholten D., Jiang C., Benner C., Iwaisako K., Moore-Morris T., Scott B., Tsukamoto H., Evans S. M., Dillmann W., Glass C. K., Brenner D. A., Myofibroblasts revert to an inactive phenotype during regression of liver fibrosis. Proc. Natl. Acad. Sci. U.S.A. 109, 9448–9453 (2012). [DOI] [PMC free article] [PubMed] [Google Scholar]
- 11.Huang C., Ogawa R., Fibroproliferative disorders and their mechanobiology. Connect. Tissue Res. 53, 187–196 (2012). [DOI] [PubMed] [Google Scholar]
- 12.Kong P., Christia P., Frangogiannis N. G., The pathogenesis of cardiac fibrosis. Cell. Mol. Life Sci. 71, 549–574 (2014). [DOI] [PMC free article] [PubMed] [Google Scholar]
- 13.Nakagawa N., Duffield J. S., Myofibroblasts in fibrotic kidneys. Curr. Pathobiol. Rep. 1, 189–198 (2013). [DOI] [PMC free article] [PubMed] [Google Scholar]
- 14.Kubow K. E., Klotzsch E., Smith M. L., Gourdon D., Little W. C., Vogel V., Crosslinking of cell-derived 3D scaffolds up-regulates the stretching and unfolding of new extracellular matrix assembled by reseeded cells. Integr. Biol. (Camb.) 1, 635–648 (2009). [DOI] [PMC free article] [PubMed] [Google Scholar]
- 15.Ingber D. E., Reverse engineering human pathophysiology with organs-on-chips. Cell 164, 1105–1109 (2016). [DOI] [PubMed] [Google Scholar]
- 16.Nam J.-M., Onodera Y., Bissell M. J., Park C. C., Breast cancer cells in three-dimensional culture display an enhanced radioresponse after coordinate targeting of integrin α5β1 and fibronectin. Cancer Res. 70, 5238–5248 (2010). [DOI] [PMC free article] [PubMed] [Google Scholar]
- 17.Li C. X., Talele N. P., Boo S., Koehler A., Knee-Walden E., Balestrini J. L., Speight P., Kapus A., Hinz B., MicroRNA-21 preserves the fibrotic mechanical memory of mesenchymal stem cells. Nat. Mater. 16, 379−389 (2017). [DOI] [PubMed] [Google Scholar]
- 18.Bidan C. M., Kommareddy K. P., Rumpler M., Kollmannsberger P., Bréchet Y. J. M., Fratzl P., Dunlop J. W. C., How linear tension converts to curvature: Geometric control of bone tissue growth. PLOS ONE 7, e36336 (2012). [DOI] [PMC free article] [PubMed] [Google Scholar]
- 19.Bidan C. M., Kollmannsberger P., Gering V., Ehrig S., Joly P., Petersen A., Vogel V., Fratzl P., Dunlop J. W. C., Gradual conversion of cellular stress patterns into pre-stressed matrix architecture during in vitro tissue growth. J. R. Soc. Interface 13, 20160136 (2016). [DOI] [PMC free article] [PubMed] [Google Scholar]
- 20.Herklotz M., Prewitz M. C., Bidan C. M., Dunlop J. W. C., Fratzl P., Werner C., Availability of extracellular matrix biopolymers and differentiation state of human mesenchymal stem cells determine tissue-like growth in vitro. Biomaterials 60, 121–129 (2015). [DOI] [PubMed] [Google Scholar]
- 21.Cho S., Irianto J., Discher D. E., Mechanosensing by the nucleus: From pathways to scaling relationships. J. Cell Biol. 216, 305–315 (2017). [DOI] [PMC free article] [PubMed] [Google Scholar]
- 22.Dahl K. N., Ribeiro A. J. S., Lammerding J., Nuclear shape, mechanics, and mechanotransduction. Circ. Res. 102, 1307–1318 (2008). [DOI] [PMC free article] [PubMed] [Google Scholar]
- 23.Baneyx G., Baugh L., Vogel V., Coexisting conformations of fibronectin in cell culture imaged using fluorescence resonance energy transfer. Proc. Natl. Acad. Sci. U.S.A. 98, 14464–14468 (2001). [DOI] [PMC free article] [PubMed] [Google Scholar]
- 24.Smith M. L., Gourdon D., Little W. C., Kubow K. E., Eguiluz R. A., Luna-Morris S., Vogel V., Force-induced unfolding of fibronectin in the extracellular matrix of living cells. PLOS Biol. 5, e268 (2007). [DOI] [PMC free article] [PubMed] [Google Scholar]
- 25.Baneyx G., Baugh L., Vogel V., Fibronectin extension and unfolding within cell matrix fibrils controlled by cytoskeletal tension. Proc. Natl. Acad. Sci. U.S.A. 99, 5139–5143 (2002). [DOI] [PMC free article] [PubMed] [Google Scholar]
- 26.Little W. C., Smith M. L., Ebneter U., Vogel V., Assay to mechanically tune and optically probe fibrillar fibronectin conformations from fully relaxed to breakage. Matrix Biol. 27, 451–461 (2008). [DOI] [PMC free article] [PubMed] [Google Scholar]
- 27.Nardone G., Oliver-De La Cruz J., Vrbsky J., Martini C., Pribyl J., Skládal P., Pešl M., Caluori G., Pagliari S., Martino F., Maceckova Z., Hajduch M., Sanz-Garcia A., Pugno N. M., Stokin G. B., Forte G., YAP regulates cell mechanics by controlling focal adhesion assembly. Nat. Commun. 8, 15321 (2017). [DOI] [PMC free article] [PubMed] [Google Scholar]
- 28.Panciera T., Azzolin L., Cordenonsi M., Piccolo S., Mechanobiology of YAP and TAZ in physiology and disease. Nat. Rev. Mol. Cell Biol. 18, 758–770 (2017). [DOI] [PMC free article] [PubMed] [Google Scholar]
- 29.Yamashita T., Kollmannsberger P., Mawatari K., Kitamori T., Vogel V., Cell sheet mechanics: How geometrical constraints induce the detachment of cell sheets from concave surfaces. Acta Biomater. 45, 85–97 (2016). [DOI] [PubMed] [Google Scholar]
- 30.Kubow K. E., Vukmirovic R., Zhe L., Klotzsch E., Smith M. L., Gourdon D., Luna S., Vogel V., Mechanical forces regulate the interactions of fibronectin and collagen I in extracellular matrix. Nat. Commun. 6, 8026 (2015). [DOI] [PMC free article] [PubMed] [Google Scholar]
- 31.Legant W. R., Pathak A., Yang M. T., Deshpande V. S., McMeeking R. M., Chen C. S., Microfabricated tissue gauges to measure and manipulate forces from 3D microtissues. Proc. Natl. Acad. Sci. U.S.A. 106, 10097–10102 (2009). [DOI] [PMC free article] [PubMed] [Google Scholar]
- 32.Legant W. R., Chen C. S., Vogel V., Force-induced fibronectin assembly and matrix remodeling in a 3D microtissue model of tissue morphogenesis. Integr. Biol. (Camb.) 4, 1164–1174 (2012). [DOI] [PMC free article] [PubMed] [Google Scholar]
- 33.Sakar M. S., Eyckmans J., Pieters R., Eberli D., Nelson B. J., Chen C. S., Cellular forces and matrix assembly coordinate fibrous tissue repair. Nat. Commun. 7, 11036 (2016). [DOI] [PMC free article] [PubMed] [Google Scholar]
- 34.Campinho P., Behrndt M., Ranft J., Risler T., Minc N., Heisenberg C.-P., Tension-oriented cell divisions limit anisotropic tissue tension in epithelial spreading during zebrafish epiboly. Nat. Cell Biol. 15, 1405–1414 (2013). [DOI] [PubMed] [Google Scholar]
- 35.Lepreux S., Desmoulière A., Human liver myofibroblasts during development and diseases with a focus on portal (myo)fibroblasts. Front. Physiol. 6, 173 (2015). [DOI] [PMC free article] [PubMed] [Google Scholar]
- 36.Junkin M., Leung S. L., Whitman S., Gregorio C. C., Wong P. K., Cellular self-organization by autocatalytic alignment feedback. J. Cell Sci. 124, 4213–4220 (2011). [DOI] [PMC free article] [PubMed] [Google Scholar]
- 37.Guo S., DiPietro L. A., Factors affecting wound healing. J. Dent. Res. 89, 219–229 (2010). [DOI] [PMC free article] [PubMed] [Google Scholar]
- 38.Biernacka A., Dobaczewski M., Frangogiannis N. G., TGF-β signaling in fibrosis. Growth Factors 29, 196–202 (2011). [DOI] [PMC free article] [PubMed] [Google Scholar]
- 39.Cipitria A., Lange C., Schell H., Wagermaier W., Reichert J. C., Hutmacher D. W., Fratzl P., Duda G. N., Porous scaffold architecture guides tissue formation. J. Bone Miner. Res. 27, 1275–1288 (2012). [DOI] [PubMed] [Google Scholar]
- 40.Chan C. J., Heisenberg C.-P., Hiiragi T., Coordination of morphogenesis and cell-fate specification in development. Curr. Biol. 27, R1024–R1035 (2017). [DOI] [PubMed] [Google Scholar]
- 41.Love J. C., Wolfe D. B., Jacobs H. O., Whitesides G. M., Microscope projection photolithography for rapid prototyping of masters with micron-scale features for use in soft lithography. Langmuir 17, 6005–6012 (2001). [Google Scholar]
- 42.Kim P., Jeong H. E., Khademhosseini A., Suh K. Y., Fabrication of non-biofouling polyethylene glycol micro- and nanochannels by ultraviolet-assisted irreversible sealing. Lab Chip 6, 1432–1437 (2006). [DOI] [PubMed] [Google Scholar]
- 43.Trappmann B., Gautrot J. E., Connelly J. T., Strange D. G. T., Li Y., Oyen M. L., Stuart M. A. C., Boehm H., Li B., Vogel V., Spatz J. P., Watt F. M., Huck W. T. S., Extracellular-matrix tethering regulates stem-cell fate. Nat. Mater. 11, 642–649 (2012). [DOI] [PubMed] [Google Scholar]
- 44.Ihalainen T. O., Aires L., Herzog F. A., Schwartlander R., Moeller J., Vogel V., Differential basal-to-apical accessibility of lamin A/C epitopes in the nuclear lamina regulated by changes in cytoskeletal tension. Nat. Mater. 14, 1252–1261 (2015). [DOI] [PMC free article] [PubMed] [Google Scholar]
- 45.Linkert M., Rueden C. T., Allan C., Burel J.-M., Moore W., Patterson A., Loranger B., Moore J., Neves C., MacDonald D., Tarkowska A., Sticco C., Hill E., Rossner M., Eliceiri K. W., Swedlow J. R.,. Metadata matters: Access to image data in the real world. J. Cell Biol. 189, 777–782 (2010). [DOI] [PMC free article] [PubMed] [Google Scholar]
Associated Data
This section collects any data citations, data availability statements, or supplementary materials included in this article.
Supplementary Materials
Supplementary material for this article is available at http://advances.sciencemag.org/cgi/content/full/4/1/eaao4881/DC1
fig. S1. Individual channels of images from Fig. 1, F to H.
fig. S2. Individual channels of images from Fig. 2, A to C.
fig. S3. Individual channels of images from Fig. 4, A to C.
fig. S4. Individual channels of images from Fig. 4, G to I.
fig. S5. Illustration of the scaffold fabrication method.
fig. S6. Gradients of cell phenotype and FN stretch after 11 days.
movie S1. Z stack showing actin (green) and nuclei (blue).
movie S2. Z stack showing nuclei (red) and EdU (green).
movie S3. Z stack showing color-coded FN-FRET signals.
movie S4. Z stack showing actin (green) and α-SMA (red).
movie S5. Z stack showing nuclei (red) and YAP (cyan).
movie S6. Time lapse recording of a tissue with fluorescently labeled FN.