

Abstract
Two datasets of 110 young adults were examined to investigate the relationship between individual differences in working memory capacity (WMC) and dynamic cognitive control. The results delve into the specific differences between high- and low-WMC individuals’ ability to enact and maintain cognitive control using the AX version of the continuous performance test (AX-CPT). Compared to high-WMC individuals, low-WMC individuals: (a) made more errors, specifically to AX targets; (b) exhibited a partial shift to proactive control with more time-on-task; (c) had more exaggerated slower AX target responses in the tail of the response time distribution; and (d) were equally likely to adjust control after conflict. These results fit with the dual mechanisms of cognitive control theory and goal-maintenance account, and further clarify how individual differences in WMC manifests as intra-individual variability in cognitive control.
Keywords: Cognitive Control, Working Memory Capacity, AX-CPT
Working memory capacity (WMC), defined as the temporary storage, active manipulation, and retrieval of information (Unsworth & Engle, 2008), is of interest due to its many relationships observed with important behaviors in and out of the lab setting. For example, WMC is positively correlated with attention control (Engle & Kane, 2004). Compared to high-WMC individuals, low-WMC individuals are more prone to interference in Stroop tasks (Kane & Engle, 2003; Long & Prat, 2002; Unsworth, Redick, Spillers, & Brewer, 2012), they are less accurate and make slower saccades on anti-saccade tasks (Kane, Bleckley, Conway, & Engle, 2001; Unsworth, Schrock, & Engle, 2004; Unsworth et al., 2012), and they are disproportionately affected by distractors on visual flankers tasks (Heitz & Engle, 2007; Redick & Engle, 2006).
A goal-maintenance account attributes this worse performance to the inability to maintain consistent cognitive control (Engle & Kane, 2004). Engle and Kane posit that low-WMC individuals are simply less able than are high-WMC individuals to maintain goal-relevant information in working memory during task completion, leading to failures in control such as slower response times (RTs) and more errors in situations when control is vital for performance. Importantly, when control is less crucial for performance, high- and low-WMC individuals do not differ in performance. For example, in the more automatic pro-saccade task, in which participants are asked to look to the side of the screen on which a flashing cue appears, control is less necessary for accurate performance and no WMC differences are found (Kane et al., 2001; Unsworth et al., 2004). However, in an anti-saccade task, participants are asked to look away from the flashing cue. Low-WMC individuals are more likely to lose track of this goal, react more slowly, and make more errors by looking toward the cue (Kane et al., 2001; Unsworth et al., 2004). Failure to maintain the task goal would lead to performing whichever response is more automatic, in this case, looking toward (instead of away from) the flashing cue. Note that the consistency with which an individual can maintain task goals and/or attention seems to be critical; individuals low in WMC exhibit more intra-individual variability in RTs on such cognitive control tasks (McVay & Kane, 2009; Redick, Calvo, Gay, & Engle, 2011; Unsworth, Redick, Lakey, & Young, 2010; Unsworth et al, 2012).
Proactive and Reactive Control
Despite implementation of appropriate cognitive control having profound effects on behavior, many cognitive control theories do not specify the temporal dynamics of how cognitive control is used. An exception is the dual mechanisms of control theory (Braver, 2012; Braver, Gray, & Burgess, 2007; Braver, Paxton, Locke, & Barch, 2009), in which there are proactive and reactive cognitive control mechanisms. Proactive control, in which available information is used to inform or prepare for a response before the reaction is needed, can lead to higher accuracy and faster RTs. Alternatively, with reactive control, relevant information is not utilized prior to the time to respond. Instead, once the critical stimulus appears, information must then be retrieved to select the appropriate response, which can lead to slower and less accurate responses. The use of proactive or reactive control is influenced by both internal factors such as age (Paxton, Barch, Storandt, & Braver, 2006), patient status (Edwards, Barch, & Braver, 2010), and WMC (Redick, 2014), and external factors such as incentives (Braver et al., 2009), practice (Paxton et al., 2006), and trial type frequency (Redick, 2014).
In the anti-saccade example, those individuals who are implementing proactive control would keep the goal of ‘look away from the flashing cue’ in mind prior to the onset of the cue. However, those using reactive control would wait until the flashing cue appeared, then recall the ‘look away’ goal, maybe in time and maybe not, to override the prepotent (but incorrect) pro-saccade response and enact the controlled (but correct) anti-saccade response. In relation to Kane et al.’s (2001) anti-saccade work, it could be that high- and low-WMC individuals differ in their use of both proactive and reactive control.
AX-CPT: Previous Research
In the present study, we use the AX version of the continuous performance test (AX-CPT) to examine the differences between high- and low-WMC individuals in the context of dynamic cognitive control. The AX-CPT has been used in many previous studies on proactive and reactive control (for review, see Braver, 2012). The AX-CPT is composed of four trial types, AX, AY, BX, and BY. The first letter in each pair is a cue and the second letter the probe. Of note, despite the name “continuous performance”, the cue-probe pairs are clearly marked. A target keypress is only required for an ‘X’ that follows an ‘A’. All other probes should elicit a non-target keypress. Additionally, all cues should elicit a non-target keypress (Figure 1). Because 70% of trials are target (AX) trials, and only 10% of trials have an ‘A’ cue not followed by an ‘X’ (AY trials), participants would benefit by preparing the specific ‘X’ probe target keypress during the cue-probe interval after an ‘A’ cue is presented. Importantly, proactive control, while more beneficial compared to reactive control for most trials, would actually be detrimental to performance on the 10% of trials that have a non-target probe following an ‘A’ cue (AY trials). The other 20% of trials are split evenly between BX and BY trial types, both of which require a non-target response. Thus, when a ‘B’ cue is presented, participants can prepare a non-target response for the upcoming probe, because a non-target response will be the correct response regardless of the probe letter identity. Using proactive control in the AX-CPT allows for preparation of the specific (target vs. non-target) response. In the Stroop or anti-saccade task, in contrast, only the goal of say the color of the word or look away from where the stimulus appears can be maintained as preparation for a response, but in these tasks the participant does not have enough information to prepare an accurate, specific response such as red or look left. The participant only has enough information to accurately select a response once the stimulus has appeared. The ability to selectively prepare a response during the cue-probe interval in the AX-CPT facilitates the evaluation of the use of proactive and reactive cognitive control.
Figure 1.
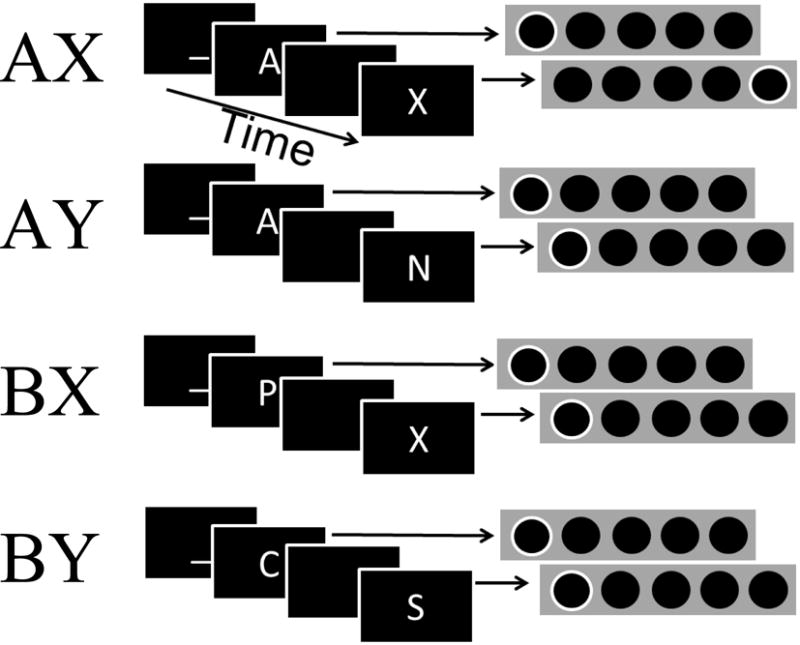
Example trial of each trial type with corresponding serial response box mapping
In the AX-CPT, the typical pattern of results, as it relates to proactive and reactive control, is that proactive control improves performance in particular on BX (and AX) trials. However, proactive control hurts performance on AY trials, given that the prepared target response during the cue-probe interval would need to be stopped and the alternative non-target response executed within the time limit for responding. Although initial AX-CPT research focused on cognitive control in individuals with schizophrenia (e.g., Servan-Schreiber, Cohen, & Steingard, 1996) and elderly adults (e.g., Braver et al., 2001), the role of individual differences in WMC have also been examined in the AX-CPT (Ball, 2015; Boudewyn et al., 2015; Redick, 2014; Redick & Engle, 2011; Richmond, Redick & Braver, 2015; Stawarczyk, Majerus, Catale, & D’Argembeau, 2014). Across the various comparisons (individuals with schizophrenia vs. healthy controls; older vs. young adults; low- vs. high-WMC individuals), AX-CPT results have shown that the ‘intact’ group uses proactive control more frequently than the ‘impaired’ group. Interestingly, meta-analyses have shown that individuals with schizophrenia (Lee & Park, 2005) and elderly adults (Bopp & Verhaeghen, 2005) score lower on WMC measures compared to healthy, young adults, including the complex span tasks used to measure individual differences in WMC in the AX-CPT studies cited above.
Germane to the current work, when examining individual differences in WMC in relation to AX-CPT performance, many authors have calculated a specific signal-detection-theory-derived index of proactive control, d’ (Boudewyn et al., 2015), d’ context (Redick & Engle, 2011; Richmond et al., 2015), or d’ proactive (Ball, 2015; Stawarczyk et al., 2014). The d’ variable is calculated by subtracting the BX non-target false alarm rates from the AX target hit rates. The probe letter X should be associated with a target response (AX trials), but sometimes the probe letter X is correctly responded to with a non-target response (BX trials). Thus, accurate responding to the probe depends upon the cue, in contrast to AY and BY trials (probe letters on AY and BY trials should always be associated with non-target responses). WMC is positively related to d’, indicating greater use of proactive control (Ball, 2015; Boudewyn et al., 2015; Redick & Engle, 2011; Richmond et al., 2015; Stawarczyk et al., 2014). In addition, Redick & Engle (2011) and Richmond et al. (2015) observed that individual differences in WMC were related to mean latency on AX, BX, and BY trial types, such that low-WMC individuals were slower than high-WMC individuals (but see Redick, 2014). However, WMC was either unrelated to AY RTs (Redick & Engle, 2011) or negatively related to AY RTs after controlling for BY RTs (Richmond et al., 2015). Thus, on those trials within the AX-CPT where one could use the cue to prepare the correct probe response (AX, BX, and BY trials), individuals with higher WMC were more likely to respond quicker than individuals lower in WMC.
As discussed thus far, the use of proactive versus reactive cognitive control in WMC research has typically been determined via descriptive statistics summarizing performance across the entire task. That is, cognitive control (or lack thereof) is typically examined via difference scores across the entire experiment (e.g., RTs of incongruent trials minus congruent trials in the Stroop task; AX hit rates versus BX false alarms in the AX-CPT). However, we propose that in addition to global indices of performance, a more fine-grained approach would provide additional information on the way that WMC and manifestations of proactive control are observed. Instead of labeling a particular group as ‘proactive’ or ‘reactive’, based on a global measure or the mean RT of particular trial types, in the current work we explore additional indicators of control. As outlined below, one analysis has been used in other AX-CPT research but not in relation to WMC (proactive shift), while the other two analyses have not been reported in any AX-CPT study (sequential effects and RT distribution analyses). Overall, the current study tells us how between-subject differences in WMC are manifested as intra-individual variability in proactive control, facilitating comparisons with previous clinical and aging research.
Proactive Shift of Cognitive Control
Although previous AX-CPT research has classified low-WMC individuals, older adults, and individuals with schizophrenia as less likely to use proactive control, this does not mean that those groups are incapable of using proactive control, either with more practice/time-on-task, explicit instruction, or incentives/punishments. For example, older adults tend to be initially less proactive than young adults, but changes in the use of cognitive control occur with practice for older adults (Braver et al., 2009; Paxton et al., 2006). In Experiment 2 of Paxton et al. (2006), some elderly participants were given explicit strategy training and others were simply given more time on task. Critically, both older-adult groups showed a shift to proactive control in the latter part of the task (see Edwards et al., 2010, for similar results of strategy training with individuals with schizophrenia). Practice-related proactive shift (Paxton et al., 2006) is the idea that those who initially use reactive control in a task in which proactive control is beneficial may shift to proactive control with practice on the task. Evidence for the practice-related proactive shift can be tested when data are analyzed as a function of time on task (Paxton et al., 2006), specifically looking at performance on the AY and BX trials. Should proactive shift occur, the initially less proactive group (e.g., low-WMC) would be expected to show changes in accuracy with practice. Specifically, accuracy should increase on trial types that are conducive to proactive control (BX) and decrease on trial types that are conducive to reactive control (AY) with time-on-task, as in the older-adult sample in Paxton et al. (2006).
For the proactive shift results, we expect low-WMC individuals to show an increase in AY errors and a decrease in BX errors with time-on-task. That is, with more practice, the low-WMC individuals should begin to use the cue to prepare the expected response during the cue-probe interval. As an X is expected after an A, this would increase errors to stimuli following an A that are not X. Likewise, a B indicates that the following stimulus is a non-target, no matter what it is. Thus, BX errors should decrease with the preparation involved in proactive control. However, because high-WMC individuals are already frequently engaging proactive control, changes would not be expected in AY or BX accuracy with more time on task.
Sequential Effects
In addition to global effects like the proactive shift, which occur over the course of the entire experiment, there are trial-to-trial cognitive control adjustments, referred to as local effects or micro-adjustments, such as sequential effects. Sequential effects are changes that occur in behavior as a function of the previous event. For example, while studying sequential effects of congruent and incongruent trial types on a flanker task, Gratton, Coles, and Donchin (1992) analyzed the sequential effects in terms of conflict on previous trial types and the current trial type. Typically, performance (both in terms of accuracy and RTs) is worse on incongruent trials than on congruent trials. However, Gratton et al. (1992) demonstrated there is also a performance difference based on the sequence of trial types. Individuals were faster and more accurate on trials that are the same type as the previous trial (congruent following congruent or incongruent following incongruent) versus performance on a trial where the trial type is different from the previous trial type (congruent following incongruent or incongruent following congruent).
The observation that conflicting (incongruent) trials are faster and/or more accurate when following other conflict trials is a prominent feature of the conflict-monitoring account of cognitive control (Botvinick, Carter, Braver, Barch, & Cohen, 2001). The conflict-monitoring account posits that as participants experience conflict, they recruit more cognitive control, reducing the adverse effect of interference on the subsequent trial. Others suggest the sequential effects are instead due to priming, and once stimulus or response repetitions are accounted for, the sequential effect disappears (e.g., Mayr, Awh, & Laurey, 2003). However, this has been shown not to be the case in a Stroop task where a sequential effect remained even when controlling for repetitions (Blais, Stefanidi, & Brewer, 2014; Kerns et al., 2004). Although there is debate about the mechanisms underlying sequential effects (Blais et al., 2014; Hommel, Proctor, & Vu, 2004; Schmidt, 2013), in the current work, we interpret them using the conflict-monitoring account and also control for repetitions, ruling out the possibility of the alternate priming explanation.
In regard to individual differences in WMC, it could be that high-WMC individuals are better able to monitor for conflict and make adjustments accordingly, whereas low-WMC individuals may struggle with these local adjustments in control, leading to their lower accuracies and slower RTs. Should that be the case, we would expect to see WMC differences as a function of previous trial type (conflict or non-conflict). Specifically, low-WMC individuals would be slower and less accurate after conflict trials when compared to high-WMC individuals. However, Unsworth et al. (2012) used the Stroop and flanker tasks to examine sequential effects, and no WMC differences in local adjustments were found (see also Hutchison, 2011; Meier & Kane, 2013, 2015). In contrast, Weldon, Mushlin, Kim, and Sohn (2013) used the Simon task and found WMC differences in local adjustments of control. Specifically, in Experiment 1, Weldon et al. found that low-WMC individuals, when compared to high-WMC individuals, showed a greater Simon effect following congruent trials, and a marginally greater reverse Simon effect following incongruent trials. However, also using the Simon task, Gulbinaite, van Rijn, and Cohen (2014) and Gulbinaite and Johnson (2014) did not produce strong evidence for WMC differences in sequential effects. So, the relationship (or lack thereof) between WMC and local adjustments in cognitive control remains somewhat unclear, but if there is a relationship, differences in trials following high-conflict trials would be expected.
Because previous research demonstrated no relationship between sequential effects and individual differences in WMC (Gulbinaite et al., 2014; Hutchison, 2011; Keye, Wilhelm, Oberauer, & Stürmer, 2013; Meier & Kane, 2013, 2015; Unsworth et al., 2012; but see Weldon et al., 2013), we do not expect to see WMC differences when exploring sequential effects in the AX-CPT. Of note, instead of incongruent and congruent trials, the present study looks at AX performance after high-conflict (AY; Carter et al., 1998) and low-conflict (BY) trial types.
Response Time Distributions
In addition to proactive-shift analyses, which look at macro-level performance changes early versus late in the experiment, and sequential effects, which look at micro-level performance changes on a trial-to-trial basis, an analysis of the RT distribution may lead to a better understanding of performance compared to the traditional use of measures of central tendency such as mean RT. It may be that instead of a strict dichotomy, where an individual or group of individuals “is proactive” or “is reactive”, the frequency with which an individual employs one type of control versus the other may vary. Variations in the use of control may be masked in analyses of mean RTs or accuracy, but can be explored through an examination of the entire RT distribution (Gulbinaite & Johnson, 2014). For example, low-WMC individuals may implement proactive control some of the time but struggle to maintain this more beneficial type of control (Hutchison, 2011). Low-WMC individuals may be mind-wandering more often than high-WMC individuals (McVay & Kane, 2009; Unsworth & McMillan, 2014; Stawarczyk et al., 2014), which causes them to fail to maintain the task goal on some trials (Unsworth et al., 2012). When proactive control can be used to prepare a response, responses are quick and accurate. So, low-WMC individuals might be able to match high-WMC individuals in RT when using proactive control, resulting in no differences in their fastest RTs. However, if low-WMC individuals have more trials where they do not use proactive control, the low-WMC group would be slower than the high-WMC group, specifically in the slower end of the RT distribution (Unsworth et al., 2010). In the Stroop, anti-saccade, and flanker tasks, using RT distribution analyses, this pattern has been found (Unsworth et al., 2012) – high- and low-WMC individuals perform equally quickly at the fast tail of the distribution, but low-WMC individuals are slower than high-WMC individuals on the slowest trials.
For the RT distribution analyses of AX targets, in line with Unsworth et al. (2012), we would expect to see high- and low-WMC groups perform equivalently in their fastest trials, but low-WMC individuals would be especially slower than high-WMC individual on the slowest trials. When implementing proactive control, the A cue is used to prepare for the specific keypress corresponding to the appropriate response. Therefore, the RT is only the time necessary to press the key once the probe appears. Conversely, when reactive control is being used, the participant is not preparing during the cue-probe interval. When the X probe appears, the individual then has to recall the cue, process the cue-probe pair, then determine and execute the appropriate motor response. It is still possible to do all of this before the response deadline, but the necessary processing is longer and more variable than simply executing the planned motor program when proactive control is engaged before the probe onset. If low-WMC individuals, compared to high-WMC individuals, have more AX trials where proactive control is not used, they will not only make more errors but also have more slow-tailed correct responses.
Present Study
As stated previously, what makes the present study novel is that we delve deeper into the dynamics of proactive and reactive control by analyzing global and local adjustments (proactive-shift, sequential effects, and RT distributions). It is also of note that the AX-CPT in the current study contains many more trials than seen elsewhere in the literature, which was necessary to have the ability to examine sequential effects, proactive shift, and RT distributions due to the trial type frequencies in the AX-CPT. In the current study, the large number of AX trials allows for analysis of RT distributions to examine the consistency of proactive control as well as sequential effects after high- and low-conflict trial types. These analyses have not previously been reported with the AX-CPT. The larger number of trials also alleviates criticisms of studies using similar analyses with other cognitive control tasks (e.g., Unsworth et al., 2012).
In addition, although the proactive shift has been examined in older adults (Paxton et al., 2006) and individuals with schizophrenia (Edwards et al., 2010), this is the first reported analysis involving individual differences in WMC. Although past research has found individual differences in WMC are related to global AX-CPT performance (Ball, 2015; Boudewyn et al., 2015; Redick, 2014; Redick & Engle, 2011; Richmond et al., 2015; Stawarczyk et al., 2014), the local adjustment measures added in the present study provides information about the role of intra-individual variability in proactive control as a function of WMC.
Method
Participants
Experiment 1 (E1) is a re-analysis of data published by Redick (2014), specifically the participants who were in the AX-CPT-70 condition. Of the 41 participants who completed the AX-CPT-70, one low-WMC participant was excluded for extremely low accuracy (62% overall, 48% AX accuracy), leaving 20 high-WMC and 20 low-WMC individuals. Participants were between the ages of 18 and 30 years, and recruited from the Atlanta, GA area.
Participants in Experiment 2 (E2) were between the ages of 16 and 23 years, and were enrolled in an introductory psychology course at Purdue University. Of the 77 participants who completed the task, 37 were high-WMC individuals and 40 were low-WMC individuals. Three participants were excluded for having extremely low AX-CPT accuracy, and an additional four participants were excluded for performing the AX-CPT incorrectly (e.g., using an incorrect response mapping, making no and/or incorrect responses to cues), resulting in a final sample of 70 participants, with 35 high-WMC and 35 low-WMC individuals. The combined sample, accordingly, consists of 110 individuals, 55 high-WMC and 55 low-WMC. As can be seen in Table 1, although the Purdue sample was slightly younger than the Atlanta sample, the WMC groups’ operation and symmetry span scores were very similar.
Table 1.
Participant Information
| WMC | N | Age (in years) M(SD) |
Gender M/F |
Operation Span M(SD) |
Symmetry Span M(SD) |
|
|---|---|---|---|---|---|---|
| E1 | High | 20 | 23.0 (3.1) | 9/11 | 69.1 (4.3) | 36.0 (3.2) |
| Low | 20 | 23.1 (4.2) | 5/15 | 41.4 (11.3) | 18.4 (6.7) | |
| E2 | High | 35 | 19.3 (1.1) | 28/7 | 70.3 (3.2) | 38.0 (2.9) |
| Low | 35 | 19.5 (1.4) | 10/25 | 42.5 (9.9) | 20.3 (4.9) |
Note. WMC = working memory capacity. The possible range of scores for Operation Span is 0 – 75. The possible range of scores for Symmetry Span is 0 – 42.
Tasks
Operation span
Operation span (Redick et al., 2012; Unsworth, Heitz, Schrock, & Engle, 2005). The operation span task consisted of recalling letters that were presented between math problems on which participants made true/false judgments. Before completing the experimental trials, participants first practiced solving the math problems, and from this practice a mean RT was calculated. This mean RT was later used to set the time limit (the mean plus 2.5 standard deviations) to make a judgment on the math problems in the experimental dual-task trials. In addition, participants were asked to maintain at least 85% accuracy on the math section, and a running tally of this accuracy was provided for them to monitor. After completing practice with recalling letters only, participants practiced with math problems only. Finally, they practiced the combination of recalling letters and math problems. There were 15 experimental trials, each consisting of 3 to 7 letters to be remembered, for a total of 75 items. Letters had to be recalled in serial order to be counted as correct. Any correctly placed letter earned 1 point, consistent with the partial-scoring procedure commonly used for this task.
Symmetry Span
Symmetry Span (Redick et al., 2012; Unsworth, Redick, Heitz, Broadway, & Engle, 2009). The symmetry span task consisted of recalling the locations of red squares in a 4 by 4 grid. These red squares were interleaved with black and white pattern images. Participants made a yes/no judgment for the question “Was the picture symmetrical?” Prior to the experimental trials, participants practiced only recalling square locations and only making symmetry judgments. Then, they practiced both parts together. There were 12 experimental trials, each consisting of 2 to 5 locations to be remembered, for a total of 42 items. The time limit during the symmetry decision and the scoring of square recall was the same as described for operation span.
AX-CPT
In this task, participants were presented with letters, one at a time, marked as cue-probe pairs. There were four trial types: AX, AY, BX, and BY. ‘A’ and ‘X’ are meant literally, and ‘B’ and ‘Y’ refer to a letter other than ‘A’ and a letter other than ‘X’, respectively. Participants were instructed to make the non-target response for all cues. The correct probe response was dependent on the cue-probe pair. If the pair was “AX”, the participant was instructed to make a target response to the probe. If the pair was “AY (not X)”, “B (not A) X”, or “B (not A) Y (not X)”, participants were instructed to make a non-target response to the probe. AX trials occurred 70% of the time and AY, BX, and BY trials each occurred 10% of the time. The frequency and timing of trials was modeled after the task used by Braver et al. (2005). The order of trials was randomized once, then given to all participants in this fixed order for E1. For E2, the program randomized the trials for each participant within the percentage constraints listed above. The cue stimulus was presented for 500 ms before the interstimulus interval of 4500 ms, which was a blank screen. Following the interstimulus interval, the probe stimulus appeared for 500 ms. A beep sounded if no response was made within 1000 ms after the onset of each stimulus (cue or probe). The intertrial interval was 1500 ms, consisting of a blank screen for 1000 ms and then a fixation line in the center of the screen for 500 ms.
Procedure
WMC Screening
During the first session, operation span and symmetry span were used to determine WMC. The cut off values for high- and low-WMC were based on quartiles of normative data from young adults evaluated by Redick et al. (2012). For E1, a subset of the sample (N= 4000) described in Redick et al. (2012) was available for comparison. For E2, the entire normative sample was available and used for comparison. To qualify, participants had to reach a composite score threshold equal to having a highest quartile range score on both tasks or a lowest quartile range on both tasks. Participants who qualified as high- or low-WMC were invited to return for the AX-CPT session on a later date. Students were asked not to sign up for the study (both E1 and E2) unless they were fluent English speakers. Some participants in E1 participated for monetary compensation and others participated for course credit. All participants in E2 were compensated with course credit.
AX-CPT
Responses were recorded using a serial response box with a row of five buttons, and participants were monitored by a research assistant to ensure the consistent use of the left index finger for the left response (left-most button) and right index finger for the right response (right-most button). During practice, participants received correct/incorrect visual feedback and, throughout the experiment, participants received auditory feedback for stimuli (cue or probe) in which the deadline to respond was not met. Accuracy of 75% or higher was required on the practice trials to move on to the experimental trials; otherwise, practice was repeated. Practice was repeated for one participant in E2 due to a lack of initial understanding of the instructions. There was a 15-s break between each block. Participants were guided through the instructions and then completed one practice block and 10 experimental blocks, each consisting of 40 trials, resulting in 40 practice trials and 400 experimental trials (280 AX, 40 AY, 40 BX, and 40 BY trials).
Analyses
ANOVAs were used to examine overall accuracy and mean RT effects, trial type-by-half analyses, RT distributions, and sequential effects. For E1, the overall accuracy and mean RT analyses had been reported in Redick (2014), but all other analyses are new. Follow-up t-tests (two-tailed) were used to further investigate significant interactions. For t-tests, effect sizes were calculated using the method described by Lakens (2013). WMC group (high or low) and Experiment (1 or 2) were between-subjects variables, and all other variables (see below) were within-subjects.1
Proactive control was indexed using d’. This analysis has been used for working memory capacity and AX-CPT in several studies (Boudewyn et al., 2015; Redick & Engle, 2011; Richmond et al., 2015; Stawarczyk et al., 2014) and uses the hits and false alarms for AX and BX trials. Based on Stanislaw and Todorov (1999), we used the loglinear correction for hit and false alarm rates equal to 0 or 1, by adding 0.5 to all hit and false alarm totals and adding 1 to the number of trials.
For the proactive-shift analyses, mean accuracy as a function of trial type for trial blocks 1–5 (first half) and trial blocks 6–10 (second half) was calculated. The change in AY and change in BX across halves were examined within each WMC group.
For the sequential-effect analyses, correct AX trials that appeared directly after either a correct AY (conflict) or a correct BY (non-conflict) trial were grouped as a function of the previous trial type. The RTs were averaged for each WMC group separately. Following Gratton et al. (1992), the typical method for examining sequential effects in cognitive control tasks is comparing incongruent trials preceding congruent trials to congruent trials preceding incongruent trials or congruent trials preceding congruent trials to incongruent trials preceding incongruent trials. However, in the AX-CPT the low frequency of non-AX trial types prevents such a 2 × 2 analysis. For example, a BX (conflict) AY (conflict) comparison might be interesting to examine, except there were, at most, 4 instances of this sequence per participant, in contrast to approximately 30 observations each of AY-AX and BY-AX sequences per participant. Because only trials that participants responded to correctly were analyzed, the responses made for the AY-AX sequence were left (cue), left (non-target), left (cue), and right (X target), and the responses made for the BY-AX sequence were also left (cue), left (non-target), left (cue), and right (target). This matching response pattern helps to ensure that response repetitions are ruled out as an explanation for the sequential effect. Also, by nature of the trial types used, we can rule out stimulus repetitions as an explanation for the sequential effects.
For the RT distributions, the correct AX RTs for each subject were ordered fastest to slowest. Then, they were grouped into deciles. Finally, the means of each individual’s fastest decile within each WMC group were averaged. This was done subsequently for each decile up to the slowest 10%, creating an RT distribution curve for each WMC group.
Results
Overall performance
Mean accuracy and correct RTs as a function of trial type and WMC group are shown for each group separately in Table 2. Consistent with previous studies (Redick & Engle, 2011; Richmond et al., 2015; Stawarczyk et al., 2014), low-WMC individuals appeared to commit more errors overall than did high-WMC individuals (Table 2). In addition, AY and BX accuracy appeared lower than AX and BY accuracy, as expected. A 2 (WMC) × 4 (Trial Type) × 2 (Experiment) ANOVA produced a main effect of WMC, F(1,106) = 9.901, p = .002, ηp2 = .085. There was also a main effect of Trial Type, F(3,318) = 63.162, p < .001, ηp2 = .373, but the WMC by Trial Type interaction was not significant, F(3,318) = 1.179, p = .318, ηp2 = .011. None of the effects involving Experiment were significant (all p’s ≥ .479).
Table 2.
Mean accuracy and mean RTs for each trial type by WMC group
| Measure | WMC | AX | AY | BX | BY |
|---|---|---|---|---|---|
| % of trials | 70 | 10 | 10 | 10 | |
| % Correct M (SD) |
High | 96.71 (2.88) | 84.50 (12.76) | 93.77 (7.76) | 99.05 (1.95) |
| Low | 94.10 (5.01) | 80.09 (16.89) | 88.95 (12.50) | 98.14 (2.32) | |
| RT (ms) M (SD) |
High | 384.1 (58.6) | 525.1 (61.7) | 360.0 (87.5) | 355.8 (69.9) |
| Low | 402.3 (64.9) | 548.2 (55.3) | 388.7 (97.3) | 389.2 (88.5) |
Inspection of Table 2 shows that correct AY trials were slower than other trial types, and the low-WMC group appeared slightly slower than the high-WMC group. A 2 (WMC) × 4 (Trial Type) × 2 (Experiment) ANOVA produced a main effect of WMC, F(1,106) = 4.421, p = .038,ηp2 = .040. There was also a main effect of Trial Type, F(3,318) = 504.239, p < .001, ηp2 = .826, and a significant Trial Type by Experiment interaction, F(3,318) = 9.538, p < .001, ηp2 = .083, the latter effect driven by slower probe responses after B cues in Experiment 1 compared to Experiment 2 (Table A1). All other effects were not significant (all p’s ≥ .129).2
An additional global analysis, d’, is frequently used in the literature as a measure of proactive control (e.g., Stawarczyk et al., 2014). Consistent with previous results (Ball, 2015; Boudewyn et al., 2015; Redick & Engle, 2011; Richmond et al., 2015; Stawarczyk et al., 2014), the proactive index d’ was higher for the high-WMC group (M = 3.577, SD = 0.811) than the low-WMC group (M = 3.101, SD = 1.008), F(1,106) = 7.942, p = .006, ηp2 = .070, indicating that the low-WMC group was behaving less proactively than the high-WMC group.3
Proactive shift
A practice-related proactive shift is indicated by an increase in AY errors and a decrease in BX errors from early to late trials. Inspection of Figure 2 shows that in the high-WMC group, there was no evidence for a practice-related proactive shift. However, in the low-WMC group, there was evidence for a practice-related proactive shift, particularly for AY trials. The full results of the 2 (WMC) × 2 (Trial Type) × 2 (Half of Task) × 2 (Experiment) ANOVA are presented in Table 3 – here we will focus on the effects most important to the question of proactive shift. There were significant main effects of WMC, F(1,106) = 6.920, p = .010, ηp2 = .061, Trial Type, F(1,106) = 23.204, p < .001, ηp2 = .180, and Half of Task, F(1,106) = 5.575, p = .020, ηp2 = .050. However, these main effects were qualified by significant interactions of Trial Type by Half of Task, F(1,106) = 7.601, p = .007, ηp2 = .067, Trial Type by Half of Task by Experiment, F(1,106) = 4.040, p = .047, ηp2 = .037, and most critically, WMC by Trial Type by Half of Task, F(1,106) = 5.734, p = .018, ηp2 = .051.
Figure 2.
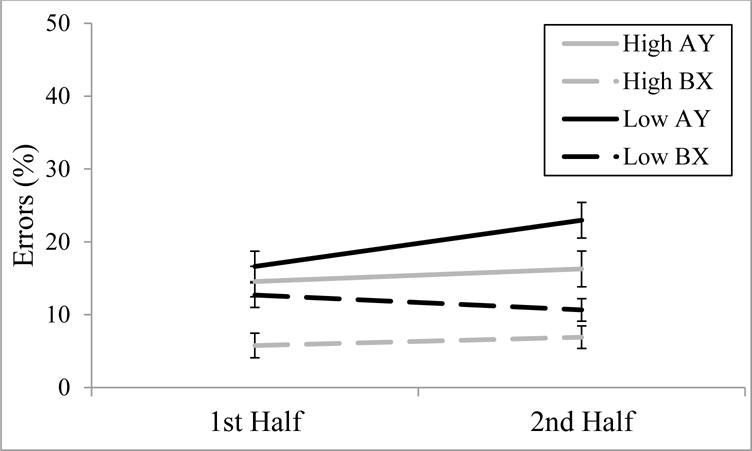
Error rate changes on AY and BX trials from 1st half to 2nd half of experiment as a function of WMC group; error bars are + 1 standard error of the mean. See Table A2 for numerical values.
Table 3.
ANOVA Results for Proactive-Shift Analyses
| Effects | Overall
|
||
|---|---|---|---|
| F | Partial η2 | p | |
| Main Effects | |||
| WMC | 6.920 | .061 | .010 |
| Trial Type | 23.204 | .180 | <.001 |
| Half | 5.575 | .050 | .020 |
| Experiment | 0.299 | .003 | .586 |
| 2-Way Interactions | |||
| WMC × Trial Type | 0.073 | .001 | .788 |
| WMC × Half | 0.221 | .002 | .639 |
| WMC × Experiment | 0.234 | .002 | .630 |
| Trial Type × Half | 7.601 | .067 | .007 |
| Trial Type × Experiment | 0.932 | .009 | .337 |
| Half × Experiment | 4.825 | .044 | .030 |
| 3-Way Interactions | |||
| WMC × Trial Type × Half | 5.734 | .051 | .018 |
| WMC × Trial Type × Experiment | 0.325 | .003 | .570 |
| WMC × Half × Experiment | 0.638 | .006 | .426 |
| Trial Type × Half × Experiment | 4.040 | .037 | .047 |
| 4-Way Interaction | |||
| WMC × Half × Trial Type × Experiment | 0.464 | .004 | .497 |
In order to decompose the significant WMC by Trial Type by Half of Task interaction and look at possible proactive shift as a function of WMC, we conducted 2 (Trial Type) × 2 (Half of Task) ANOVAs separately for the high- and low-WMC groups. For the low-WMC group, significant main effects of Trial Type, F(1,54) = 9.320, p = .004, ηp2 = .147, and Half of Task, F(1,54) = 6.116, p = .017, ηp2 = .102, were qualified by a significant Trial Type by Half of Task interaction, F(1,54) = 7.741, p = .007, ηp2 = .125. Subsequent paired-samples t-tests that the low-WMC group’s increase in AY errors was significant, t(54) = 3.692, p = .001, d = .343, but the decrease in BX errors was not significant, t(54) = −0.483, p = .631, d = .057. For the high-WMC group, although there was a significant main effect of Trial Type, F(1,54) = 26.169, p < .001, ηp2 = .326, the main effect of Half of Task was not significant, F(1,54) = 3.138, p = .082, ηp2 = .055. Most importantly, the Trial Type by Half of Task interaction was not significant, F(1,54) = 0.000, p > .999, ηp2 = .000.
Sequential Effects
In line with a conflict-monitoring account, AX trials after AY trials should be slower than AX trials after BY trials. This pattern is clearly present in Figure 3, and was confirmed with a 2 (WMC) × 2 (Previous Trial Type) × 2 (Experiment) ANOVA, with a main effect of Previous Trial Type, F(1, 106) = 89.024, p < .001, ηp2 = .456. However, there was no main effect of WMC, F(1, 106) = 2.635, p = .107, ηp2 = .024, and no Previous Trial Type by WMC interaction, F(1, 106) = 0.128, p = .721, ηp2 = .001), indicating sequential effects did not vary as a function of individual differences in WMC. A significant Trial Type × Experiment interaction, F(1, 106) = 4.256, p = .042, ηp2 = .039), indicated the sequential effect was slightly larger in E1 (31 ms) than in E2 (20 ms), but no other effects were significant (all p’s ≥ .210).
Figure 3.
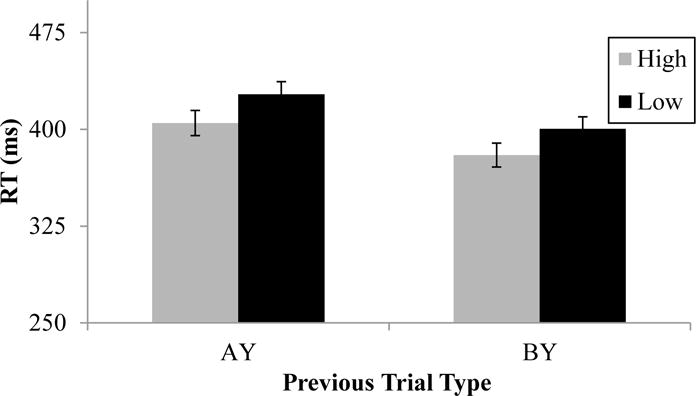
Sequential effects as a function of WMC group. Correct AX RTs following AY (high-conflict) and BY (low-conflict) trials; error bars are + 1 standard error of the mean.
RT Distributions
Although the mean RT analyses reported above indicated no WMC effects on AX targets, we also examined the distribution of AX RTs as a function of WMC group. As seen in Figure 3, the high- and low-WMC groups perform very similarly in their fastest trials but, in the slowest trials, the low-WMC group diverges, getting slower than the high-WMC group. This pattern is confirmed by a 10 (Decile) × 2 (WMC) × 2 (Experiment) ANOVA. First, none of the effects involving Experiment approached significance (all p’s > .379). Not surprisingly, there was a main effect of Decile, F(9,954) = 1,122.265, p < .001, ηp2 = .914. As expected, there was no main effect of WMC, F(1,106) = 2.965, p = .088, ηp2 = .027. Importantly, these findings are qualified by a significant WMC by Decile interaction, F(9,954) = 4.792, p < .001, ηp2 = .043.
Follow-up independent-samples t-tests confirm the impression of Figure 4. In the fastest decile of trials, the WMC groups numerically differ by 6 ms, which is not significant, t(108) = 0.908, p = .366, d = 0.175. However, the WMC difference increases throughout the distribution, such that the low-WMC individuals are significantly slower (47 ms) than the high-WMC individuals only in the slowest 10% of trials, t(108) = 2.344, p = .021, d = 0.451.
Figure 4.
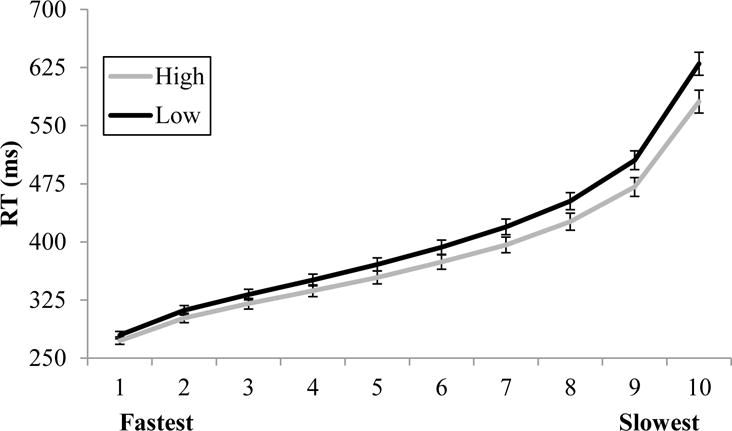
Correct mean RT deciles for AX trials as a function of WMC group; error bars are + 1 standard error of the mean.
Discussion
The present study replicates previous findings (Ball, 2015; Boudewyn et al., 2015; Redick & Engle, 2011; Richmond et al., 2015; Stawarczyk et al., 2014) showing worse performance for low-WMC individuals as compared to high-WMC individuals in the AX-CPT, a task frequently used to study proactive and reactive cognitive control. Additionally, we replicate the finding that low-WMC individuals tend to be less proactive than high-WMC individuals in the AX-CPT. Thus, individual differences in WMC appear to represent what Braver (2012) speculated: “there may be an individual difference dimension that reflects a stable trait-like tendency to prefer reactive or proactive control (p. 12)”. The novel aspect of the current work comes from the analyses of various measures representing adjustments of cognitive control within the AX-CPT, and how these relate to individual differences in WMC.
Looking first at the global adjustments of control, we find evidence for a proactive shift with practice specifically for healthy, young adults with low WMC. Rising AY error rates and decreasing BX error rates are both complementary indicators of reactive control shifting to proactive control. The expected AY error increases were present and significant for low-WMC individuals only, lending support for the proactive-shift account. The BX evidence for proactive shift is less clear. For low-WMC participants, a numeric decrease in BX errors was only present in E1 (Table A2), and even then it only approached significance (p = .079). Although we had no a priori reason to expect practice-related proactive shift to influence AY errors more than BX errors, the results are consistent with a recent proactive-shift study of young adults in which AY errors increased but BX errors were unchanged after explicit proactive strategy training (Gonthier, Macnamara, Chow, Conway, & Braver, 2016).
Importantly, unlike other studies examining the proactive shift, in the current research we included a comparison group that receives the same proactive control ‘manipulation’ (time-on-task). This comparison group, the high-WMC group, showed no evidence for a proactive shift whatsoever, which makes sense if they are already effectively enacting proactive control. The observation that the proactive shift was confined to individuals low in WMC is comparable to other studies with individuals with reduced proactive control, specifically individuals with schizophrenia (Edwards et al., 2010) and older adults (Braver et al., 2009; Paxton et al., 2006).
One potential limitation of the proactive-shift analyses is the number of AY and BX trials, which according to the task structure are designed to be infrequent. By splitting the task in half for the proactive-shift analyses, there are only 20 observations per participant for first half and second half AY and BX trials. Such a low number of trials per person allows just a few errors to make a fairly large difference in these trial type accuracies. However, this is still double the number of observations in the most comparable analysis (Paxton et al., 2006). Also, unlike other investigations of the proactive shift (Braver et al., 2009; Gonthier et al., 2016; Edwards et al., 2010), the present study does not involve explicit instructions between the first half and second half of trials. Thus, observed changes are due only to time-on-task, which is a much subtler manipulation than explicit strategy training or manipulations of incentives to coerce individuals into using proactive control (e.g., Chiew & Braver, 2013). Future studies investigating explicit training procedures to induce shifts of proactive control within healthy young adults may be more fruitful if researchers specifically target individuals low in WMC.
Of interest, the effect of the practice-related proactive shift on low-WMC participants was that they increased their AY error rate relative to earlier in the task, and in comparison to high-WMC participants. Proactive control is thought to be more metabolically costly than reactive control (Braver, 2012), and thus it seems problematic if low-WMC individuals shift to engage in more proactive control but the consequence is worse AY performance compared to high-WMC participants. This suggests that individuals low in WMC are less adept at properly switching to reactive control when necessary, such as after preparing a target response to an A cue but needing to stop that response if the probe is not an X. In fact, manipulations of AX target frequency in previous research (Redick, 2014; Richmond et al., 2015) suggest just that – high-WMC individuals are more likely to use proactive control and more efficiently switch to reactive control when necessary. Thus, like other accounts of individual differences in WMC that indicate low-WMC individuals struggle with both the front-end goal maintenance and the back-end response conflict resolution (Engle & Kane, 2004), the results are consistent with low-WMC individuals struggling with the appropriately adjusting the tradeoff between the costs and benefits of engaging in proactive and reactive control.
Taking information available from all trial types allows for a more in-depth understanding of the different approaches high- and low-WMC individuals take to complete tasks. The current work is strengthened by looking not only at the BX and AY trials as is typical, but also including information from the AX trials. Typically, only performance on BX and AY trial types are interpreted in the context of proactive and reactive control because of the performance differences that should occur with the use of proactive versus reactive control based on the dual mechanisms of control account. However, on AX trials, use of proactive control should lead to consistently fast and accurate responding to AX trials, whereas use of reactive control should lead to slower, more variable, and less accurate responding. This is because when using reactive control, a participant waits for the X probe, then attempts to retrieve the cue representation (A or not A), leading to the necessity of a target response. However, this process takes time, and at least in the present situation a strict time limit is imposed on responding. Thus, if reactive control is too slow of a process or enacted too long after the probe has appeared, the response deadline will have elapsed, resulting in incorrect responding. Thus, WMC differences in accuracy and RT in AX trials are informative within the framework of the dual mechanisms account. Here, this performance is evaluated mainly in the RT distribution analyses.
The RT distribution analyses revealed a specific pattern regarding individual differences in WMC on the frequent AX targets. In their fastest trials, the low-WMC group was just as fast as the high-WMC group. It was only at the slowest trials that the WMC groups differed, with low-WMC individuals producing slower responses in the slowest decile of the RT distribution. Observing this interaction pattern may be considered somewhat surprising, given that (a) the groups did not differ in their mean RTs on AX trials, and (b) there was a 1000 ms response deadline that truncated the RT distribution, in contrast to other WMC research examining RT distributions that used tasks with no response deadlines (e.g., Unsworth et al., 2010). Note that the observation that the low-WMC group was slower than the high-WMC group specifically on the slowest decile of trials is inconsistent with a processing speed explanation of individual differences in WMC. If a processing speed account was accurate, the low-WMC group’s AX responses would have been slower than the high-WMC group’s responses throughout the distribution, and not specifically on the slowest 10% of trials. In addition, McVay and Kane (2012) observed a slightly different pattern, using a go/no-go task. Looking at both tails of the distribution, they found that although lower WMC was associated with slower RTs on the slowest trials in the distribution, lower WMC was actually associated with faster RTs on the fastest trials. Thus, the specificity of the RT distribution pattern we observed as a function of WMC is informative regarding how intra-individual variability in proactive control manifests within the AX-CPT.4
In addition, the proactive-shift and RT distribution results demonstrate an important and more nuanced view of individual differences in WMC than is typically espoused. Based on research showing that high-WMC individuals outperform low-WMC individuals on a variety of classic attention tasks, such as (a) anti-saccade (e.g., Kane et al., 2001); (b) dichotic listening (e.g., Conway, Cowan, & Bunting, 2002); (c) Stroop (e.g., Kane & Engle, 2003); and (d) flankers (e.g., Redick & Engle, 2006), a common view has been that low-WMC individuals cannot effectively control their attention. The current results show that although low-WMC individuals are less likely to use proactive control appropriately compared to high-WMC individuals, individuals low in WMC are not incapable of employing proactive control, and in fact their cognitive control capabilities are just as good as high-WMC individuals when enacted correctly. A question for future research is to determine why low-WMC individuals do not engage proactive control as frequently and/or require more task practice than high-WMC individuals do in situations where proactive control would be beneficial. One possibility suggested by other research is that the failures to use proactive control are due to lapses of attention or mind-wandering (e.g., McVay & Kane, 2009; Stawarczyk et al., 2014; Unsworth & McMillan, 2014). If an individual with low WMC mind wanders during the cue-probe interval, and the distraction causes the person to lose the cue representation from active memory, then they will not be able to use proactive control to prepare a response for the upcoming probe and instead must rely on the default reactive control mode (Braver, 2012).
Along with the RT distribution analyses, sequential effects had not previously been examined in the AX-CPT. Here, in the local adjustments of cognitive control, we found that responses to AX trials following AY (high-conflict) trials were slower than responses to AX trials that followed BY (non-conflict) trials. Importantly, and despite other differences found between the groups, high- and low-WMC individuals did not differ in this post-conflict adjustment. This is consistent with the literature on Stroop and flanker tasks (Hutchison, 2011; Keye et al., 2013; Meier & Kane, 2013; Unsworth et al., 2012) showing no WMC differences in post-conflict adjustments, but inconsistent with at least some literature on the Simon task (Weldon et al., 2013), concluding that there are WMC differences in post-conflict adjustments (but see Gulbinaite & Johnson, 2014; Gulbinaite et al., 2014).
The lack of an interaction between WMC and the sequential conflict-adaptation effects are reminiscent of post-error slowing findings, in which both high- and low-WMC individuals show the typical pattern of slowed responses following errors compared to following correct trials (e.g., Unsworth et al., 2012), but there is no WMC difference. Post-error slowing and sequential conflict-adaptation effects were two central phenomena in the conflict-monitoring account proposed by Botvinick et al. (2001). The implication is that high- and low-WMC individuals do not differ in their ability to monitor and appropriately adjust cognitive control on a trial-by-trial basis. However, the third behavioral phenomenon of the conflict-monitoring account, the proportion congruency effect, has shown to interact with WMC (e.g., Kane & Engle, 2003) – for example, the WMC difference in the Stroop interference effect is larger when the frequency of incongruent trials is low. Note that proportion congruency manipulations tend to occur across experimental blocks, whereas post-error slowing and sequential conflict-adaptation effects occur across trials. Future work will need to delineate the relationships among these three empirical phenomena, and how they relate to individual differences in WMC.
We used an extreme-groups approach to assess the role of WMC in relation to specific indices of AX-CPT performance, similar to Redick and Engle (2011). We are aware of the limitations of extreme-groups designs (Preacher, Rucker, MacCallum, & Nicewander, 2005), but other WMC and AX-CPT research has confirmed the presence of a relationship when utilizing the full range of WMC scores (Ball, 2015; Boudewyn et al., 2015; Richmond et al., 2015; Stawarczyk et al., 2014). Future work with larger samples across the entire distribution of WMC scores will be beneficial to corroborate the findings reported here.
Conclusion
The current study adds to the evidence for a relationship between WMC and the implementation and maintenance of cognitive control, supporting the dual-mechanisms of control theory. We found that low-WMC individuals were less consistent in their implementation of cognitive control, in line with mind-wandering and goal-maintenance accounts. This distinction had not previously been examined in the AX-CPT, but the results are similar to other attention and cognitive control tasks. The present study helps to clarify the manifestation of individual differences in WMC in situations requiring cognitive control. The present study also indicates the importance of going beyond the overall accuracy and RT analyses and suggests such analyses as proactive-shift, sequential effects, and RT distributions may be beneficial in the further study of populations prone to cognitive control failures.
Highlights.
-
-
Low-WMC versus high-WMC individuals employ less consistent cognitive control.
-
-
With time on task, low-WMC individuals increase their use of proactive control.
-
-
There were no working memory differences in sequential-effects.
Acknowledgments
While working on this manuscript, TSR was supported by the Office of Naval Research (Award # N00014-12-1-1011) and National Institutes of Health (Award # 2R01AA013650-11A1), and EAW and TSR were supported by the National Science Foundation (Award # 1632403). The authors thank Taylor Daniel, Emily Grimwood, and Sarika Srivastava for their assistance with data collection for Experiment 2.
Table A1.
Mean accuracy and mean RTs for each trial type by WMC group for each experiment
| E1
|
E2
|
||||||||
|---|---|---|---|---|---|---|---|---|---|
| Measure | WMC | AX | AY | BX | BY | AX | AY | BX | BY |
| % of trials | 70 | 10 | 10 | 10 | 70 | 10 | 10 | 10 | |
| %Correct M (SD) |
High | 96.84 (3.14) |
84.88 (13.36) |
93.25 (8.32) |
99.50 (103) |
96.64 (2.76) |
84.29 (12.60) |
94.07 (7.53) |
98.79 (2.30) |
| Low | 93.09 (5.84) |
80.62 (18.86) |
86.00 (13.96) |
98.50 (1.89) |
94.67 (4.45) |
79.79 (15.94) |
90.64 (1145) |
97.93 (2.54) |
|
| RT (ms) M (SD) |
High | 379.6 (49.3) |
528.3 (51.0) |
385.9 (92.6) |
362.4 (71.2) |
386.7 (63.8) |
523.3 (67.7) |
345.2 (82.1) |
352.0 (70.0) |
| Low | 411.8 (81.7) |
548.1 (57.3) |
422.0 (116.1) |
419.2 (105.2) |
396.9 (53.6) |
548.2 (54.9) |
369.7 (80.4) |
372.1 (73.7) |
|
Table A2.
Proactive shift accuracy as a function of WMC
| Overall
|
E1
|
E2
|
|||||
|---|---|---|---|---|---|---|---|
| WMC | Half | AY M (SD) |
BX M (SD) |
AY M (SD) |
BX M (SD) |
AY M (SD) |
BX M (SD) |
| High | 1st | 14.64 (13.15) |
5.36 (8.55) |
14.25 (13.11) |
7.25 (9.53) |
14.86 (13.37) |
4.29 (7.87) |
| 2nd | 16.36 (14.70) |
7.09 (9.06) |
16.00 (15.53) |
6.25 (8.57) |
16.57 (14.44) |
7.57 (9.42) |
|
| Low | 1st | 16.73 (16.34) |
11.45 (15.30) |
16.25 (17.91) |
17.25 (19.97) |
17.00 (15.63) |
8.14 (10.85) |
| 2nd | 23.09 (19.64) |
10.64 (12.55) |
22.50 (21.18) |
10.75 (10.67) |
23.43 (19.01) |
10.57 (13.65) |
|
Note. Means are % errors.
Table A3.
Main effects and interactions by experiment
| E1 | E2 | |||||
|---|---|---|---|---|---|---|
|
| ||||||
| Effects | F | Partial η2 |
p | F | Partial η2 |
p |
| Accuracy | ||||||
| WMC | 6.137 | .139 | .018 | 4.129 | .057 | .046 |
| Trial Type | 18.771 | .331 | <.001 | 54.350 | .444 | <.001 |
| WMC × Trial Type | 0.622 | .016 | .602 | 0.683 | .010 | .563 |
| Mean RT | ||||||
| WMC | 2.410 | .060 | .129 | 1.724 | .025 | .194 |
| Trial Type | 125.307 | .767 | <.001 | 509.324 | .882 | <.001 |
| WMC × Trial Type | 1.471 | .037 | .226 | 0.835 | .012 | .476 |
| d’ | ||||||
| WMC | 4.777 | .112 | .035 | 3.100 | .044 | .083 |
| Proactive Shift Error Rates | ||||||
| WMC | 3.661 | .088 | .063 | 3.243 | .046 | .076 |
| Trial Type | 0.009 | .000 | .923 | 15.383 | .184 | <.001 |
| Half | 4.323 | .102 | .044 | 28.542 | .296 | <.001 |
| WMC × Trial Type | 0.038 | .001 | .847 | 1.192 | .017 | .279 |
| WMC × Half | 0.206 | .005 | .653 | 0.077 | .001 | .782 |
| Trial Type × Half | 9.318 | .197 | .004 | 0.375 | .005 | .542 |
| WMC × Trial Type × Half | 3.879 | .093 | .056 | 1.972 | .028 | .165 |
| Proactive Shift (Low WMC) | ||||||
| Trial Type × Half | 5.975 | .239 | .001 | 3.641 | .097 | .015 |
| Proactive Shift (High WMC) | ||||||
| Trial Type × Half | 0.702 | .036 | .555 | 0.588 | .017 | .624 |
| Sequential AX Mean RT | ||||||
| WMC | 1.608 | .041 | .212 | 0.831 | .012 | .365 |
| Previous Trial Type | 46.919 | .553 | <.001 | 39.743 | .369 | <.001 |
| WMC × Previous Trial Type | 0.931 | .024 | .341 | 0.598 | .009 | .442 |
| AX RT Deciles | ||||||
| WMC | 2.260 | .056 | .141 | 0.537 | .008 | .466 |
| Bin | 457.478 | .923 | <.001 | 740.079 | .916 | <.001 |
| WMC × Bin | 2.409 | .060 | .012 | 2.957 | .042 | .002 |
Footnotes
Publisher's Disclaimer: This is a PDF file of an unedited manuscript that has been accepted for publication. As a service to our customers we are providing this early version of the manuscript. The manuscript will undergo copyediting, typesetting, and review of the resulting proof before it is published in its final citable form. Please note that during the production process errors may be discovered which could affect the content, and all legal disclaimers that apply to the journal pertain.
A reviewer suggested combining the data from the Atlanta and Purdue samples in order to potentially increase statistical power and to simplify the presentation of the results (e.g., one set of ANOVA statistics for the combined dataset instead of two separate ANOVAs for each dataset), given that the samples’ demographics and performance were similar, and the procedure and design are identical. Thus, the main text reports the results from the combining the datasets. However, for clarity, the descriptive statistics and results based on analyses for each sample separately are provided in the Appendix. Of note, the inferential statistic results, and thus the resulting interpretations, are very similar for both datasets. Any differences between the combined datasets and the separate samples are noted. Critically, only 4 of the 26 effects involving experiment were significant and none of those 4 involved WMC.
Based on previous work (Braver et al., 2001; Richmond et al., 2015), we treated BY performance as the baseline condition to control for non-specific performance differences on the other trial types. Separate ANCOVAs with BY performance (accuracy or mean RT) as the covariate were performed, with WMC and Experiment as between-subjects factors. For AX accuracy, the main effect of WMC was significant, F(1,105) = 7.796, p = .006, ηp2 = .069, and neither effect involving Experiment was significant (both p’s ≥ .101). For AY accuracy, no effects were significant (all p’s ≥ .421). For BX accuracy, the main effect of WMC approached significance, F(1,105) = 3.727, p = .056, ηp2 = .034, as did the main effect of Experiment, F(1,105) = 3.662, p = .058, ηp2 = .034, but the WMC by Experiment interaction was not significant, F(1,105) = 0.850, p = .359, ηp2 = .008. For AX RT, although the main effect of Experiment was significant, F(1,105) = 5.039, p = .027, ηp2 = .046, no other effects were significant (both p’s ≥ .533). For AY RT, no effects were significant (all p’s ≥ .101). For BX RT, the non-significant main effect of WMC, F(1,105) = 3.179, p = .078, ηp2 = .029, and significant main effect of Experiment, F(1,105) = 6.165, p = .015, ηp2 = .055, was qualified by a significant WMC by Experiment interaction, F(1,105) = 5.159, p = .025, ηp2 = .047. As seen in Table A1, the interaction is driven by a slightly larger WMC difference in BX RTs for E1 compared to E2. Note that for the effects identified as significant or approaching significance in the ANCOVA, ANOVAs with WMC and Experiment as between-subjects factors without the BY covariate revealed mostly similar results. For AX accuracy, a significant WMC main effect, F(1,106) = 12.479, p = .001, ηp2 = .105; for BX accuracy, a significant WMC main effect, F(1,106) = 6.748, p = .011, ηp2 = .060; for BX RT, a non-significant WMC main effect, F(1,106) = 2.853, p = .094, ηp2 = .026.
Because the influence of proactive shift (see below) may obfuscate overall AX-CPT performance relative to previous WMC research, we re-analyzed the data from the first half of the task only (200 trials is more similar to the number of trials used in prior studies). The results were qualitatively the same as the overall results, with ANCOVAs treating BY performance as the covariate indicating significant (p < .05) WMC differences on AX accuracy, BX accuracy, BX mean RTs, and d’, and corresponding ANOVAs indicating significant (p < .05) WMC differences on AX accuracy, BX accuracy, and d’ (p = .090 for the WMC main effect for BX mean RTs).
Note that an alternative to the decile analysis of the RT distribution is to conduct an ex-Gaussian analysis, focusing on the tau parameter. Our rationale for reporting the decile analyses instead is that there are strong arguments in the literature suggesting that an ex-Gaussian is not necessarily the most appropriate distribution for analysis of RTs, and is one of many models that could be fit to a dataset (Matzke & Wagenmakers, 2009). Indeed, the decile analysis does not make any specific assumptions about the underlying distribution shape. Nonetheless, we used QMPE (Cousineau, Brown, & Heathcote, 2004) to generate ex-Gaussian parameters for our data and report them here. Note that parameters for one high-WMC participant could not be generated, thus n = 54 for the high-WMC group for the ex-Gaussian analyses. Consistent with the decile analyses, the tau parameter is the only value approaching significance, with low-WMC individuals’ value slightly higher compared to the high-WMC individuals. For mu, the high- (M = 295, SD = 38) and low-WMC (M = 307, SD = 61) groups’ values did not differ, t(107) = 1.197, p = .234. For sigma, the high- (M = 31, SD = 16) and low-WMC (M = 34, SD = 23) groups’ values did not differ, t(107) = 0.851, p = .397. For tau, the high-WMC (M = 84, SD = 29) group’s value was marginally smaller than the low-WMC (M = 95, SD = 31) group’s, t(107) = 1.930, p = .056.
References
- Ball BH. Cognitive control processes underlying continuous and transient monitoring processes in event-based prospective memory. Arizona State University; Tempe, AZ: 2015. Unpublished doctoral dissertation. [Google Scholar]
- Blais C, Stefanidi A, Brewer GA. The Gratton effect remains after controlling for contingencies and stimulus repetitions. Frontiers in Psychology. 2014;5:1–11. doi: 10.3389/fpsyg.2014.01207. [DOI] [PMC free article] [PubMed] [Google Scholar]
- Bopp KL, Verhaeghen P. Aging and verbal memory span: A meta-analysis. The Journals of Gerontology: Series B: Psychological Sciences and Social Sciences. 2005;60(5):P223–P233. doi: 10.1093/geronb/60.5.P223. [DOI] [PubMed] [Google Scholar]
- Botvinivk MM, Carter CS, Braver TS, Barch DM, Cohen JD. Conflict monitoring and cognitive control. Psychological Review. 2001;108:624–652. doi: 10.1037//0033-295X.I08.3.624. [DOI] [PubMed] [Google Scholar]
- Boudewyn MA, Long DL, Traxler MJ, Lesh TA, Dave S, Mangun GR, Carter CS, Swaab TY. Sensitivity to referential ambiguity in discourse: The role of attention, working memory, and verbal ability. Journal of Cognitive Neuroscience. 2015;27(12):1–15. doi: 10.1162/jocn_a_00837. [DOI] [PMC free article] [PubMed] [Google Scholar]
- Braver TS. The variable nature of cognitive control: A dual mechanisms framework. Trends in Cognitive Sciences. 2012;16(2):106–113. doi: 10.1016/j.tics.2011.12.010. [DOI] [PMC free article] [PubMed] [Google Scholar]
- Braver TS, Barch DM, Keys BA, Carter CS, Cohen JD, Kaye JA, Reed BR. Context processing in older adults: Evidence for a theory relating cognitive control to neurobiology in healthy aging. Journal of Experimental Psychology: General. 2001;130:746–763. doi: 10.1037/0096-3445.130.4.746. [DOI] [PubMed] [Google Scholar]
- Braver TS, Gray JR, Burgess GC. Explaining the many varieties of working memory variation: Dual mechanisms of cognitive control. In: Conway ARA, Jarrold C, Kane MJ, Miyake A, Towse JN, editors. Variation in working memory. New York: Oxford University Press; 2007. pp. 76–106. [Google Scholar]
- Braver TS, Paxton JL, Locke HS, Barch DM. Flexible neural mechanisms of cognitive control within human prefrontal cortex. Proceedings of the National Academy of Sciences of the United States of America. 2009;106(18):7351–7356. doi: 10.1073/pnas.0808187106. [DOI] [PMC free article] [PubMed] [Google Scholar]
- Braver TS, Satpute AB, Rush BK, Racine CA, Barch DM. Context processing and context maintenance in healthy aging and early stage dementia of alzheimer’s type. Psychology and Aging. 2005;20:33–46. doi: 10.1037/0882-7974.20.1.33. [DOI] [PubMed] [Google Scholar]
- Carter CS, Braver TS, Barch DM, Botvinick MM, Noll D, Cohen JD. Anterior cingulate cortex, error detection, and the online monitoring of performance. Science. 1998;280:747–749. doi: 10.1126/science.280.5364.747. [DOI] [PubMed] [Google Scholar]
- Chiew KS, Braver TS. Temporal dynamics of motivation-cognitive control interactions revealed by high-resolution pupillometry. Frontiers in Psychology. 2013;4:15. doi: 10.3389/fpsyg.2013.00015. [DOI] [PMC free article] [PubMed] [Google Scholar]
- Conway AA, Cowan N, Bunting MF. The cocktail party phenomenon revisited: The importance of working memory capacity. Psychonomic Bulletin & Review. 2001;8(2):331–335. doi: 10.3758/BF03196169. [DOI] [PubMed] [Google Scholar]
- Cousineau D, Brown S, Heathcote A. Fitting distributions using maximum likelihood: Methods and packages. Behavior Research Methods, Instruments & Computers. 2004;36(4):742–756. doi: 10.3758/BF03206555. [DOI] [PubMed] [Google Scholar]
- Edwards BG, Barch DM, Braver TS. Improving prefrontal cortex function in schizophrenia through focused training of cognitive control. Frontiers in Human Neuroscience. 2010;4(32) doi: 10.3389/fnhum.2010.00032. [DOI] [PMC free article] [PubMed] [Google Scholar]
- Engle RW, Kane MJ. Executive attention, working memory capacity, and a two-factor theory of cognitive control. In: Ross B, editor. The Psychology of Learning and Motivation. Vol. 44. New York: Academic Press; 2004. pp. 145–199. [Google Scholar]
- Gonthier C, Macnamara B, Chow M, Conway ARA, Braver T. Inducing proactive control shifts in the AX-CPT. Frontiers in Psychology. 2016;7:1822. doi: 10.3389/fpsyg.2016.01822. [DOI] [PMC free article] [PubMed] [Google Scholar]
- Gratton G, Coles M, Donchin E. Optimizing the use of information: Strategic control of activation of responses. Journal of Experimental Psychology: General. 1992;121(4):480–506. doi: 10.1037/0096-1523.14.3.331. [DOI] [PubMed] [Google Scholar]
- Gulbinaite R, Johnson A. Working memory capacity predicts conflict-task performance. The Quarterly Journal of Experimental Psychology. 2014;67(7):1383–1400. doi: 10.1080/17470218.2013.863374. [DOI] [PubMed] [Google Scholar]
- Gulbinaite R, van Rijn H, Cohen MX. Fronto-parietal network oscillations reveal relationship between working memory capacity and cognitive control. Frontiers in Human Neuroscience. 2014;8:1–13. doi: 10.3389/fnhum.2014.00761. [DOI] [PMC free article] [PubMed] [Google Scholar]
- Heitz RP, Engle RW. Focusing the spotlight: Individual differences in visual attention control. Journal of Experimental Psychology: General. 2007;136(2):217–240. doi: 10.1037/0096-3445.136.2.217. [DOI] [PubMed] [Google Scholar]
- Hommel B, Proctor RW, Vu KPL. A feature-integration account of sequential effects in the Simon task. Psychological Research. 2004;68:1–17. doi: 10.1007/s00426-003-0132-y. [DOI] [PubMed] [Google Scholar]
- Hutchison KA. The interactive effects of listwide control, item-based control, and working memory capacity on Stroop performance. Journal of Experimental Psychology: Learning, Memory, and Cognition. 2011;37(4):851–860. doi: 10.1037/a0023437. [DOI] [PubMed] [Google Scholar]
- Kane MJ, Bleckley MK, Conway ARA, Engle RW. A controlled-attention view of working-memory capacity. Journal of Experimental Psychology: General. 2001;130(2):169–183. doi: 10.1037//0096-3445.130.2.169. [DOI] [PubMed] [Google Scholar]
- Kane MJ, Engle RW. Working-memory capacity and the control of attention: The contributions of goal neglect, response competition, and task set to Stroop interference. Journal of Experimental Psychology: General. 2003;132(1):47–70. doi: 10.1037/0096-3445.132.1.47. [DOI] [PubMed] [Google Scholar]
- Kerns JG, Cohen JD, MacDonald AI, Cho RY, Stenger VA, Carter CS. Anterior cingulate conflict monitoring and adjustments in control. Science. 2004;303(5660):1023–1026. doi: 10.1126/science.1089910. [DOI] [PubMed] [Google Scholar]
- Keye D, Wilhelm O, Oberauer K, Stürmer B. Individual differences in response conflict adaptations. Frontiers in Psychology. 2013;4:1–15. doi: 10.3389/fpsyg.2013.00947. [DOI] [PMC free article] [PubMed] [Google Scholar]
- Lakens D. Calculating and reporting effect sizes to facilitate cumulative science: A practical primer for t-tests and ANOVAs. Frontiers in Psychology. 2013;4:1–12. doi: 10.3389/fpsyg.2013.00863. [DOI] [PMC free article] [PubMed] [Google Scholar]
- Lee J, Park S. Working memory impairments in schizophrenia: A meta-analysis. Journal of Abnormal Psychology. 2005;114(4):599–611. doi: 10.1037/0021-843X.114.4.599. [DOI] [PubMed] [Google Scholar]
- Long DL, Prat CS. Working memory and Stroop interference: An individual differences investigation. Memory & Cognition. 2002;30(2):294–301. doi: 10.3758/BF03195290. [DOI] [PubMed] [Google Scholar]
- Matzke D, Wagenmakers E. Psychological interpretation of the ex-Gaussian and shifted Wald parameters: A diffusion model analysis. Psychonomic Bulletin & Review. 2009;16(5):798–817. doi: 10.3758/PBR.16.5.798. [DOI] [PubMed] [Google Scholar]
- Mayr U, Awh E, Laurey P. Conflict adaptation effects in the absence of executive control. Nature Neuroscience. 2003;6(5):450–452. doi: 10.1038/nn1051. [DOI] [PubMed] [Google Scholar]
- McVay JC, Kane MJ. Conducting the train of thought: Working memory capacity, goal neglect, and mind wandering in an executive-control task. Journal of Experimental Psychology: Learning, Memory, and Cognition. 2009;35(1):196–204. doi: 10.1037/a0014104. [DOI] [PMC free article] [PubMed] [Google Scholar]
- McVay JC, Kane MJ. Drifting from slow to ‘d’oh!’: Working memory capacity and mind wandering predict extreme reaction times and executive control errors. Journal of Experimental Psychology: Learning, Memory, and Cognition. 2012;38(3):525–549. doi: 10.1037/a0025896. [DOI] [PMC free article] [PubMed] [Google Scholar]
- Meier ME, Kane MJ. Working memory capacity and Stroop interference: Global versus local indices of executive control. Journal of Experimental Psychology: Learning, Memory, and Cognition. 2013;39(3):748–759. doi: 10.1037/a0029200. [DOI] [PubMed] [Google Scholar]
- Meier ME, Kane MJ. Carving executive control at its joints: Working memory capacity predicts stimulus–stimulus, but not stimulus–response, conflict. Journal of Experimental Psychology: Learning, Memory, and Cognition. 2015;41(6):1849–1872. doi: 10.1037/xlm0000147. [DOI] [PMC free article] [PubMed] [Google Scholar]
- Paxton JL, Barch DM, Storandt M, Braver TS. Effects of environmental support and strategy training on older adults’ use of context. Psychology and Aging. 2006;21(3):499–509. doi: 10.1037/0882-7974.21.3.499. [DOI] [PubMed] [Google Scholar]
- Preacher KJ, Rucker DD, MacCallum RC, Nicewander WA. Use of the extreme-groups approach: A critical reexamination and new recommendations. Psychological Methods. 2005;10:178–192. doi: 10.1037/1082-989X.10.2.178. [DOI] [PubMed] [Google Scholar]
- Redick TS. Cognitive control in context: Working memory capacity and proactive control. Acta Psychologica. 2014;145:1–9. doi: 10.1016/j.actpsy.2013.10.010. [DOI] [PubMed] [Google Scholar]
- Redick TS, Broadway JM, Meier ME, Kuriakose PS, Unsworth N, Kane MJ, Engle RW. Measuring working memory capacity with automated complex span tasks. European Journal of Psychological Assessment. 2012;28(3):164–171. doi: 10.1027/1015-5759/a000123. [DOI] [Google Scholar]
- Redick TS, Calvo A, Gay CE, Engle RW. Working memory capacity and go/no-go task performance: Selective effects of updating, maintenance, and inhibition. Journal of Experimental Psychology: Learning, Memory, and Cognition. 2011;37:308–324. doi: 10.1037/a0022216. [DOI] [PubMed] [Google Scholar]
- Redick TS, Engle RW. Working memory capacity and attention network test performance. Applied Cognitive Psychology. 2006;20:713–721. doi: 10.1002/acp.1224. [DOI] [Google Scholar]
- Redick TS, Engle RW. Integrating working memory capacity and context processing views of cognitive control. The Quarterly Journal of Experimental Psychology. 2011;64(6):1048–1055. doi: 10.1080/17470218.2011.577226. [DOI] [PubMed] [Google Scholar]
- Richmond LL, Redick TS, Braver TS. Remembering to prepare: The benefits (and costs) of high working memory capacity. Journal of Experimental Psychology: Learning, Memory, and Cognition. doi: 10.1037/xlm0000122. (in press) [DOI] [PMC free article] [PubMed] [Google Scholar]
- Schmidt JR. Questioning conflict adaptation: Proportion congruent and Gratton effects considered. Psychonomic Bulletin and Review. 2013;20:615–630. doi: 10.3758/s13423-012-0373-0. [DOI] [PubMed] [Google Scholar]
- Servan-Schreiber D, Cohen JD, Steingard S. Schizophrenic deficits in the processing of context: A test of a theoretical model. Archives of General Psychiatry. 1996;53:1105–1112. doi: 10.1001/archpsyc.1996.01830120037008. [DOI] [PubMed] [Google Scholar]
- Stanislaw H, Todorov N. Calculation of signal detection theory measures. Behavior Research Methods, Instruments, & Computers. 1999;31(1):137–149. doi: 10.3758/BF03207704. [DOI] [PubMed] [Google Scholar]
- Stawarczyk D, Majerus S, Catale C, D’Argembeau A. Relationships between mind-wandering and attentional control abilities in young adults and adolescents. Acta Psychologica. 2014;148:25–36. doi: 10.1016/j.actpsy.2014.01.007. [DOI] [PubMed] [Google Scholar]
- Unsworth N, Engle RW. Speed and accuracy of accessing information in working memory: An individual differences investigation of focus switching. Journal of Experimental Psychology: Learning, Memory, and Cognition. 2008;34(3):616–630. doi: 10.1037/0278-7393.34.3.616. [DOI] [PubMed] [Google Scholar]
- Unsworth N, Heitz RP, Schrock JC, Engle RW. An automated version of the operation span task. Behavior Research Methods. 2005;37(3):498–505. doi: 10.3758/BF03192720. [DOI] [PubMed] [Google Scholar]
- Unsworth N, McMillan BD. Trial-to-trial fluctuations in attentional state and their relation to intelligence. Journal of Experimental Psychology: Learning, Memory, and Cognition. 2014;40(3):882–891. doi: 10.1037/a0035544. [DOI] [PubMed] [Google Scholar]
- Unsworth N, Redick TS, Heitz RP, Broadway JM, Engle RW. Complex working memory span tasks and higher order cognition: A latent-variable analysis of the relationship between processing and storage. Memory. 2009;17(6):635–654. doi: 10.1080/09658210902998047. [DOI] [PubMed] [Google Scholar]
- Unsworth N, Redick TS, Lakey CE, Young DL. Lapses in sustained attention and their relation to executive control and fluid abilities: An individual differences investigation. Intelligence. 2010;38:111–122. doi: 10.1016/j.intell.2009.08.002. [DOI] [Google Scholar]
- Unsworth N, Redick TS, Spillers GJ, Brewer GA. Variation in working memory capacity and cognitive control: Goal maintenance and microadjustments of control. The Quarterly Journal of Experimental Psychology. 2012;65(2):326–355. doi: 10.1080/17470218.2011.597865. [DOI] [PubMed] [Google Scholar]
- Unsworth N, Schrock JC, Engle RW. Working memory capacity and the antisaccade task: Individual differences in voluntary saccade control. Journal of Experimental Psychology: Learning, Memory, and Cognition. 2004;30:1302–1321. doi: 10.1037/0278-7393.30.6.1302. [DOI] [PubMed] [Google Scholar]
- Weldon RB, Mushlin H, Kim B, Sohn MH. The effect of working memory capacity on conflict monitoring. Acta Psychologica. 2013;142:6–14. doi: 10.1016/j.actpsy.2012.10.002. [DOI] [PubMed] [Google Scholar]