

Abstract
This study tested the effects of timing and duration of estradiol (E2) treatment, factors that are clinically relevant to hormone replacement in perimenopausal women, on social behavior and expression of genes in brain regions that regulate these behaviors. Female rats were ovariectomized (OVX) at 1 year of age, roughly equivalent to middle-age in women, and given E2 or vehicle for different durations (3 or 6 months) and timing (immediately or after a 3-month delay) relative to OVX. Social and ultrasonic vocalization (USV) behaviors were assessed at the 3 and 6 month timepoints, and the rats’ brains were then used for gene expression profiling in hypothalamus (supraoptic nucleus, paraventricular nucleus), bed nucleus of the stria terminalis, medial amygdala, and prefrontal cortex using a 48-gene qPCR platform. At the 3-month post-OVX testing period, E2 treatment significantly decreased the number of frequency-modulated USVs emitted. No effects of hormone were found at the 6-month testing period. There were few effects of timing and duration of E2 in a test of social preference of a rat given a choice between her same-sex cagemate and a novel conspecific. For gene expression, effects of timing and duration of E2 were region-specific, with the majority of changes found for genes involved in regulating social behavior such as neuropeptides (Oxt, Oxtr & Avp), neurotransmitters (Drd1, Drd2, Htr2a, Grin2d & Gabbr1), and steroid hormone receptors (Esr2, Ar, Pgr). These data suggest that the mode of E2 treatment has specific effects on social behavior and expression of target genes involved in the regulation of these behaviors.
Keywords: Estradiol, Ultrasonic vocalization, Menopause, Hypothalamus, Social behavior, Gene expression, Oxytocin, Vasopressin, Dopamine
1. Introduction
All women who live long enough will experience menopause during their lifetime, either natural or surgical. The loss of ovarian hormones during menopause is associated with a variety of physiological changes that sometimes impair the quality of life. Hormone replacement therapy (HRT) with estradiol (E2) is the single most effective treatment for vasomotor symptoms (e.g. hot flashes) and urogenital atrophy, among other health problems (Baber et al., 2016). However, the early termination of the Women’s Health Initiative (WHI) due to a small but significant increase in certain adverse incidents in the hormone treatment group led to a dramatic decline in the use of HRT in symptomatic women (Rossouw et al., 2002). Subsequent re-evaluation of the WHI suggested that there may be a critical window of opportunity during which HRT is beneficial (Klaiber et al., 2005; Bhupathiraju and Manson, 2014; Manson et al., 2013; Baber et al., 2016). However, empirical evidence for the critical window hypothesis has been provided by only a few preclinical studies (Gibbs, 2000; Daniel et al., 2006; Garcia et al., 2016, 2017; Yin et al., 2015).
Some of the most problematic symptoms experienced by perimenopausal women are neurobiological, including hot flashes and sleep disturbances. A smaller subset of women experience neurobehavioral changes such as anxiety and depression, sometimes leading to problems in interpersonal relationships and a loss of desire for social interactions (Uguz et al., 2011; Deeks and McCabe, 2004; Lanza di Scalea et al., 2012; Schmidt et al., 2000). Studies in female rodents show that the neural circuits and neurotransmitters involved in the control of social behavior, and the behaviors themselves, are subject to age- and hormone (especially E2) regulation. With aging, rodents show increased anxiety and decreased social interaction (Salchner et al., 2004; Guan & Dluzen, 1994; Boguszewski & Zagrodzka, 2002). The importance of hormones is provided by evidence that ovariectomy in female rats leads to decreased social interaction independent of age, and E2 treatment improves social memory and increases social interaction (Hlinák, 1993; Tang et al., 2005). Mice lacking either of the nuclear estrogen receptors show deficits in social interaction and social memory (Choleris et al., 2003, 2006; Kavaliers et al., 2004). The neurotransmitter and neuropeptide systems involved in regulating these behaviors are highly sensitive to E2, including serotoninergic and dopaminergic neurons (Morissette & Di Paolo, 1993; van de Kar et al., 2002; Bazzett & Becker, 1994), and the nonapeptides oxytocin, vasopressin, and their receptors (Winslow and Insel, 2004; Hrabovszky et al, 1998; Quiñones-Jenab et al., 1997; Axelson and van Leeuwen, 1990; Garcia et al., 2016).
The current study sought to test the critical window hypothesis on the social behavioral phenotype, and to determine how underlying neurotransmitter systems in a defined neural network are altered by differential treatment regimes, using middle-aged rats. Social behaviors were tested using a test of ultrasonic vocalizations (USVs) between cagemates as an index of communicative and affective state (Garcia et al., 2017), followed by a test of social preference (Tang et al., 2005; D’Amato & Moles, 2001; Moles et al., 2007; Hlinák, 1993). The neuromolecular phenotype of these animals was assessed using low-density qPCR arrays of relevant brain regions.
2. Materials and Methods
2.1 Animals and Husbandry
All animal procedures were conducted under protocols approved by The University of Texas at Austin institutional animal care and use committee and in accordance with The Guide for the Care and Use of Experimental Animals. Middle-aged adult (~12 months, retired breeders) female Sprague-Dawley rats were purchased from Harlan (Indianapolis, IN). Animals were given water and food ad libitum and kept on a 12-hour dark cycle (lights on at 0700). Upon arrival animals were pair-housed and allowed to acclimate for 2 weeks prior to surgery, during which time estrous cyclicity was monitored daily by vaginal lavage. Only animals that had a regular 4–5 day cycles were used for the experiment. Then, animals underwent bilateral ovariectomy (OVX) surgery as described in our previous studies (Garcia et al., 2016, 2017). During the surgery, each rat was implanted subcutaneously between the shoulder blades with a Silastic capsule containing either 100% cholesterol (VEH) or 5% 17β-estradiol/95% cholesterol. This replacement regime maintains serum E2 concentrations at physiological levels for at least 6 months (Garcia et al., 2017; Yin et al., 2015). Three months after the OVX surgery, animals were subjected to a second surgery. Half of the animals had their Silastic capsules checked to verify that they were intact. The other half of the rats had their capsules removed and switched to the opposite treatment (E2 to vehicle, or vehicle to E2). This resulted in four groups (Figure 1), each with an n of 14, subsequently referred to as V6 (6 months vehicle), E6 (6 months E2), V3/E3 (3 months vehicle, switched to 3 months E2) and E3/V3 (3 months E2, switched to 3 months vehicle) to evaluate effects of hormone timing and duration. Each rat was pair-housed with a cagemate of the same treatment group.
Figure 1.
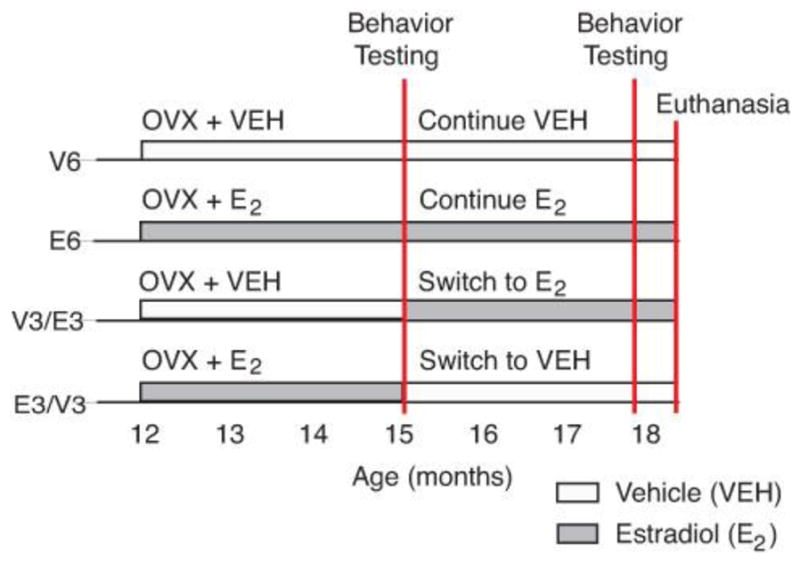
The rat model is shown. Rat were ~1 year of age at the time of OVX, and received either vehicle (cholesterol, VEH) or 5% 17β-estradiol (E2) capsule implantation at the time of surgery. Groups 1 & 2 received treatment for a duration of 6-months. Groups 3 & 4 were the “switch” groups that received either VEH or E2 initially at the time of OVX and were switched to the opposite treatment 3 months later. Behavioral testing occurred twice, once at the end of the 3-month period, and again at the 6-month period. Rats were euthanized one week after the second round of behaviors was completed.
2.2 Behavioral testing
Prior to the start of behavioral testing each rat was separated from her cagemate for one week and the two rats were singly housed. Two rounds of behavioral testing were performed for this study, the first at the end of the first 3-month period, and the second round 3 months later (Figure 1). This allowed us to examine the effects of timing and duration of hormone replacement therapy on the same animals’ behavior.
2.2a Ultrasonic vocalization test (USV)
Following a week of separation of the cagemates, USV testing was conducted over 2 consecutive days in four 5-minute trials, during which USVs were recorded. Details of this test have been published (Garcia et al., 2017). In brief, on day 1 each rat was habituated to a rectangular Plexiglas apparatus (23L × 29W × 40H cm) for 5 minutes (Trial 1). On day 2, rats were given three sequential 5-minute trials, referred to as Trials 2, 3, and 4. In Trial 2, the apparatus was fitted with a removable plastic perforated grid that bisected the apparatus. The cagemates were placed into the apparatus separated by the grid, allowing them to engage in limited interactions across the grid but no physical contact. For Trial 3, the grid was removed and the cagemates were allowed to freely interact with one another. Video recording of this trial was performed, and recordings used to quantify activity, time interacting, and anogenital investigation. For Trial 4 the cagemates were separated into 2 identical apparati and recorded separately. Upon completion of Trial 4, all animals were housed separately from their cagemates until they completed the social preference test.
UltraSoundGate hardware and software was used to record USVs during all four trials. Saslab Pro (Avisoft, Germany) was optimized so that we were able to use it to automatically detect and quantify calls. We found that all calls fell in the range between 30 and 70kHz. We used these data to further differentiate calls into frequency modulated (FM), defined as >9 kHz change in frequency, or non-frequency modulated (NFM; <9 kHz change). Because we were unable to distinguish which rat was calling when the cagemates were together in the apparatus during Trials 2 and 3, we treated each set of cagemates, both of which were in the same treatment group, as a unit for analysis. Therefore, calls from the separated cagemates during Trials 1 and 4 were summed for analysis to be comparable to results in Trials 2 and 3. Videorecordings of USV behavior during Trial 3 were scored by an observer who was blind to the treatment of the animals for time interacting, activity (number of times each animal crossed the center line of the chamber with all four limbs) and anogenital investigation, as published (Garcia et al., 2017).
2.2b Social preference test
The day after USV testing, a 2-day test was performed using a 3-chambered apparatus, as published (Garcia et al., 2017). On day 1, one of the cagemates was randomly chosen to be the experimental rat. She was allowed to habituate for 5 minutes to a Stoelting Plexiglas three-chamber apparatus (100L × 100W × 34.5H cm total), which contained two holding cages in each corner of the side chambers. Once habituation was completed the experimental rat was returned to her home cage, during which time, her cagemate was placed into one of the holding cages, and a novel rat of the same sex, age, and treatment was placed into the other holding cage, with placement side randomized. Then, the experimental animal was placed into the center chamber of the apparatus and allowed to explore the entire apparatus for 5 minutes, and interactions were videorecorded. Rats were returned to single housing overnight. On day 2 the original experimental rat was now used as a stimulus rat, and her cagemate used as the experimental rat. A new rat (same treatment but different from the novel rat on day 1) was used as the novel rat on day 2, and the experiment repeated. Behaviors scored were time immobile, time spent in each chamber, and time spent in proximity to the stimulus rat’s chamber (within one body length), as well as distance traveled and speed. Novelty preference was calculated as [time spent with novel rat]/[time spent with novel rat + cagemate]. On both days, the experimental rats’ movement and behavior were tracked using Any-Maze software (Stoelting Co., Wood Dale, IL). At the end of day 2 of social behavioral testing all animals were rehoused with their cagemates.
2.3 Brain tissue processing
Rats were euthanized one week after behavioral testing was completed (6 months + 1 week post-OVX) at ~18 months of age, between 13:30-16:00 hours by rapid decapitation. Trunk blood was collected and the brains were removed, chilled on ice, and sectioned coronally at 1 mm intervals using an ice-cold stainless steel brain matrix. Brain sections were stored overnight at 4°C in cryogenic storage vials that contained RNAlater (Life Technologies, Grand Island, NY). The next day, the sections were mounted onto chilled slides. Using a dissecting microscope, bilateral brain punches were taken from 5 regions using Palkovits punches and the Paxinos and Watson (2009) rat brain atlas. Regions, punch diameters, and rostral borders relative to Bregma were (respectively): paraventricular nucleus (PVN): 1.22 mm diameter, −0.84; supraoptic nucleus (SON): 0.96 mm diameter, −0.60; medial amygdala (MeA): 1.22 mm diameter, −1.56; bed nucleus of the stria terminalis (BNST): 0.96 mm diameter, 0.00; and prefrontal cortex (PFC): 1.22 mm diameter, 4.20. Bilateral brain punches were stored at −80°C until time of PCR.
2.4 Real-time PCR assays
Using an Allprep RNeasy mini kit (Qiagen, Valencia, California), according to the manufacturer’s protocol, RNA was extracted from frozen PVN, SON, MeA, BNST, and PFC punches of individual rats. The Agilent 2100 Bioanalyzer (Agilent, Santa Clara, CA) verified the quality of RNA, and a GloMax-Multi Detection System (Promega, Madison, WI) was used to quantify nucleic acids for dilution. Using 200 ng RNA, a high-capacity cDNA reverse transcription kit (Life Technologies, Grand Island, NY) was used to convert mRNA to single-stranded cDNA; all samples were then stored at −80°C until use. A customized rat Taqman low-density array (TLDA) Microfluidic 48-gene real-time PCR cards (Applied Biosystems) was used for qPCR with Taqman universal mastermix (Life Technologies, Grand Island, NY) and detected on a ViiA7 machine (Applied Biosystems, Life Technologies, Grand Island, NY) with the following run parameters: 0°C for 2 minutes, 95°C for 10 minutes, 45 cycles of 95°C for 15 seconds, and 60°C for 1 minute.
The genes for the assay were chosen based on their roles in the neurobiology of aging, social behavior, and/or regulation by steroid hormones (45 genes of interest and three normalizing genes; Supplemental Table 1), as well as to match our previous study on young rats (Garcia et al., 2017). Relative expression was determined for each sample using the comparative cycle threshold method (Pfaffl, 2001; Schmittgen and Livak, 2008). All samples were normalized to the geometric mean of the housekeeping genes Gapdh, Rpl13a, and 18s and then calibrated to the median δ-cycle threshold of the vehicle treated group. Samples that amplified at or above 35 ct were excluded from analysis.
2.5 Estradiol hormone assay
Trunk blood that was collected at euthanasia was allowed to clot for 30 minutes, centrifuged (2300 X g) for 5 minutes, and serum collected and stored at −80°C in Eppendorf tubes until time of hormone assays. Concentrations of serum E2 were determined by radioimmunoassay (Ultrasensitive Estradiol RIA, Cat No DSL4800, Lot # 150622C, Beckman Coulter, Pasadena, CA), according to the manufacturer’s directions. A single assay was used for all the samples on samples run in duplicates on volumes of 100 μl of serum. Assay sensitivity was 2.2 pg/ml and intrassay C.V. was 1.30%. Serum E2 concentrations for the four treatment groups were: V6 (16 ± 2), E6 (34 ± 5), V3/E3 (24 ± 5) and E3/V3 (14 ± 1). One-way ANOVA verified that the two groups with E2 capsules (E6, and V3/E3) had significantly higher E2 concentrations than the two groups with VEH capsules (V6, and E3/V3) at the time of euthanasia (p < 0.01).
2.6 Statistical methods
All data were analyzed using SPSS (Version 23). Datasets were examined to determine whether they met assumptions of normality and variance to enable parametric statistics (ANOVA). Data that did not meet criteria were transformed (log or square root) and those that met assumptions were analyzed by ANOVA. Data that did not meet those assumptions were analyzed by non-parametric statistics. In all cases, alpha was set at 0.05. A false discovery rate correction (q-value) was conducted using the Benjamini-Hochberg method (Benjamini & Hochberg, 1995) to correct for multiple comparisons.
The SPSS output was used to calculate the effect size for the main effects, indicated by eta-squared (η2). An η2 of 0.02 is considered small, 0.13 medium, and 0.26 or more large. For pairwise comparisons of significant results, Cohen’s d effect size was calculated [https://www.psychometrica.de/effect_size.html#nonparametric; 0.2 = small, 0.5 = medium, and 0.8 or above = large].
For the USV test, total numbers of USVs, as well as FM and NFM calls, were analyzed. A repeated measures analysis for main effects of trial, treatment, and their interactions was performed, followed by post-hoc analysis when indicated. For the social preference test, a repeated measures analysis was performed to determine effects of treatment on the behavioral measures. Because datasets could not be normalized by transformation, the Mann-Whitney test, followed by a Wilcoxon signed rank test was used.
For gene expression data, statistics were performed using relative expression values for each sample. Datasets were tested for outliers using the Grubbs’ outlier test and a maximum of 2 confirmed outliers were excluded from analysis. Data that met assumptions of normality and variance, or could be transformed (square root) were analyzed by one-way ANOVA with a Tukey HSD post hoc. Otherwise, a non-parametric analysis was performed using a Kruskal-Wallis test followed by a Mann-Whitney test to examine differences between each group.
3. Results
3.1 Ultrasonic vocalization call numbers and behaviors
The first series of USV tests was conducted 3 months after OVX and hormone treatment. There were no significant differences between E2 and vehicle treated animals in total USV calls and non-frequency modulated (NFM) calls (Fig. 2A and Fig. 2C, respectively). For frequency-modulated (FM) calls, there was a significant interaction between trial and treatment (F(3, 90) = 4.56, η2 = 0.11, p < 0.05, Fig. 2B). Post-hoc analysis revealed that VEH animals had significantly more FM calls than E2 animals on Trial 2 (t(30) = 5.67, d = 3.83, p < 0.05). At the 6-month post-OVX time point, there were no significant differences in the number of total (Fig. 2A), FM (Fig. 2B) and NFM (Fig. 2C) USVs.
Figure 2.

Numbers of USV calls are shown for the 3-month and 6-month testing periods. Hash marks on the x-axis indicate the 3-month gap between the two testing periods. The legend illustrates the transition of treatment groups from two groups at 3-months (V3 and E3) to four groups at the 6-month testing period (V6, V3/E3, E6, E3/V3). A) For total number of USVs there were no significant differences between the groups at the 3-month or 6-month testing period. B) For FM calls, the V3 group emitted significantly more calls than the E3 animals on Trial 2. There were no differences between the groups at the 6-month testing period. C) There were no significant differences in non-frequency modulated calls between treatment groups at either testing period. All data are shown as mean ± SEM. *p < 0.05 between V3 and E3 groups in Trial 2.
Trial 3 of the USV test was videotaped, and the following behaviors scored: 1) time spent interacting, 2) number of anogenital investigations, and 3) activity. There were no significant differences between treatment groups at either of the two testing points for the three scored behaviors (Fig. 3A–C).
Figure 3.

Behavioral data scored from videotapes taken during Trial 3 of the USV test at the 3-month and 6-month testing periods are shown for A) Time interacting; B) Anogenital investigation; and C) Activity. The hash marks on the x-axis indicate the 3-month gap between the two testing periods. The legend illustrates the transition of treatments from the 3-month to the 6-month testing period as in Figure 2. There were no significant differences seen between the groups in any of the behaviors scored at the 3-month or 6-month testing period. Data are shown as mean ± SEM.
3.2 Social preference test
There were few treatment effects detected in this test; only significant results are presented here. At the 3-month testing period, VEH animals spent more time immobile than did E2 rats (z = −2.68, d = 0.77, p < 0.05, Fig 4A), whereas E2 rats traveled farther (z = −3.22, d = 1.04, p < 0.01, Fig 4B), and moved more quickly (z = −2.98, d = 0.92, p < 0.05, Fig 4C) than VEH treated animals. Novelty preference (the ratio of time spent with the novel rat to time spent with the sum of both rats) at 3 months was significantly higher in E2 (64% + 7%) than VEH (40% + 7%) rats. At the 6-month testing period, the only significant finding was the amount of time spent near the stimulus animals. V6 treated animals spent significantly more time in proximity to their cagemate than they did with the novel animal (z = −2.07, d = 1.08, p < 0.05, Fig 5); this preference was not significantly different for other groups, although a similar pattern and trend was seen for the V3/E3 group (p = 0.06).
Figure 4.

Social preference data are shown. See legend for Figure 3 for graph details. A) Total time spent immobile was significantly greater in the V3 than the E3 group at the 3-month testing period. B) Total distance traveled was significantly higher in the E3 group than the V3 group at the 3-month testing period. C) The average speed of the E3 groups was significantly faster than the V3 group at the 3-month testing period. There were no treatment differences at the 6-month testing period. *p < 0.05 at the 3-month testing period.
Figure 5.

Social preference results are shown for the total time spent in proximity to the stimulus rats when given a choice between the rat’s cagemate vs. a novel, same-sex same-treatment rat. The hash marks on the x-axis indicate the 3-month gap between the two testing periods. No differences between the V3 and E3 groups were seen at the 3-month testing period. At the 6-month testing period only the V6 group showed a significant preference for either of the stimulus rats, spending significantly more time with her cagemate than the novel animal. *p < 0.05.
3.3 Gene expression
A summary of significant effects of treatment on gene expression is provided in Table 1 for the five brain regions: BNST, SON, PFC, PVN and MeA. Gene expression measurements were conducted after the second round of behavioral testing; therefore results are limited to the V6, E6, V3/E3 and E3/V3 groups. All genes reported as significantly affected by treatment were based on results following false discovery rate correction for multiple comparisons. Detailed statistical results (F- or Chi-squared values, degrees of freedom, and effect sizes) are provided in Table 2. Supplemental Table 1 lists all of the genes on the customized TLDA qPCR card.
Table 1.
Summary of gene expression comparisons.
| Relative to V6 | Relative to E6 | Relative to V3/E3 | |||||
|---|---|---|---|---|---|---|---|
| Gene | E6 | V3/E3 | E3/V3 | V3/E3 | E3/V3 | E3/V3 | |
| SON | Igf1 | -- |
|
|
|
-- | -- |
| Drd2 | -- |
|
-- |
|
-- | -- | |
| PFC | Oxtr |
|
-- | -- | -- | -- | -- |
| Avpr1a |
|
-- | -- | -- |
|
-- | |
| Esr2 | -- | -- | -- | -- |
|
-- | |
| Bdnf | -- |
|
|
|
|
-- | |
| PVN | Oxtr | -- |
|
-- | -- | -- | -- |
| Oxt |
|
-- | -- |
|
-- | -- | |
| Ar |
|
|
-- | -- | -- | -- | |
| Pgr |
|
|
-- | -- | -- |
|
|
| Crh |
|
|
-- | -- | -- |
|
|
| Dnmt3a | -- | -- | -- | -- | -- |
|
|
| Egr1 | -- | -- |
|
-- | -- | -- | |
| Tac3 | -- |
|
-- | -- | -- | -- | |
| MeA | Oxt | -- | -- |
|
-- | -- |
|
| Avp | -- | -- |
|
-- |
|
-- | |
| Ar | -- | -- |
|
-- | -- | -- | |
| Drd1 | -- |
|
-- |
|
-- |
|
|
| Drd2 | -- |
|
-- | -- | -- | -- | |
| Htr2a | -- | -- | -- | -- |
|
-- | |
| Gabbr1 | -- | -- | -- |
|
-- | -- | |
| Grin2d |
|
|
-- | -- | -- | -- | |
| Oprd1 |
|
-- | -- | -- |
|
-- | |
| Dnmt3a | -- |
|
-- | -- |
|
-- | |
| Nr3c1 | -- |
|
-- | -- |
|
|
|
Significant changes in gene expression is shown for the 5 brain regions. Down-regulation is indicated by downward red arrows and up-regulation is indicated by upward green arrows. In the BNST, there were no significant treatment effects.
Table 2.
Statistical results and effect sizes for significant effects of hormone on behaviors and gene expression
| Endpoint | F- or Chi-squared values (degrees of freedom) for ANOVA or Mann-Whitney | Eta-squared effect size | p-value | Directionality of effect | t or z value | Cohen’s d effect size | p-value | |
|---|---|---|---|---|---|---|---|---|
| USVS | #FM calls: Interaction of trial x treatment at the 3-month testing period | F(3, 90) = 4.56 | η2 = 0.11 | p < 0.05 | VEH>E2 in Trial 2 | t(30) = 5.67 | d = 3.83 | p < 0.05 |
| Sociability | Time immobile at the 3-month testing period | V3>E3 | z = −2.68 | d = 0.77 | p < 0.05 | |||
| Distance traveled at the 3-month testing period | E3>V3 | z = −3.22 | d = 1.04 | p < 0.01 | ||||
| Speed at the 3-month testing period | E3>V3 | z = −2.98 | d = 0.92 | p < 0.05 | ||||
| Time near stimulus rat at the 6-month testing period | For the V6 group, Cagemate>Novel | z = −2.07 | d = 1.08 | p < 0.05 | ||||
| SON gene expression | Drd2 | X2(3,36) = 11.11 | η2 = 0.32 | p < 0.05 | V6>V3/E3 | z = −3.52 | d = 1.37 | p < 0.01 |
| η2 = 0.14 | E6>V3/E3 | z = −2.32 | d = 0.80 | p < 0.05 | ||||
| lgf1 | X2(3,35) = 11.40 | η2 = 0.24 | p < 0.05 | V6>V3/E3 | z = −3.03 | d = 1.13 | p < 0.05 | |
| η2 = 0.12 | E6>V3/E3 | z = −2.11 | d = 0.73 | p < 0.05 | ||||
| η2 = 0.14 | V6>E3/V3 | z = −2.34 | d = 0.82 | p < 0.05 | ||||
| PFC gene expression | Oxtr | F(3, 30) = 3.84 | η2 = 0.28 | p < 0.05 | E6>V6 | t= 2.809 | d = 1.33 | p < 0.05 |
| Avpr1a | F(3, 27) = 6.37 | η2 = 0.42 | p < 0.05 | E6>V6 | t= 2.899 | d = 1.68 | p < 0.05 | |
| E6>E3/V3 | t= 2.845 | d = 1.34 | p < 0.05 | |||||
| Esr2 | F(3, 30) = 5.58 | η2 = 0.36 | P < 0.05 | E6>E3/V3 | t= 3.269 | d = 1.54 | p < 0.05 | |
| Bdnf | F(3, 30) = 3.76 | η2 = 0.27 | p < 0.05 | V3/E3>V6 | t= 2.795 | d = 1.40 | p < 0.05 | |
| V3/E3>E6 | t= 1.981 | d = 0.96 | p < 0.05 | |||||
| E3/V3>V6 | t= 3.032 | d = 1.46 | p < 0.05 | |||||
| E3/V3>E6 | t= 2.098 | d = 1.23 | p < 0.05 | |||||
| PVN gene expression | Oxtr | F(3, 33) = 5.27 | η2 = 0.32 | p < 0.05 | V3/E3>V6 | t= 5.897 | d = 2.89 | p < 0.05 |
| Tac3 | F(3, 33) = 3.5 | η2 = 0.24 | p < 0.05 | V3/E3>V6 | t= 2.921 | d = 1.38 | p < 0.05 | |
| Oxt | F(3, 33) = 5.27 | η2 = 0.32 | p < 0.05 | E6>V6 | t= 2.834 | d = 1.32 | p < 0.05 | |
| E6>V3/E3 | t= 3.161 | d = 1.51 | p < 0.05 | |||||
| Pgr | F(3, 34) = 6.57 | η2 = 0.38 | p < 0.05 | V3/E3>V6 | t= 4.337 | d = 2.03 | p < 0.05 | |
| V3/E3>E3/V3 | t= 2.723 | d = 1.25 | p < 0.05 | |||||
| E6>V6 | t= 3.287 | d = 1.54 | p < 0.05 | |||||
| Crh | F(3, 30) = 6.28 | η2 = 0.39 | p < 0.05 | V3/E3>V6 | t= 3.241 | d = 1.54 | p < 0.05 | |
| V3/E3>E3/V3 | t= 3.198 | d = 1.60 | p < 0.05 | |||||
| E6>V6 | t= 2.888 | d = 1.37 | p < 0.05 | |||||
| Dnmt3a | F(3, 33) = 3.19 | η2 = 0.23 | p < 0.05 | E3/V3>V3/E3 | t= 3.149 | d = 1.45 | p < 0.05 | |
| Egr1 | F(3, 33) = 3.34 | η2 = 0.23 | p < 0.05 | E3/V3>V6 | t= 2.753 | d = 1.28 | p < 0.05 | |
| Ar | X2(3,33) = 10.64 | η2 = 0.12 | p < 0.05 | E6>V6 | z = −2.12 | d = 0.75 | p < 0.05 | |
| η2 = 0.28 | V3/E3>V6 | z = −3.20 | d = 1.23 | p < 0.01 | ||||
| MeA gene expression | Oxt | X2(3,28) = 8.77 | η2 = 0.32 | p < 0.05 | E3/V3>V6 | z = −3.13 | d = 1.36 | p < 0.01 |
| η2 = 0.14 | E3/V3>V3/E3 | z = −2.08 | d = 0.81 | p < 0.05 | ||||
| Avp | F(3, 28) = 3.37 | η2 = 0.27 | p < 0.05 | E3/V3>V6 | t= 3.559 | d = 1.95 | p < 0.05 | |
| E3/V3>E6 | t= 3.34 | d = 1.88 | p < 0.05 | |||||
| Ar | X2(3,36) = 8.74 | η2 = 0.29 | p < 0.05 | E3/V3>V6 | z = −3.38 | d = 1.29 | p < 0.01 | |
| Drd1 | X2(3,35) = 10.90 | η2 = 0.22 | p < 0.05 | V6>V3/E3 | z = −2.89 | d = 1.06 | p < 0.05 | |
| η2 =0.11 | E6>V3/E3 | z = −2.05 | d = 0.71 | p < 0.05 | ||||
| η2 = 0.20 | E3/V3>V3/E3 | z = −2.72 | d = 0.98 | p < 0.05 | ||||
| Drd2 | F(3, 34) = 3.12 | η2 = 0.22 | p < 0.05 | V6>V3/E3 | t= 2.702 | d = 1.16 | p < 0.05 | |
| Htr2a | X2(3,35) = 8.16 | η2 = 0.22 | p < 0.05 | E3/V3>E6 | z = −2.91 | d = 1.07 | p < 0.05 | |
| Oprd1 | F(3, 34) = 5.55 | η2 = 0.33 | p < 0.05 | V6>E6 | t= 5.144 | d = 2.52 | p < 0.05 | |
| E3/V3>E6 | t= 4.07 | d = 1.90 | p < 0.05 | |||||
| Gabbr1 | F(3, 35) = 3.72 | η2 = 0.24 | p < 0.05 | E6>V3/E3 | t= 2.332 | d = 1.02 | p < 0.05 | |
| Grin2d | X2(3,35) = 12.35 | η2 = 0.18 | p<0.01 | V6>E6 | z = −2.58 | d = 0.92 | p < 0.05 | |
| η2 = 0.19 | V6>V3/E3 | z = −2.71 | d = 0.98 | p < 0.05 | ||||
| Dnmt3a | F(3, 34) = 9.29 | η2 = 0.45 | p<0.01 | V6>V3/E3 | t= 2.913 | d = 1.27 | p < 0.05 | |
| E3/V3>E6 | t= 3.726 | d = 1.83 | p < 0.05 | |||||
| Nr3c1 | X2(3,36) = 14.88 | η2 = 0.28 | p < 0.005 | E3/V3>E6 | z = −3.32 | d = 1.25 | p < 0.01 | |
| η2 = 0.20 | E3/V3>V3/E3 | z = −2.82 | d = 1.01 | p < 0.05 | ||||
| η2 = 0.12 | V6>V3/E3 | z = −2.20 | d = 0.75 | p < 0.05 |
3.3.1 Bed nucleus of the stria terminalis
After false discovery rate correction, there were no significant differences between groups for any genes.
3.3.2 Supraoptic Nucleus
Two genes in the SON (Figure 6A) had significant main effects of treatment. Dopamine receptor D2 (Drd2) expression was higher in V6 and E6 than V3/E3 rats. Similarly, Igf1 expression was higher in the V6 and E6 than V3/E3 rats. The V6 group was also significantly higher than the E3/V3 group.
Figure 6.

Relative gene expression data are shown for those genes in the supraoptic nucleus (SON) and prefrontal cortex (PFC) with significant main effects of treatment. Detailed statistics are in Table 2. Data are shown as mean ± SEM. *p < 0.05; **p < 0.01.
3.3.3 Prefrontal cortex
In the PFC (Figure 6B), 4 genes had significant main effects of E2 treatment. Oxytocin receptor (Oxtr) expression was higher in E6 compared to V6 rats. Vasopressin receptor 1a (Avpr1a) was higher in E6 than in V6 and E3/V3 animals. Estrogen receptor beta (Esr2) expression was highest in the E6 group, and significantly greater than the E3/V3 rats. For brain derived neurotrophic factor (Bdnf), the two switch groups (V3/E3 and E3/V3) had higher expression than the two continuous (V6 and E6) hormone-treated rats.
3.3.4 Paraventricular nucleus
Eight genes were affected in the PVN (Figure 7). For most, expression was higher in the groups with E2 capsules at the time of euthanasia, namely, the V3/E3 and/or the E6 groups. For the oxytocin receptor (Oxtr) and Tachykinin 3 (Tac3) genes, expression was higher in the V3/E3 than the V6 group. For Oxt, the E6 group had higher expression than the V6 and the V3/E3 groups. Effects of hormone treatment were similar for the progesterone receptor (Pgr) and corticotropin-releasing hormone (Crh) genes. For both, the V3/E3 group had higher expression than V6 and E3/V3 groups. The E6 rats also had higher Pgr and Crh expression than their V6 counterparts. DNA methyltransferase 3a (Dnmt3a) expression was higher in E3/V3 compared to V3/E3 animals. Early growth response 1 (Egr1) was higher in E3/V3 than V6 animals. Lastly, androgen receptor (Ar) was higher in the V3/E3 and E6 groups compared to V6 rats.
Figure 7.

Relative gene expression data are shown for those genes in the paraventricular nucleus (PVN) with significant main effects of treatment. Detailed statistics are in Table 2. Data are shown as mean ± SEM. *p < 0.05; **p < 0.01.
3.3.5 Medial amygdala
Eleven genes had main effects of treatment in the MeA (Figure 8), nearly all with unique expression patterns. Oxt expression was higher in the E3/V3 rats compared to V6 and V3/E3 rats. Avp was also highest in the E3/V3 rats, and significantly greater than V6 and E6 rats. For Ar, E3/V3 rats had higher expression than V6 rats. The dopamine receptors D1 (Drd1) and D2 (Drd2) also had significant main effects of treatment. For Drd1, expression was significantly lower in V3/E3 rats compared to all other groups. For Drd2, V3/E3 rats also had lowest expression, but only significantly different from V6. The serotonin receptor 2a (Htr2a) had higher gene expression in the E3/V3 than E6 group. The opioid receptor delta 1 (Oprd1) had higher expression in rats with vehicle on board at the time of euthanasia (V6, E3/V3) compared to E6. Expression of the GABAB receptor 1 (Gabbr1) was higher in E6 than V3/E3 rats. Grin2d expression was higher in V6 compared to the two groups with E2 present (E6 and V3/E3). Expression of Dnmt3a was higher in the V6 group compared to V3/E3, and the E3/V3 rats had higher expression than E6 rats. Last, the glucocorticoid receptor Nr3c1 had a complex expression pattern. The E3/V3 group had higher expression than the two groups with E2 capsules (E6 and V3/E3). The V6 group also had higher expression of Nr3c1 compared to V3/E3.
Figure 8.

Relative gene expression data are shown for those genes in the medial amygdala (MeA) with significant main effects of treatment. Detailed statistics are in Table 2. Data are shown as mean ± SEM. *p < 0.05; **p < 0.01.
4. Discussion
This study focused on how the timing and duration of estradiol treatment affected the brain and social behavior of aged female rats, to test the “critical window” hypothesis of hormone therapy at the perimenopause. A specific goal of this work was to add to the empirical evidence from a preclinical model that could be used to inform decisions about hormone treatments and to help address the limitations pointed out by results of the Women’s Health Initiative. Our results showed that there are indeed specific timing and duration effects of E2 treatment on social behavior and gene expression as well as some age differences.
4.1 Timing and duration of E2 treatment on social interactions
4.1.1 USV calls and behaviors: few effects of E2 treatment
When rats were tested for numbers of USV calls and associated behaviors, only a single significant effect of E2 was found. At the 3-month behavioral testing period, E2 treated animals emitted significantly fewer frequency-modulated modulated calls in the USV test on Trial 2, when rats were first reintroduced across the grid. This effect was not preserved at the 6-month testing period, with differences attributable to the age at testing (14 vs. 17 months), the possible influence of prior experience in the behavioral test (rats were tested twice, 3 months apart), and/or the nature (duration and timing) of hormone treatments. Future research is needed to differentiate between these possibilities, which are not mutually exclusive.
Previously, we conducted a study using mature adult female rats that were OVX at 4 months of age and given E2 or vehicle for 3 months, at which time they were tested for USV calls and interactions at 7 months of age (Garcia et al., 2017). In contrast to the aging rats of the current study, those younger females had significantly decreased numbers of USV calls of all types in the E2 compared to the VEH rats. When behaviors in USV Trial 3 were scored, anogenital investigation in the younger rats was increased in the E2 compared to VEH rats; again, this was not seen in the current rats tested at 14 or 17 months. These differences indicate that aging plays a large role in effects of hormone treatment on social behavior, and underscores the importance of comparing work done in young OVX rats as a model for menopause with age-appropriate middle-aged animals.
Prior literature examining the effects of estradiol on female USVs is limited, with studies focusing mainly on short-term E2 treatment or stages of the estrous cycle. Interestingly, studies on intact females show that numbers of USVs were higher in females during the late proestrus stage, when E2 and progesterone are highest during the reproductive cycle (Matochik et al., 1992a; Matochik et al., 1992b). In OVX females, short-term E2 treatment increased the total numbers of USVs emitted (Matochik et al., 1992b; McGinnis & Vakulenko, 2003). Though these studies showed that E2 facilitated production of USVs, the nature of the stimulus animals evoking those calls (female-to-male vs. female-to-female), the duration of treatment (short-term vs. long-term E2), and ages (young adult vs. middle-aged) differed from rats in the current study. This results indicates, not surprisingly, that USV communications are dependent upon the experimental context and physiological status of animals.
4.1.2 Social preference for a novel over a familiar (cagemate) rat
Research on social preference and social novelty in rodents shows that in most social contexts, rats spend more time with novel over familiar animals (Markham & Juraska, 2007; Carr et al., 1976; Berlyne, 1950; Bevins & Besheer, 2006). However, our previous study using younger adult paired female cagemates tested at 7 months of age showed a propensity for rats to spend almost twice as much time near, and to make more than twice as many visits to, the cagemate over the novel rat, with no effect of hormone treatment (Garcia et al., 2017). In the current study, the preference for the cagemate was blunted compared to the younger rats of the previous study. At 3 months post-OVX (14 months of age), rats spent equal time with the 2 stimulus animals. Here, at the 6-month post-OVX timepoints, a preference for the cagemate over the novel rat was seen for the V6 group; a similar non-significant trend was seen in the V3/E3 group. Overall, the social preference test revealed that hormone was not a dominant factor driving this behavior with aging. This lack of effect could be due to a loss in sensitivity of the brain’s social decision-making network to the hormone, an age-related decrement in function that was independent of hormone status, or both. In fact, other studies have shown that with aging, there is a decrease in social interactions compared to younger counterparts (Salchner et al., 2004; Guan & Dluzen, 1994; Boguszewski & Zagrodzka, 2002), and an age-related loss of E2’s enhancement of spatial memory in OVX rats (Gibbs, 2000; Daniel et al., 2006).
4.2 Timing and duration of E2 treatment had region-specific effects on gene expression
In the aged rats (17 months) at the end of the study, analysis in the 5 regions revealed unique sets and patterns of genes affected by treatment in the MeA (11 genes), PVN (8 genes), PFC (4 genes), SON (2 genes) and BNST (0 genes). Across these regions, several families of genes were most commonly identified as showing effects of E2 duration and timing: the nonapeptides oxytocin and vasopressin (and receptors); dopamine receptors; and steroid hormone receptors. We will not be able to discuss every significant gene, and have focused discussions on a subset of results organized by related gene families that we find most interesting. However, a summary of changes (Table 1) is provided to give a big picture of the overall pattern.
Several patterns of gene expression are worth noting. In the PFC, for 3 of 4 significant genes (Oxtr, Avpr1a, Esr2) the E6 group stood out from the others, with higher gene expression than in the other treatment groups with no (V6) or shorter (E3/V3, V3/E3) E2 treatment – the latter indicative of a duration effect. In the PVN, of the 8 affected genes, 6 (Oxt, Oxtr, Ar, Pgr, Crh, Tac3) had the highest expression in one or both of the groups with E2 present at the time of euthanasia (E6 or V3/E3). Of particular interest, for some of these genes (Oxtr, Ar, Pgr, Tac3), expression was higher in the V3/E3 than E6 groups, suggesting that the initial deprivation and subsequent insertion of an E2 capsule after a 3-month delay potentiated the response to E2 – i.e., a timing effect. In the MeA, the most genes were affected (11), nearly all with a unique expression pattern, showing the various effects of E2 presence or absence, timing, and duration. It is also worth noting that in a separate study on effects of E2 in the brain of young adult vs. aging male rats (Nutsch et al., 2017), we conducted a similar 48-gene qPCR analysis in 3 regions [preoptic area, BnST, and MeA (posterodorsal subdivision)]. Results showed that by far, the MeA was most sensitive to age/E2 treatment in males – similar to our current finding in the female MeA.
4.2.1 The nonapeptides oxytocin, vasopressin, and their receptors
Oxytocin (Oxt), vasopressin (Avp) and their receptors (Oxtr, Avpr1a) are among the best-studied neural systems involved in the regulation of social behaviors (Egashira et al., 2007; see reviews by Young, 1999; Neumann & Landgraf, 2012). The peptides are synthesized primarily in neurons of the SON and PVN of the hypothalamus; they, and their receptors, are also expressed in the MeA, BNST and PFC, as well as other regions (Axelson and van Leeuwen, 1990; Bale et al., 1995; Smeltzer et al., 2006; Yoshimura et al., 1993; Štefánik et al., 2015; Smith et al., 2017). Interestingly, oxytocin and vasopressin bind to each other’s receptors, in some cases with similar affinity (Ivanisevic et al., 1989), although their density differs in most brain regions (Smith et al., 2017). In the current study, E2 had unique timing and duration effects in the MeA, PVN and PFC. In the MeA, both Oxt and Avp were highest in the E3/V3 switch group, and 2 to 3-fold higher than the other vehicle group (V6) at the time of euthanasia. This means that the presence of E2 given at the time of OVX, and its subsequent deprivation, has unique and long-lasting effects. A different pattern and subset of genes were seen in the PVN. There, Avp expression was unaffected, but Oxt expression was highest in the E6 group, indicating that a longer duration of estradiol has different effects from shorter-term treatment.
The receptors for oxytocin and vasopressin also had unique expression patterns, indicative of specific timing and duration effects. In the PFC, both receptors Oxtr and Avpr1a were highest in the E6 rats, again indicating the long-term continuous presence of E2 is needed to maintain high levels of this gene. In the PVN, Oxtr was highest in the V3/E3 compared to V6 rats, indicative of a timing (delayed E2 treatment) effect.
These findings are interesting because the literature on E2 regulation of the nonapeptide genes is mixed, with some studies showing up-regulation (deGrassi et al., 2010 [PVN]; de Vries et al., 1986 [MeA]; Patisaul et al., 2003 [MeA]), down-regulation (Nomura et al., 2002 [MeA]; Shughrue et al., 2002 [PVN]) or no changes (Nomura et al., 2002 [PVN]; Patisaul et al., 2003 [PVN]) in response to E2. Also, to our knowledge this is the first study to show effects of E2 on Oxtr and Avpr1a expression in the PFC. It is important to note that prior studies used relatively short-term E2 treatments and were not conducted in the context of aging. Thus, our current study adds to the literature by showing that the age of the animal along with the timing and duration of E2 play important roles in determining its effectiveness.
4.2.3 Dopamine receptors in the MeA and SON
Dopamine receptors play roles in anxiety, depression and social behavior (Morgan et al., 2002; Leblois et al., 2010; Skuse & Gallagher, 2009; Morissette & Di Paolo, 1993; Bazzett & Becker, 1994; Lammers et al., 1999). These behaviors are sexually dimorphic in humans, with depression and anxiety higher in women than in men (Wong & Licinio, 2001). Women experiencing menopause can have increases in affective dysfunctions (Freeman et al., 2004; Schmidt et al., 2004; Bromberger et al., 2011). Dopamine receptors are also well known to be E2-sensitive (Morissette & Di Paolo, 1993; Bazzett & Becker, 1994; Lammers et al., 1999). In fact, prior work conducted in other brain regions reported that estrogen treatment led to hyposensitivity whereas the loss of estrogen caused hypersensitivity (Roy et al., 1990; Bédard et al., 1983; Gordon & Perry, 1983).
In our study, both Drd1 and Drd2 in the MeA were lowest in the V3/E3 rats, especially relative to the V6 group. A similar pattern was seen for Drd2 in the SON. Our companion study conducted in mature adult rats found a similar result (Garcia et al., 2017). Thus, the timing and duration of E2 treatment are important factors in dopamine receptor gene regulation.
4.3 Conclusion
The current study is, to our knowledge, the first to look at the effects of timing and duration of estradiol on social behavior and gene expression in aging female rats. As a whole, our findings demonstrate that the critical window hypothesis may be age dependent vis-à-vis social behavior, and that molecular actions caused by different modes of E2 treatment are region- and gene-specific. The relationships between the behavioral outcomes and the neuromolecular gene profiles were not straightforward; this is not surprising considering that each gene can play multiple roles within a specific brain region due to heterogeneity within any nucleus.
The use of same-sex cagemates adds a new social context to previous studies utilizing USV communications as indices of sociosexual or motivational status. Our findings may also have implications for human research examining the role of estradiol in a social context, which is currently very limited. Although yet to be proven, translation of this research may demonstrate that the critical window hypothesis is indeed relevant to anxiety, depression, and a sense of social isolation in women experiencing menopause naturally or surgically.
Highlights.
Estradiol treatment (E2T) modestly altered communicative/social behaviors in aging female rats.
Effects of timing and duration of E2T on gene expression were brain region-specific.
Genes for oxytocin, vasopressin, and their receptors were strongly influenced by E2T.
Affected genes in the paraventricular nucleus were mostly up-regulated by E2T.
The medial amygdala had the most genes (11) altered by E2T timing and duration.
Acknowledgments
Grant support: NIH AG016765
Footnotes
Publisher's Disclaimer: This is a PDF file of an unedited manuscript that has been accepted for publication. As a service to our customers we are providing this early version of the manuscript. The manuscript will undergo copyediting, typesetting, and review of the resulting proof before it is published in its final citable form. Please note that during the production process errors may be discovered which could affect the content, and all legal disclaimers that apply to the journal pertain.
References
- Axelson JE, van Leeuwen FW. Differential localization of estrogen receptors in various vasopressin synthesizing nuclei of the rat brain. J Neuroendocrinol. 1990;2:209–216. doi: 10.1111/j.1365-2826.1990.tb00852.x. [DOI] [PubMed] [Google Scholar]
- Baber RJ, Panay N, Fenton A IMS Writing Group. 2016 IMS recommendations on women’s midlife health and menopause hormone therapy. Climacteric. 2016;19:109–150. doi: 10.3109/13697137.2015.1129166. [DOI] [PubMed] [Google Scholar]
- Bale TL, Pederson CA, Dorsa DM. CNS oxytocin receptor mRNA expression and regulation by gonadal steroids. Adv Exp Med Biol. 1995;395:269–280. [PubMed] [Google Scholar]
- Bazzett TJ, Becker JB. Sex differences in the rapid and acute effects of estrogen on striatal D2 dopamine receptor binding. Brain Res. 1994;637(1–2):163–72. doi: 10.1016/0006-8993(94)91229-7. [DOI] [PubMed] [Google Scholar]
- Bédard P, Boucher R, Di Paoloa T, Labrie F. Biphasic effect of estradiol and domperidone on lingual dyskinesia in monkeys. Exp Neurol. 1983;82(1):172–182. doi: 10.1016/0014-4886(83)90252-2. [DOI] [PubMed] [Google Scholar]
- Benjamini Y, Hochberg Y. Controlling the false discovery rate: a practical and powerful approach to multiple testing. J R Stat Soc Ser B Methodol. 1995;57(1):289–300. doi: 10.2307/2346101. [DOI] [Google Scholar]
- Berlyne DE. Novelty and curiosity as determinants of exploratory behavior. Br J Psychol. 1950;41:68–80. doi: 10.1111/j.2044-8295.1950.tb00262.x. [DOI] [Google Scholar]
- Bevins RA, Besheer J. Object recognition in rats and mice: a one-trial non-matching-to-sample learning task to study ‘recognition memory’. Nat Protoc. 2006;1(3):1306–1311. doi: 10.1038/nprot.2006.205. [DOI] [PubMed] [Google Scholar]
- Bhupathiraju SN, Manson JE. Menopausal hormone therapy and chronic disease risk in the Women’s Health Initiative: Is timing everything? Endocrine Practice. 2014;20(11):1201–1213. doi: 10.4158/EP14205.RA. [DOI] [PubMed] [Google Scholar]
- Boguszewski P, Zagrodzka J. Emotional changes related to age in rats--a behavioral analysis. Behav Brain Res. 2002;133(2):323–332. doi: 10.1016/S0166-4328(02)00018-9. [DOI] [PubMed] [Google Scholar]
- Bromberger JT, Kravitz HM, Chang YF, Cyranowski JM, Brown C, Matthews KA. Major depression during and after the menopausal transition: Study of Women’s Health Across the Nation (SWAN) Psychol Med. 2011;41:1879–1888. doi: 10.1017/S003329171100016X. [DOI] [PMC free article] [PubMed] [Google Scholar]
- Carr WJ, Yee L, Gable D, Marasco E. Olfactory recognition of conspecifics by domestic Norway rats. J Comp Physiol Psychol. 1976;90(9):821–828. doi: 10.1037/h0077266. [DOI] [PubMed] [Google Scholar]
- Choleris E, Gustafsson JA, Korach KS, Muglia LJ, Pfaff DW, Ogawa S. An estrogen-dependent four-gene micronet regulating social recognition: A study with oxytocin and estrogen receptor-alpha and –beta knockout mice. Proc Natl Acad Sci USA. 2003;100(10):6192–6917. doi: 10.1073/PNAS.0631699100. [DOI] [PMC free article] [PubMed] [Google Scholar]
- Choleris E, Ogawa S, Kavaliers M, Gustafsson JA, Korach KS, Muglia LJ, Pfaff DW. Involvement of estrogen receptor alpha, beta and oxytocin in social discrimination: A detailed behavioral analysis with knockout female mice. Genes Brain Behav. 2006;5(7):528–539. doi: 10.1111/j.1601-183X.2006.00203.x. [DOI] [PubMed] [Google Scholar]
- D’Amato FR, Moles A. Ultrasonic vocalizations as an index of social memory in female mice. Behav Neurosci. 2001;115(4):834–840. doi: 10.1037/0735-7044.115.4.834. [DOI] [PubMed] [Google Scholar]
- Daniel JM, Hulst JL, Berbling JL. Estradiol replacement enhances working memory in middle-aged rats when initiated immediately after ovariectomy but not after a long-term period of ovarian hormone deprivation. Endocrinology. 2006;147(1):607–614. doi: 10.1210/en.2005-0998. [DOI] [PubMed] [Google Scholar]
- deGrassi D, Amorim AM, Garcia-Segura LM, Panzica G. Estrogen receptor alpha is involved in the estrogenic regulation of arginine vasopressin immunoreactivity in the supraoptic and paraventricular nuclei of ovariectomized rats. Neurosci Lett. 2010;474(3):135–139. doi: 10.1016/j.neulet.2010.03.022. [DOI] [PubMed] [Google Scholar]
- de Vries GJ, Duetz W, Buijs RM, van Heerikhuize J, Vreeburg JT. Effects of androgens and estrogens on the vasopressin and oxytocin innervation of the adult rat brain. Brain Res. 1986;399:296–302. doi: 10.1016/0006-8993(86)91519-2. [DOI] [PubMed] [Google Scholar]
- Deeks AA, McCabe MP. Well-being and menopause: An investigation of purpose in life, self-acceptance and social role in premenopausal, perimenopausal, and postmenopausal women. Qual Life Res. 2004;13(2):389–398. doi: 10.1023/B:QURE.0000018506.33706.05. [DOI] [PubMed] [Google Scholar]
- Egashira N, Tanoue A, Matsuda T, Koushi E, Harada S, Takano Y, Tsujimoto G, Mishima K, Iwasaki K, Fujiwara M. Impaired social interaction and reduced anxiety-related behavior in vasopressin V1a receptor knockout mice. Behav Brain Res. 2007;178(1):123–127. doi: 10.1016/j.2006.12.009. [DOI] [PubMed] [Google Scholar]
- Freeman EW, Sammel MD, Liu L, Gracia CR, Nelson DB, Hollander L. Hormones and menopausal status as predictors of depression in women in transition to menopause. Arch Gen Psychiatry. 2004;61(1):62–70. doi: 10.1001/archpsyc.61.1.62. [DOI] [PubMed] [Google Scholar]
- Garcia AN, Depena CK, Yin W, Gore AC. Testing the critical window of estradiol replacement on gene expression of vasopressin, oxytocin, and their receptors in the hypothalamus of aging female rats. Mol Cell Endocrinol. 2016;419:102–112. doi: 10.1016/j.mce.2015.10.004. [DOI] [PMC free article] [PubMed] [Google Scholar]
- Garcia AN, Bezner K, Depena C, Yin W, Gore AC. The effects of long-term estradiol treatment on social behavior and gene expression in adult female rats. Horm Behav. 2017;87:145–154. doi: 10.1016/j.yhbeh.2016.11.011. [DOI] [PMC free article] [PubMed] [Google Scholar]
- Gibbs RB. Long-term treatment with estrogen and progesterone enhances acquisition of a spatial memory task by ovariectomized aged rats. Neurobiol Aging. 2000;21:107–116. doi: 10.1016/S0197-4580(00)00103-2. [DOI] [PubMed] [Google Scholar]
- Gordon JH, Perry KO. Pre- and postsynaptic neurochemical alterations following estrogen-induced striatal dopamine hypo- and hypersensitivity. Brain Res Bull. 1983;10(4):425–428. doi: 10.1016/0361-9230(83)90137-5. [DOI] [PubMed] [Google Scholar]
- Guan X, Dluzen DE. Age related changes of social memory/recognition in male Fischer 344 rats. Behav Brain Res. 1994;61:87–90. doi: 10.1016/0166-4328(94)90011-6. [DOI] [PubMed] [Google Scholar]
- Hlinák Z. Social recognition in ovariectomized and estradiol-treated female rats. Horm Behav. 1993;27:159–166. doi: 10.1006/hbeh.1993.1012. [DOI] [PubMed] [Google Scholar]
- Hrabovszky E, Kalló I, Hajszán T, Shughrue PJ, Merchenthaler I, Liposits Z. Expression of estrogen receptor-beta messenger ribonucleic acid in oxytocin and vasopressin neurons of the rat supraoptic and paraventricular nuclei. Endocrinology. 1998;139(5):2600–2604. doi: 10.1210/endo.139.5.6024. [DOI] [PubMed] [Google Scholar]
- Ivanisevic M, Behrens O, Helmer H, Demarest K, Fuchs AR. Vasopressin receptors in human pregnant myometrium and decidua: interactions with oxytocin and vasopressin agonists and antagonists. Am J Obstet Gynecol. 1989;161:1637–1643. doi: 10.1016/0002-9378(89)90941-1. [DOI] [PubMed] [Google Scholar]
- Kavaliers M, Agmo A, Choleris E, Gustafsson JA, Korach KS, Muglia LJ, Pfaff DW, Ogawa S. Oxytocin and estrogen receptor alpha and beta knockout mice provide discriminably different odor cue in behavioral assays. Genes Brain Behav. 2004;3(4):189–195. doi: 10.1111/j.1601-183x.2004.00068.x. [DOI] [PubMed] [Google Scholar]
- Klaiber EL, Vogel W, Rako S. A critique of the Women’s Health Initiative hormone therapy study. Fertil Steril. 2005;84(6):1589–1601. doi: 10.1016/j.fertnstert.2005.08.010. [DOI] [PubMed] [Google Scholar]
- Lammers CH, D’Souza U, Qin ZH, Lee SH, Yajima S, Mouradian MM. Regulation of striatal dopamine receptors by estrogen. Synapse. 1999;34(3):222–227. doi: 10.1002/(SICI)1098-2396(19991201)34:3<222;;AID-SYN6>3.0.CO;2-J. [DOI] [PubMed] [Google Scholar]
- Lanza di Scalea T, Matthews KA, Avis NE, Thurston RC, Brown C, Harlow S, Bromberger JT. Role stress, role reward and mental health in a multiethnic sample of midlife women: Results from the study of Woman’s Health Across the Nation (SWAN) J Women’s Health. 2012;21(5):481–489. doi: 10.1089/jwh.2011.3180. [DOI] [PMC free article] [PubMed] [Google Scholar]
- Leblois A, Wendel BJ, Perkel DJ. Striatal dopamine modulates basal ganglia output and regulates social context-dependent behavioral variability through D1 receptors. J Neurosci. 2010;30(16):5730–43. doi: 10.1523/JNEUROSCI.5974-09.2010. [DOI] [PMC free article] [PubMed] [Google Scholar]
- Manson JE, Chlebowski RT, Stefanick ML, Aragaki AK, Rossouw JE, Prentice RL, … Wallace RB. Menopausal hormone therapy and health outcomes during the intervention and extended poststopping phase of the Women’s Health Initiative randomized trials. JAMA. 2013;310(13):1353–1368. doi: 10.1001/jama.2013.278040. [DOI] [PMC free article] [PubMed] [Google Scholar]
- Markham JA, Juraska JM. Social recognition memory: influence of age, sex, and ovarian hormonal status. Physiol Behav. 2007;92(5):881–888. doi: 10.1016/j.physbeh.2007.06.020. [DOI] [PMC free article] [PubMed] [Google Scholar]
- Matochik JA, White NR, Barfield RJ. Variations in scent marking and ultrasonic vocalizations by Long-Evans rats across the estrous cycle. Physiol Behav. 1992a;51(4):783–786. doi: 10.1016/0031-9384(92)90116-J. [DOI] [PubMed] [Google Scholar]
- Matochik JA, Barfield RA, Nyby J. Regulation of sociosexual communication in female Long–Evans rats by ovarian hormones. Horm Behav. 1992b;26:545–555. doi: 10.1016/0018-506X(92)90021-M. [DOI] [PubMed] [Google Scholar]
- McGinnis MY, Vakulenko M. Characterization of 50-kHz ultrasonic vocalizations in male and female rats. Physiol Behav. 2003;80(1):81–88. doi: 10.1016/S0031-9384(03)00227-0. [DOI] [PubMed] [Google Scholar]
- Moles A, Costantini F, Garbugino L, Zanettini C, D’Amato FR. Ultrasonic vocalizations emitted during dyadic interactions in female mice: A possible index of sociability? Behav Brain Res. 2007;182:223–230. doi: 10.1016/j.bbr.2007.01.020. [DOI] [PubMed] [Google Scholar]
- Morgan D, Grant KA, Gage HD, Mach RH, Kaplan JR, Prioleau O, Nader SH, Buchheimer N, Ehrenkaufer RL, Nader MA. Social dominance in monkeys: dopamine D2 receptors and cocaine self-administration. Nat Neurosci. 2002;5(2):169–74. doi: 10.1038/nn798. [DOI] [PubMed] [Google Scholar]
- Morissette M, Di Paolo T. Effect of chronic estradiol and progesterone treatments of ovariectomized rats on brain dopamine uptake sites. J Neurochem. 1993;60(5):2876–1863. doi: 10.1111/j.1471-4159.1993.tb13415.x. [DOI] [PubMed] [Google Scholar]
- Neumann ID, Landgraf R. Balance of brain oxytocin and vasopressin: implications for anxiety, depression, and social behaviors. Trends Neurosci. 2012;35(11):649–659. doi: 10.1016/j.tins.2012.08.004. [DOI] [PubMed] [Google Scholar]
- Nomura M, McKenna E, Korach KS, Pfaff DW, Ogawa S. Estrogen receptor-beta regulates transcript levels for oxytocin and arginine vasopressin in the hypothalamic paraventricular nucleus of male mice. Brain Res Mol Brain Res. 2002;109(1–2):84–94. doi: 10.1016/S0169-328X(02)00525-9. [DOI] [PubMed] [Google Scholar]
- Nutsch VL, Bell MR, Will RG, Yin W, Wolfe A, Gillette R, Dominguez JM, Gore AC. Aging and estradiol effects on gene expression in the medial preoptia area, bed nucleus of the stria terminalis, and posterodorsal medial amygdala of male rats. Mol Cell Endocrinol. 2017;442:153–164. doi: 10.1016/j.yhbeh.2017.08.008. [DOI] [PMC free article] [PubMed] [Google Scholar]
- Patisaul HB, Scordalakes EM, Young LJ, Rissman EF. Oxytocin, but not oxytocin receptor, is regulated by oestrogen receptor β in the female mouse hypothalamus. J Neuroendocrinol. 2003;15(16):787–793. doi: 10.1046/j.1365-2826.2003.01061.x. [DOI] [PubMed] [Google Scholar]
- Paxinos G, Watson C. The Rat Brain in Stereotaxic Coordinates: Compact. 6. Elsevier Inc; San Diego, CA: 2009. [Google Scholar]
- Pfaffl MW. A new mathematical model for relative quantification in real-time RT-PCR. Nucl Acids Res. 2001;29:e45. doi: 10.1093/nar/29.9.e45. [DOI] [PMC free article] [PubMed] [Google Scholar]
- Quiñones-Jenab V, Jenab S, Ogawa S, Adan RA, Burbach JP, Pfaff DW. Effects of estrogen on oxytocin receptor messenger ribonucleic acid expression in the uterus, pituitary, and forebrain of the female rat. Neuroendocrinol. 1997;65(1):9–17. doi: 10.1159/000127160. [DOI] [PubMed] [Google Scholar]
- Rossouw JE, Anderson GL, Prentice RL, LaCroix AZ, Kooperberg C, Stefanick ML, Jackson RD, Beresford SA, Howard BV, Johnson KC, Kotchen JM, Ockene J. Risk and benefits of estrogen plus progestin in healthy postmenopausal women: Principle results from the Women’s Health Initiative randomized controlled trial. JAMA. 2002;288(3):321–333. doi: 10.1001/jama.288.3.366. [DOI] [PubMed] [Google Scholar]
- Roy EJ, Buyer DR, Licari VA. Estradiol in the striatum: Effects on behavior and dopamine receptors but no evidence for membrane steroid receptors. Brain Res Bull. 1990;25(2):221–227. doi: 10.1016/0361-9230(90)90064-7. [DOI] [PubMed] [Google Scholar]
- Salchner P, Lubec G, Singewald N. Decreased social interaction in aged rats may not reflect changes in anxiety-related behaviour. Behav Brain Res. 2004;151(1–2):1–8. doi: 10.1016/j.bbr.2003.07.002. [DOI] [PubMed] [Google Scholar]
- Schmidt PJ, Haq N, Rubinow DR. A longitudinal evaluation of the relationship between reproductive status and mood in perimenopausal women. Am J Psychiatry. 2004;161(12):2238–44. doi: 10.1176/appi.ajp.161.12.2238. [DOI] [PubMed] [Google Scholar]
- Schmidt PJ, Nieman L, Danaceau MA, Tobin MB, Roca CA, Murphy JH, Rubinow DR. Estrogen replacement in perimenopause-related depression: a preliminary report. Am J Obstet Gynecol. 2000;183(2):414–420. doi: 10.1067/mob.2000.106004. [DOI] [PubMed] [Google Scholar]
- Schmittgen TD, Livak KJ. Analyzing real-time PCR data by the comparative C(T) method. Nat Protocols. 2008;3(6):1101–1108. doi: 10.1038/nprot.2008.73. [DOI] [PubMed] [Google Scholar]
- Shughrue PJ, Dellovade TL, Merchenthaler I. Estrogen modulates oxytocin gene expression in regions of the rat supraoptic and paraventricular nuclei that contain estrogen receptor-β. Prog Brain Res. 2002;139:15–29. doi: 10.1016/S0079-6123(02)39004-6. [DOI] [PubMed] [Google Scholar]
- Skuse DH, Gallagher L. Dopaminergic-neuropeptide interactions in the social brain. Trends Cogn Sci. 2009;13:27–35. doi: 10.1016/j.tics.2008.09.007. [DOI] [PubMed] [Google Scholar]
- Smeltzer MD, Curtis JT, Aragona BJ, Wang Z. Dopamine, oxytocin, and vasopressin receptor binding in the medial prefrontal cortex of monogamous and promiscuous voles. Neurosci Lett. 2006;394(2):146–151. doi: 10.1016/j.neulet.2005.10.019. [DOI] [PubMed] [Google Scholar]
- Smith CJW, Poehlmann ML, Li S, Ratnaseelan AM, Bredewold R, Veenema AH. Age and sex differences in oxytocin and vasopressin V1a receptor binding densities in the rat brain: focus on the social decision-making network. Brain Struct Funct. 2017;222:981–1006. doi: 10.1007/s00429-016-1260-7. [DOI] [PMC free article] [PubMed] [Google Scholar]
- Štefánik P, Olexová L, Kršková L. Increased sociability and gene expression of oxytocin and its receptor in the brains of rats affected prenatally by valproic acid. Pharmacol Biochem Behav. 2015;131:42–50. doi: 10.1016/j.pbb.2015.01.021. [DOI] [PubMed] [Google Scholar]
- Tang AC, Nakazawa M, Romeo RD, Reeb BC, Sisti H, McEwen BS. Effects of long-term estrogen replacement on social investigation and social memory in ovariectomized C57BL/6 mice. Horm Behav. 2005;47(3):350–357. doi: 10.1016/j.yhbeh.2004.10.010. [DOI] [PubMed] [Google Scholar]
- Uguz F, Sahingoz M, Gezhinc K, Ayhan MG. Quality of life in postmenopausal women: The impact of depressive and anxiety disorders. Int J Psychiatry Med. 2011;41(3):281–292. doi: 10.2190/PM.41.3.g. [DOI] [PubMed] [Google Scholar]
- Van De Kar LD, Raap DK, Battaglia G, Muma NA, Garcia F, DonCarlos LL. Treatment of cycling female rats with fluoxetine induces desensitization of hypothalamic 5-HT1A receptors with no change in 5-HT2A receptors. Neuropharmacol. 2002;43(1):45–54. doi: 10.1016/S0028-3908(02)00075-8. [DOI] [PubMed] [Google Scholar]
- Winslow JT, Insel TR. Neuroendocrine basis of social recognition. Curr Opin Neurobiol. 2004;14(2):248–53. doi: 10.1016/j.conb.2004.03.009. [DOI] [PubMed] [Google Scholar]
- Wong ML, Licinio J. Research and treatment approaches to depression. Nature Rev Neurosci. 2001;2(5):343–351. doi: 10.1038/35072566. [DOI] [PubMed] [Google Scholar]
- Yin W, Maguire SM, Pham B, Garcia AN, Dang NV, Liang J, Wolfe A, Hofmann HA, Gore AC. Testing the critical window hypothesis of timing and duration of estradiol treatment on hypothalamic gene networks in reproductively mature and aging female rats. Endocrinology. 2015;156(8):2918–2933. doi: 10.1210/en.2015-1032. [DOI] [PMC free article] [PubMed] [Google Scholar]
- Yoshimura R, Kiyama H, Kimura T, Araki T, Maeno H, Tanizawa O, Tohyama M. Localization of oxytocin receptor messenger ribonucleic acid in the rat brain. Endocrinology. 1993;133(3):1239–46. doi: 10.1210/endo.133.3.8396014. [DOI] [PubMed] [Google Scholar]
- Young LJ. Oxytocin and vasopressin receptors and species-typical social behaviors. Horm Behav. 1999;36:212–221. doi: 10.1006/hbeh.1999.1548. [DOI] [PubMed] [Google Scholar]