

Abstract
Background
Higher levels of sodium and lower levels of potassium intake are associated with higher blood pressure. However, the shape and magnitude of these associations can vary by study participant characteristics or intake assessment method. Twenty-four hour urinary excretion of sodium and potassium are unaffected by recall errors and represent all sources of intake, and were collected for the first time in a nationally representative US survey. Our objective was to assess the associations of blood pressure and hypertension with 24-hour urinary excretion of sodium and potassium among US adults.
Methods
Cross-sectional data from 766 participants aged 20–69 years with complete blood pressure and 24-hour urine collections in the 2014 National Health and Nutrition Examination Survey, a nationally-representative survey of the US noninstitutionalized population. Usual 24-hour urinary electrolyte excretion (sodium, potassium, and their ratio) was estimated from up to two collections on non-consecutive days, adjusting for day-to-day variability in excretion. Outcomes included systolic and diastolic blood pressure from the average of 3 measures and hypertension status, based on average blood pressure ≥140/90 and anti-hypertensive medication use.
Results
After multivariable adjustment, each 1000 mg difference in usual 24-hour sodium excretion was directly associated with systolic (4.58 mmHg, 95% confidence interval 2.64,6.51) and diastolic (2.25 mmHg, 95% CI 0.83,3.67) blood pressures. Each 1000 mg difference in potassium excretion was inversely associated with systolic blood pressure (−3.72 mmHg, 95% CI −6.01, −1.42). Each 0.5 unit difference in sodium-to-potassium ratio was directly associated with systolic blood pressure (1.72 mmHg, 95% CI 0.76, 2.68). Hypertension was linearly associated with progressively higher sodium and lower potassium excretion; compared with the lowest quartiles of excretion, the adjusted odds of hypertension for the highest quartiles were 4.22 (95% CI 1.36, 13.15) for sodium, and 0.38 (95% CI 0.17, 0.87) for potassium, respectively, P<0.01 for trends.
Conclusions
These cross-sectional results show a strong dose-response association between urinary sodium excretion and blood pressure, and an inverse association between urinary potassium excretion and blood pressure, in a nationally representative sample of US adults.
Keywords: sodium, potassium, blood pressure, hypertension
INTRODUCTION
Hypertension is a key modifiable risk factor for cardiovascular disease (CVD), the leading cause of morbidity and mortality in the United States.1 Studies indicate that excess dietary sodium is related to increased blood pressure,2–4 while high potassium intake is related to lower blood pressure,5 and the sodium-to-potassium ratio may be more strongly associated with blood pressure than either sodium or potassium alone.6 However, most studies examining these associations have used self-reported dietary measures to estimate intake, including the National Health and Nutrition Examination Survey (NHANES), which has traditionally used 24-hour dietary recalls. Self-reported dietary intake is limited by participant ability to recall detailed information on foods and beverages, and portion sizes. In addition, food composition databases may not accurately reflect product reformulations, and dietary recalls do not capture sodium intake from salt added at the table.7 Dietary recalls may also be subject to differential bias across weight status categories, with more frequent under-reporting of intake among obese persons.8
Twenty-four hour urinary electrolyte excretion is not subject to the limitations of dietary measures. When collection is complete, 24-hour urine is recommended as the gold standard for assessing sodium intake.9, 10 Twenty-four hour dietary recalls may underestimate average sodium intake by 4%–34% compared to 24-hour urinary excretion.11, 12 Potassium intake estimated from dietary recalls may be higher than urinary excretion measures by up to 16%.11, 12 Accounting for day-to-day variation in urinary excretion of electrolytes is required for assessment of intake in observational studies of health outcomes.11, 13
In 2014, for the first time, NHANES collected 24-hour urine samples and measured urinary electrolytes among a representative sample of U.S. adults ages 20–69 years. These data allow assessment of the associations of urinary sodium and potassium excretion with blood pressure in the U.S. population, unbiased by self-report of food intake. We hypothesized that higher excreted sodium and sodium-to-potassium ratio would be significantly associated with higher blood pressure and odds of hypertension, and that higher potassium excretion would be inversely associated with blood pressure and odds of hypertension.
METHODS
Design
Cross-sectional survey data were analyzed from the 2014 NHANES, a nationally-representative survey of noninstitutionalized persons in the U.S. For the purposes of reproducing the results, all SAS code is available to other researchers upon request to the corresponding author. All NHANES 24-hour urine study procedures are publicly available,14, 15 as are other NHANES 2013–2014 data and procedures.16 Access to the 24-hour urine data are limited to guarantee confidentiality of the survey participants. Secure, on-site access is granted through the National Center for Health Statistics (NCHS) Research Data Center.17 NHANES was approved by the NCHS research ethics review board and participants gave informed consent.
In 2014 only, one-half of NHANES non-pregnant participants aged 20–69 years who were examined in the Mobile Examination Center (MEC) were randomly selected to participate in the 24-hour urine collection study (n=1,103). Methods for 24-hour urine collection are described in detail elsewhere.14, 15 In brief, collection kits were provided to participants and study staff explained procedures. Participants were randomly assigned to collect 24-hour urine samples on either a weekday or a weekend day, and when possible, participants both started and finished the 24-hour collection at the MEC. Of participants who collected a complete 24-hour urine specimen (n=827), some (n=585) were randomly selected to provide a second 24-hour urine collection 3–10 days later, to allow for estimation of day-to-day variation. Urine specimens were considered incomplete if: start and end time were not recorded and could not be ascertained; length of collection time was less than 22 hours; total urine volume was less than 400 ml; a female participant was menstruating; or a participant reported that more than a few drops of urine were missed during collection. NHANES did not analyze samples that were collected over less than 22 hours and the longest collection time analyzed was 27.1 hours. To account for collections that were shorter or longer than 24 hours, NHANES provided adjusted 24-hour urine volume for each participant (total volume divided by collection time, multiplied by 24), which we used for calculation of estimated 24-hour urinary sodium and potassium excretion. Urinary sodium and potassium were assessed using Beckman Synchron DxC800, which uses indirect ion selective electrode methodology to determine ion concentration. Of participants selected for the first 24-hour urine collection, 827 (75% of 1,103) returned a complete specimen, and approximately half of those (n=436; 75% of 585) returned a complete specimen for the second 24-hour urine collection. The unweighted response rate of the examined sample in NHANES 2013–2014 was 66% for adults 20–69 years. The overall component response rate for the first 24-hour urine collection was 50% (75% of 66%). An additional 61 participants were excluded due to missing information on variables included in this analysis (described below), leaving 766 participants for analysis.
Main Outcomes and Measures
Up to three brachial systolic blood pressure (SBP) and diastolic blood pressure (DBP) readings were averaged to determine mean blood pressure values. All participants completed at least two blood pressure measurements, and nearly all (>99%) completed three measurements. Blood pressure readings were taken by trained technicians using a calibrated mercury sphygmomanometer with the cuff appropriate for a participant’s arm measurements, while participants were in a sitting position in the MEC after at least 5 minutes of rest; detailed procedures and equipment are described elsewhere.18 Hypertension was defined as mean SBP ≥140 mm Hg, mean DBP ≥90 mm Hg, or self-reported use of antihypertensive medication. Among those who did not meet criteria for hypertension, prehypertension was defined as a mean SBP of 120–139 mm Hg or a mean DBP of 80–89 mm Hg. Optimal blood pressure was defined as a mean SBP <120 mm Hg and mean DBP <80 mm Hg among participants not using antihypertensive medication. In addition to above categorical variables indicating hypertension status, associations with continuous measures were also examined for DBP, SBP, and mid blood pressure. Mid blood pressure (SBP + DBP, divided by two) was identified as the most informative measure for stroke mortality and ischemic heart disease mortality, compared with SBP, DBP, pulse pressure, and mean arterial pressure by the Prospective Studies Collaborative.19
Estimated usual mean 24-hour sodium and potassium excretion, as well as sodium to potassium ratio, were calculated using measurement error models that included a second 24-hour excretion, collected among a sample of 436 participants with an initial 24-hour urine collection, to account for day-to-day variation.20 The National Cancer Institute measurement error method (and corresponding SAS macro) was used for estimating usual sodium and potassium excretion.21
Measurement error models and multivariable regression models included age, sex, race/ethnicity (non-Hispanic white, non-Hispanic black, Hispanic, non-Hispanic Asian, and other), body mass index (BMI), educational attainment (any higher education versus a high school degree, GED, or less), self-reported history of CVD (congestive heart failure, coronary heart disease, angina/angina pectoris, heart attack, or stroke), diabetes status (self-reported diagnosis by a health care provider or use of a diabetes medication), chronic kidney disease (CKD; estimated glomerular filtration rate <60 mL/min/1.73 m2 or urinary albumin/creatinine ratio > 30 mg/g),22 smoking status (current, former, or never smoker), and self-reported physical activity (ideal: ≥ 75 minutes per week vigorous intensity or ≥150 minutes per week moderate or combination of moderate and vigorous activity; intermediate: 5–74 minutes per week vigorous intensity or 10–149 minutes per week moderate or combination of moderate and vigorous activity; or inactive). Self-reported alcohol use was available for a subset of participants; higher than recommended alcohol use was defined as an average of more than two alcoholic drinks per day for men or more than one drink per day for women. One drink was defined for NHANES participants as 12 oz. beer, a 5 oz. glass of wine, or one and half ounces of liquor.
Statistical Analysis
Demographic and health characteristics were compared across hypertension status categories using t-tests and analysis of variance (ANOVA) for continuous variables and Rao-Scott F adjusted chi-square test for categorical variables. We compared least square means of usual sodium excretion, potassium excretion, and sodium-to-potassium ratio, adjusted for age, sex, race/ethnicity, and BMI, across hypertension status categories using ANOVA. Fully-adjusted multivariable linear and logistic regression models additionally included education, history of CVD, diabetes, chronic kidney disease, smoking status, and physical activity. Models examining sodium excretion simultaneously controlled for potassium excretion, and vice versa. Associations between sodium, potassium, and their ratio with measures of blood pressure were tested for non-linearity using Wald chi-square tests, and restricted cubic spline plots were created to examine relationships visually.23 Multivariable linear regression was used to assess the associations of sodium excretion (per 1,000 mg/d), potassium excretion (per 1,000 mg/d), and sodium-to-potassium ratio (per 0.5 unit molar ratio) with blood pressure (continuous variables: SBP, DBP, and mid blood pressure).
We compared blood pressure across population quartiles of sodium and potassium excretion using an alternative approach due the variability in sodium and potassium excretion, and, consequently, potential misclassification of individuals at or near the quartile cutpoints. Given that sodium, potassium, and sodium-to-potassium ratio had approximately linear relationships to blood pressure, we calculated the 12.5th, 37.5th, 62.5th, and 87.5th percentiles from the distribution of estimated usual excretion. Using the parameters from the linear regression models, we then estimated the adjusted mean SBP of these percentiles, which can be interpreted as the mean blood pressure value at the middle of each population quartile for sodium, potassium, or sodium-to-potassium ratio (Figure 1). For hypertension, we used multivariable logistic regression to assess associations with odds of hypertension, comparing the adjusted odds at the mid-values of each excretion quartile, Q4 (the 87.5th percentile), Q3 (62.5th percentile), and Q2 (37.5th percentile) vs. the lowest quartile (Q1, the 12.5th percentile) using a similar approach as the linear regression models. To determine whether trends were significant across quartiles, a Satterthwaite adjusted F-test was used.
Figure 1. Adjusted systolic blood pressure by mid-value of quartile of usual sodium excretion, usual potassium excretion, and their ratio, among adults aged 20–69, NHANES 2014.
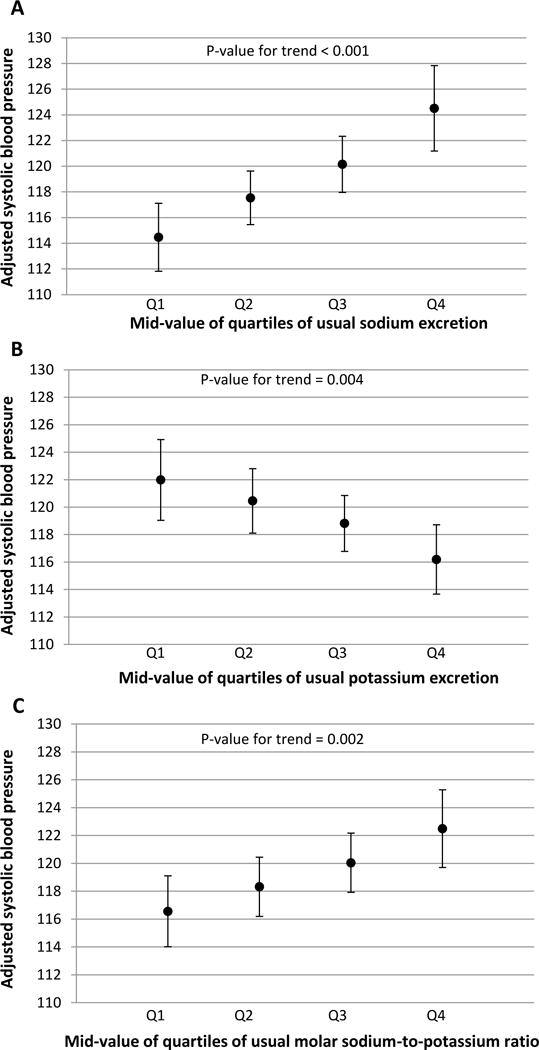
This figure presents adjusted mean systolic blood pressure at the 12.5th, 37.5th, 62.5th, and 87.5th percentiles (mid-values of Q1, Q2, Q3, Q4) of usual sodium excretion (Panel A), usual potassium excretion (Panel B), and sodium-to-potassium ratio (Panel C), using average values for covariates. P-values indicate t-tests for trend from the survey-adjusted regression models.
Sensitivity analyses were conducted: i) including creatinine as a covariate (n=766); (ii) restricted to persons not taking anti-hypertensive medications (n=587); (iii) restricted to persons without CVD (n=718); (iv) restricted to persons with complete 24-hour urine collection based on creatinine excretion criteria (n=565);24 (v) using multiple imputation (SAS proc MI with 5 imputed datasets) to impute data for persons who were missing covariate data, i.e., SBP, DBP, Hypertension, diabetes status, CVD, BMI, CKD (n=827); and (vi) including alcohol consumption as a covariate (n=717). Multivariable regression models were tested for interaction between the independent variable (sodium, potassium, or sodium-to-potassium ratio) and all other covariates. All analyses used SAS 9.3 and SAS-callable SUDAAN (SAS Institute Inc., Cary, NC) with one year 24-hour urine sample weights to account for non-response and the complex survey design of NHANES.
RESULTS
Over half of U.S. adults age 20–69 were classified as hypertensive (weighted prevalence 28.2%, 95% confidence interval [CI] 21.6–34.8) or pre-hypertensive (23.1%, 19.5–26.6), combined. Adults with hypertension were older, and had higher BMI, than those with prehypertension or optimal blood pressure (both p<0.01 for trend, Table 1). An addition, a higher proportion of adults with hypertension had a history of CVD, diabetes, or chronic kidney disease (all p<0.01).
Table 1.
Participant characteristics by hypertensive status, U.S. adults age 20–69, NHANES 2014.
| Characteristic | Hypertensive (n=235) |
Pre-hypertensive (n=183) |
Optimal (n=348) |
P-value for trend | |||
|---|---|---|---|---|---|---|---|
| Estimate | SE | Estimate | SE | Estimate | SE | ||
| Age, years | 52.3 | 0.7 | 45.0 | 1.2 | 37.0 | 1.0 | <0.001 |
| Male (%) | 47.5 | 4.2 | 59.5 | 6.2 | 43.2 | 2.8 | 0.074 |
| Female (%) | 52.5 | 4.2 | 40.5 | 6.2 | 56.8 | 2.8 | |
| Race/ethnicity (%) | 0.033 | ||||||
| Non-Hispanic white | 69.3 | 7.0 | 61.0 | 5.9 | 62.1 | 5.6 | |
| Non-Hispanic black | 14.3 | 3.7 | 12.1 | 4.1 | 9.5 | 2.8 | |
| Hispanic | 8.5 | 2.6 | 18.0 | 3.2 | 19.0 | 3.1 | |
| Non-Hispanic Asian | 5.4 | 2.0 | 4.0 | 1.2 | 6.8 | 1.8 | |
| BMI, kg/m2 | 32.6 | 1.0 | 31.2 | 0.8 | 27.5 | 0.5 | <0.001 |
| History of CVD (%) | 10.6 | 2.4 | 4.4 | 1.7 | 1.3 | 0.6 | 0.002 |
| Diabetes (%) | 27.4 | 3.7 | 4.8 | 1.8 | 4.1 | 1.5 | <0.001 |
| Chronic kidney disease (%) | 22.3 | 4.1 | 6.4 | 2.1 | 5.7 | 1.0 | <0.001 |
| Smoking Status (%) | 0.002 | ||||||
| Never smoked | 49.8 | 5.1 | 47.0 | 4.2 | 67.0 | 3.9 | |
| Former smoker | 27.0 | 4.5 | 25.8 | 4.6 | 14.1 | 3.1 | |
| Current smoker | 23.3 | 2.4 | 27.3 | 3.7 | 18.9 | 2.6 | |
| Heavy alcohol use* | 18.8 | 4.2 | 15.2 | 3.6 | 17.9 | 3.7 | 0.844 |
| Physical activity (%) | <0.001 | ||||||
| Ideal | 47.3 | 3.6 | 62.8 | 4.3 | 70.6 | 2.8 | |
| Intermediate | 19.2 | 4.5 | 16.3 | 4.2 | 12.5 | 1.9 | |
| Inactive | 33.5 | 4.0 | 20.9 | 3.3 | 16.9 | 2.7 | |
| Creatinine (mg/d) | 1529.2 | 36.9 | 1654.4 | 59.5 | 1524.7 | 28.2 | 0.093 |
Alcohol use available for 717 participants. Among these, 220 had hypertension, 173 had pre-hypertension, and 324 had optimal blood pressure.
Sample sizes (n) are unweighted. Means and prevalences are weighted, but not age-adjusted. NHANES 2014 participants aged 20–69 years who completed 24-hour urine collection; pregnant women are excluded.
Hypertension defined as mean systolic blood pressure (SBP) ≥140 mm Hg, mean DBP ≥90 mm Hg, or self-reported use of antihypertensive medication. Prehypertension defined as a mean SBP 120–139 mm Hg or a mean DBP 80–89 mm Hg. Optimal blood pressure was defined as a mean SBP of < 120 mm Hg and a mean DBP <80 mm Hg. Mean blood pressure was estimated from up to 3 readings during the physical examination in the mobile examination center. Weighted prevalence of hypertension was 28.2% (95% confidence interval 21.6–34.8%), pre-hypertension was 23.1% (19.5–26.6%), and optimal blood pressure was 48.7% (42.7–54.8%).
Sodium, potassium, and sodium-to-potassium ratio did not differ by hypertension status after adjustment for age, sex, race/ethnicity, and BMI (Table 2). In fully-adjusted models additionally including education, history of CVD, diabetes, chronic kidney disease, smoking status, and physical activity (Figure 1), average SBP was higher across increasing quartiles of sodium excretion (p<0.01 and sodium-to-potassium ratio (p<0.01). Across higher quartiles of potassium excretion, SBP was lower (p<0.01). Associations between estimated usual excretion of sodium, potassium, and their ratio with systolic blood pressure were approximately linear (Figure 2), and tests for non-linearity were not significant.
Table 2.
Estimated mean (SE) usual 24-hour sodium excretion, potassium excretion, and sodium-to-potassium ratio among U.S. adults aged 20–69 years, by hypertension status, NHANES 2014.
| Hypertensive (n=235) |
Pre-hypertensive (n=183) |
Optimal (n=348) |
||||
|---|---|---|---|---|---|---|
| Mean | SE | Mean | SE | Mean | SE | |
| Sodium excretion, mg/d | 3739.6 | 70.0 | 3553.7 | 60.1 | 3657.9 | 73.3 |
| Potassium excretion, mg/d | 1993.7 | 42.8 | 2080.6 | 50.2 | 2154.2 | 53.4 |
| Sodium-to-potassium ratio | 3.4 | 0.1 | 3.2 | 0.1 | 3.2 | 0.1 |
Least square means of usual excretion were adjusted for mean-centered age, sex, race/ethnicity, and mean-centered BMI. F tests for trend in 24-hour urinary analyte excretion by hypertensive status were not statistically significant. Sodium-to-potassium ratio expressed as molar ratio.
Figure 2. Cubic spline plots of the association between systolic blood pressure and usual sodium excretion, usual potassium excretion, and their ratio, among adults aged 20–69, NHANES 2014.
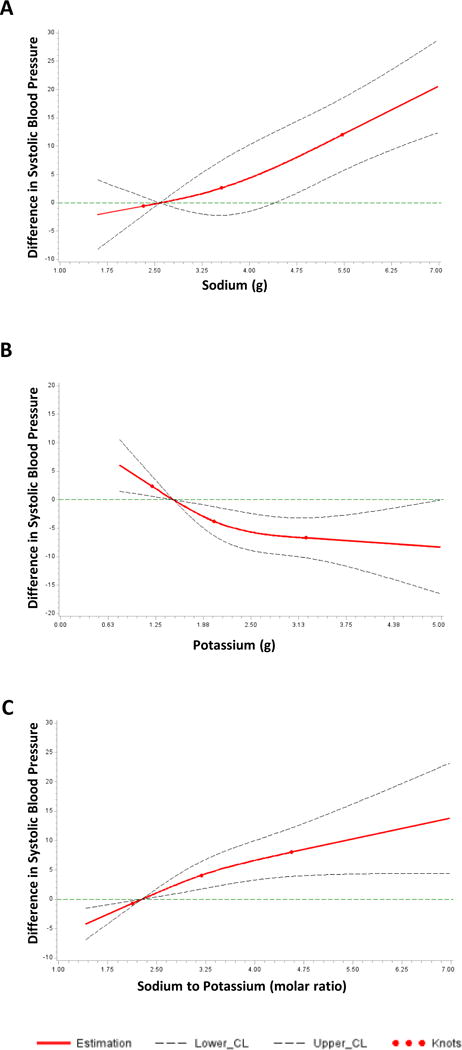
In Panel A, the y-axis shows difference in systolic blood pressure across sodium excretion values compared to a reference value of 2.58g (the midpoint of the lowest quartile). The overall association was significant (p<0.001) and the test of non-linear association was not significant (p=0.41). Panel B shows difference in systolic blood pressure across potassium excretion values compared to a reference value of 1.48g. The overall association was significant (p=0.007) and the test of non-linear association was not significant (p=0.13). Panel C shows difference in systolic blood pressure across sodium-to-potassium ratio values compared to a reference value of 2.27. The overall association was significant (p=0.006) and the test of non-linear association was not significant (p=0.28).
In fully adjusted linear regression models (Table 3), sodium excretion (per 1000 mg/day higher) was directly associated with SBP (4.58 mmHg, 95% CI 2.64, 6.51), DBP (2.25 mmHg, 95% CI 0.83, 3.67), and mid blood pressure (3.41 mmHg, 95% CI 1.97, 4.86). Potassium excretion (per 1000 mg/day higher) was inversely associated with SBP (−3.72 mmHg, 95% CI −6.01, −1.42) and mid blood pressure (−1.98 mmHg, 95% CI −3.37, −0.59). Molar sodium-to-potassium ratio (per 0.5 unit higher) was directly associated with SBP (1.72 mmHg, 95% CI 0.76, 2.68) and mid blood pressure (1.01 mmHg, 95% CI 0.31, 1.71). In the fully adjusted multivariable logistic model (Table 4), persons in the highest (Q4, 87.5th percentile) compared to lowest quartile of sodium excretion (Q1, 12.5th percentile) had 4 times greater odds of having hypertension (OR 4.22, 95% CI 1.36, 13.15).
Table 3.
Association between sodium excretion, potassium excretion, and their ratio, with blood pressure among adults aged 20–69 years, NHANES 2014.
| SBP | DBP | MidBP | |
|---|---|---|---|
| β-coefficient (95% CI) | β-coefficient (95% CI) | β-coefficient (95% CI) | |
| Sodium excretion | |||
| Adjusted for age, sex, race/ethnicity | 4.85* (2.88, 6.82) | 2.08* (0.60,3.56) | 3.47* (2.07, 4.86) |
| Fully adjusted model | 4.58* (2.64, 6.51) | 2.25* (0.83, 3.67) | 3.41* (1.97, 4.86) |
| Potassium excretion | |||
| Adjusted for age, sex, race/ethnicity | −4.21* (−6.52, −1.91) | −0.16 (−1.83,1.52) | −2.19* (−3.55, −0.82) |
| Fully adjusted model | −3.72* (−6.01, −1.42) | −0.25 (−1.91, 1.42) | −1.98* (−3.37, −0.59) |
| Sodium-to-potassium ratio | |||
| Adjusted for age, sex, race/ethnicity | 2.06* (1.06, 3.06) | 0.43 (−0.41, 1.27) | 1.24* (0.55, 1.94) |
| Fully adjusted model | 1.72* (0.76, 2.68) | 0.30 (−0.53,1.12) | 1.01* (0.31, 1.71) |
indicates p<0.01 for β-coefficient in the regression model.
β-coefficients for usual sodium and potassium indicate change in mmHg of blood pressure associated with 1000mg/d change in excretion; β-coefficient for sodium-to-potassium ratio represents change in mmHg of blood pressure associated with 0.5 unit change in molar ratio.
Mid blood pressure = (SBP + DBP)/2
Fully adjusted models included age, sex, race/ethnicity plus BMI, education, history of CVD, diabetes status, chronic kidney disease, smoking status, and physical activity. In addition, models examining sodium excretion simultaneously adjusted for potassium excretion, and vice versa.
Table 4.
Association between hypertension and sodium excretion, potassium excretion, and their ratio, among adults aged 20–69 years, NHANES 2014.
| Mid-value of Quartiles of Estimated Usual Excretion | ||||
|---|---|---|---|---|
| Q1 (12.5th percentile) OR, 95% CI |
Q2 (37.5th percentile) OR, 95% CI |
Q3 (62.5th percentile) OR, 95% CI |
Q4 (87.5th percentile) OR, 95% CI |
|
| Sodium excretion, mg/d* | 2579 | 3249 | 3819 | 4772 |
| Adjusted for age, sex, race/ethnicity | 1.0‡ | 1.62 (1.21, 2.16) | 2.51 (1.45, 4.34) | 4.85 (1.89, 12.46) |
| Fully adjusted model | 1.0‡ | 1.55 (1.10, 2.20) | 2.26 (1.19, 4.29) | 4.22 (1.36, 13.15) |
| Potassium excretion, mg/d* | 1484 | 1896 | 2336 | 3043 |
| Adjusted for age, sex, race/ethnicity | 1.0† | 0.76 (0.60, 0.96) | 0.56 (0.34, 0.92) | 0.36 (0.15, 0.87) |
| Fully adjusted model | 1.0‡ | 0.77 (0.62, 0.96) | 0.59 (0.38, 0.93) | 0.38 (0.17, 0.87) |
| Sodium-to-potassium molar ratio* | 2.27 | 2.78 | 3.28 | 3.99 |
| Adjusted for age, sex, race/ethnicity | 1.0† | 1.33 (1.08, 1.65) | 1.84 (1.17, 2.89) | 2.69 (1.29, 5.61) |
| Fully adjusted model | 1.0 | 1.27 (0.97, 1.67) | 1.61 (0.94, 2.77) | 2.26 (0.90, 5.67) |
These rows contain estimated mid-value of quartiles in the population.
indicates p<0.05 and
indicates p<0.01 for trend across percentiles of estimated usual excretion based on Satterthwaite adjusted F-test.
Fully adjusted models included age, sex, race/ethnicity, education, BMI, history of CVD, diabetes status, chronic kidney disease, smoking status, and physical activity. In addition, models examining sodium excretion simultaneously adjusted for potassium excretion, and vice versa.
Results remained robust in sensitivity analyses (eTable 1). Interactions between independent variables (sodium, potassium, or sodium-to-potassium ratio) and other model covariates were not statistically significant (data not shown) after correction for multiple comparisons. Although the interaction of sodium excretion with BMI was not significant, BMI-stratified models suggest the association of sodium and blood pressure was significant among obese but not overweight or healthy weight adults (see eTable 2).
DISCUSSION
This nationally representative cross-sectional study, using the first-ever collection of 24-hour urine in NHANES to estimate usual excretion, demonstrated a direct association between sodium excretion and multiple measures of blood pressure among US adults. Sodium-to-potassium ratio was also directly associated with SBP, while potassium excretion was inversely associated with SBP. These results are consistent with prior findings of urinary electrolyte excretion and blood pressure in other studies.25–28
The magnitude of the association between SBP and 24-hour urinary sodium excretion in the present study (4.58 mmHg higher per 1000 mg/d difference in estimated usual excretion), was much greater than previously reported using 24-hour dietary intake data (1.04 mmHg higher per 1000mg/d difference in estimated usual intake) from NHANES 2005–2010.29 Compared to self-reported dietary intake data, urinary sodium excretion does not depend on the accuracy of self-report or food composition tables, and 90–95% of ingested sodium is excreted through urine.2 In addition, dietary methods, which can be affected by self-report and nutrient coding errors, often fail to capture salt added in preparation (cooking) or at the table and some may not capture non-food sources of sodium such as supplements and antacids, medications, or tap water.30 Such sources of measurement error in dietary studies may weaken the observed associations.
Similarly, the magnitude of the association between SBP and potassium excretion also appears larger in the present study (−3.72 mmHg lower per 1000mg/d difference in estimated usual excretion) compared to a prior investigation using dietary intake data from NHANES 2005–2010 (−1.24 mmHg lower per 1000mg/d difference in estimated usual intake).29 However, the present study found that sodium excretion was significantly associated with DBP but potassium excretion was not. This may be due to greater within-individual variability in urinary potassium vs. sodium excretion as a measure of intake. Approximately 77–90% of potassium consumed is excreted in urine, compared to 90–95% of sodium,2 and the fraction of potassium excreted in urine varies between individuals and may be affected by race and medications.2, 31
Our findings are subject to the following limitations. First, the results are subject to potential selection bias, given that the response rate for the 24-hour urine collection was 50% (75% of 66%). Although sample weights for the 24-hour urine collection were adjusted for non-response, differences between respondents and non-respondents could reduce generalizability. Second, while 24-hour urinary excretion is considered the gold standard for estimated sodium intake, imperfect collection can under- or over-estimate excretion. For example, missed voids may result in under-estimates, or collection beyond 24-hour may result in over-estimates. To minimize this error, NHANES did not analyze samples that were collected for less than 22 hours and the longest collection time analyzed was 27.1 hours; adjusted 24-hour urine volume was used to estimate usual sodium and potassium excretion. In addition, we performed sensitivity analyses restricted to persons with complete collections based on creatinine criteria for completeness,24 and results remained robust. Third, due to the cross-sectional design of NHANES and lack of temporality, causality cannot be inferred from these data. Fourth, 24-hour urine was collected on only up to two days, 3–10 days apart, which could have diminished the observed associations with blood pressure due to random measurement error.13 Fifth, although a broad set of covariates were included in regression models, unmeasured confounding by additional factors could also play a role. Sixth, antihypertensive medications containing diuretics can impact sodium and potassium excretion, which could confound results. Among participants who reported taking antihypertensive medications, information was not available regarding medication type, so diuretic use could not be included specifically in multivariable models. However, results remained consistent in sensitivity analyses restricted to persons who reported not taking any antihypertensive medications. Finally, only 32 participants had estimated usual sodium excretion ≤2300 mg/day, so we were unable to examine this group separately to study the sodium and blood pressure relationship among persons meeting the 2015–2020 Dietary Guidelines for Americans recommendation of consuming <2300 mg sodium/day.
In conclusion, based on this cross-sectional analysis, we observed a linear, dose-response association between 24-hour sodium excretion and hypertension among US adults, and an inverse association between potassium excretion and hypertension. These associations were independent of numerous covariates in a large, diverse sample of adults. These cross-sectional findings using gold-standard assessment methods, when added to the evidence base from longitudinal and interventional studies, support dietary advice to lower sodium intake and increase consumption of potassium-containing foods as part of a healthy dietary pattern as recommended in the 2015–2020 Dietary Guidelines for Americans. A dietary pattern high in potassium, such as the Dietary Approaches to Stop Hypertension (DASH) diet which focuses on vegetables, fruits, whole grains, low fat dairy and lean protein, in combination with a low-sodium diet, had greater blood pressure lowering effects than either dietary approach alone.32 Advice from doctors and other health care professionals about sodium reduction is associated with action to reduce sodium intake.33 The health impact of individual and population-level strategies to increase potassium intake merits further research. Recommended public health strategies for sodium reduction focus on reducing the primary source of sodium in the US diet, salt added to commercially processed and prepared foods.34–36 Continued monitoring of the related health impact of such strategies is essential given that even small reductions in population sodium intake are projected to prevent thousands of deaths due to heart disease and stroke and save billions of dollars in health care costs annually.37
Supplementary Material
Clinical Perspective.
What is new?
This study reports associations between usual sodium, potassium, and blood pressure using gold-standard 24-hour urinary data, collected for the first time among a nationally representative sample of adults in the United States.
There is a strong, direct relationship between higher sodium excretion and higher blood pressure and hypertension.
In addition, there was an inverse relationship between potassium excretion and blood pressure and hypertension.
What are the clinical implications?
Hypertension is a key modifiable risk factor for cardiovascular disease, the leading cause of morbidity and mortality in the US.
When added to the evidence base from longitudinal and interventional studies, these results support clinicians’ dietary advice to lower sodium intake and increase consumption of potassium-containing foods.
The findings also support recommendations by clinicians to reduce sodium in combination with consuming a dietary pattern that is high in potassium, such as the Dietary Approaches to Stop Hypertension (DASH) diet, to help achieve a greater blood pressure lowering effect.
Acknowledgments
The findings and conclusions expressed in this manuscript are those of the authors and do not necessarily represent the official position of the Centers for Disease Control and Prevention or the views of the National Heart, Lung, and Blood Institute, the National Institutes of Health, or the U.S. Department of Health and Human Services.
Funding Sources
None
Footnotes
Conflict of Interest Disclosures
None
References
- 1.Benjamin EJ, Blaha MJ, Chiuve SE, Cushman M, Das SR, Deo R, de Ferranti SD, Floyd J, Fornage M, Gillespie C, Isasi CR, Jiménez MC, Jordan LC, Judd SE, Lackland D, Lichtman JH, Lisabeth L, Liu S, Longenecker CT, Mackey RH, Matsushita K, Mozaffarian D, Mussolino ME, Nasir K, Neumar RW, Palaniappan L, Pandey DK, Thiagarajan RR, Reeves MJ, Ritchey M, Rodriguez CJ, Roth GA, Rosamond WD, Sasson C, Towfighi A, Tsao CW, Turner MB, Virani SS, Voeks JH, Willey JZ, Wilkins JT, Wu JH, Alger HM, Wong SS, Muntner P. Heart Disease and Stroke Statistics—2017 Update: A Report From the American Heart Association. Circulation. 2017:e16–e458. doi: 10.1161/CIR.0000000000000485. [DOI] [PMC free article] [PubMed] [Google Scholar]
- 2.Institute of Medicine. Dietary Reference Intakes for Water, Potassium, Sodium, Chloride, and Sulfate. Washington, D.C.: THE NATIONAL ACADEMIES PRESS; 2005. pp. 269–397. [Google Scholar]
- 3.Cook NR, Cutler JA, Obarzanek E, Buring JE, Rexrode KM, Kumanyika SK, Appel LJ, Whelton PK. Long term effects of dietary sodium reduction on cardiovascular disease outcomes: observational follow-up of the trials of hypertension prevention (TOHP) Br Med J. 2007;334:885–888. doi: 10.1136/bmj.39147.604896.55. [DOI] [PMC free article] [PubMed] [Google Scholar]
- 4.He FJ, MacGregor GA. A comprehensive review on salt and health and current experience of worldwide salt reduction programmes. J Hum Hypertens. 2009;23:363–384. doi: 10.1038/jhh.2008.144. [DOI] [PubMed] [Google Scholar]
- 5.Aburto NJ, Hanson S, Gutierrez H, Hooper L, Elliott P, Cappuccio FP. Effect of increased potassium intake on cardiovascular risk factors and disease: systematic review and meta-analyses. BMJ. 2013;346:f1378. doi: 10.1136/bmj.f1378. [DOI] [PMC free article] [PubMed] [Google Scholar]
- 6.Perez V, Chang ET. Sodium-to-potassium ratio and blood pressure, hypertension, and related factors. Adv Nutr. 2014;5:712–741. doi: 10.3945/an.114.006783. [DOI] [PMC free article] [PubMed] [Google Scholar]
- 7.Mercado CI, Cogswell ME, Valderrama AL, Wang CY, Loria CM, Moshfegh AJ, Rhodes DG, Carriquiry AL. Difference between 24-h diet recall and urine excretion for assessing population sodium and potassium intake in adults aged 18-39 y. Am J Clin Nutr. 2015;101:376–386. doi: 10.3945/ajcn.113.081604. [DOI] [PMC free article] [PubMed] [Google Scholar]
- 8.Moshfegh AJ, Rhodes DG, Baer DJ, Murayi T, Clemens JC, Rumpler WV, Paul DR, Sebastian RS, Kuczynski KJ, Ingwersen LA, Staples RC, Cleveland LE. The US Department of Agriculture Automated Multiple-Pass Method reduces bias in the collection of energy intakes. Am J Clin Nutr. 2008;88:324–332. doi: 10.1093/ajcn/88.2.324. [DOI] [PubMed] [Google Scholar]
- 9.Cook NR, Kumanyika SK, Cutler JA. Effect of change in sodium excretion on change in blood pressure corrected for measurement error. The Trials of Hypertension Prevention, Phase I. Am J Epidemiol. 1998;148:431–444. doi: 10.1093/oxfordjournals.aje.a009668. [DOI] [PubMed] [Google Scholar]
- 10.Andersen S, Karmisholt J, Pedersen KM, Laurberg P. Reliability of studies of iodine intake and recommendations for number of samples in groups and in individuals. Br J Nutr. 2008;99:813–818. doi: 10.1017/S0007114507842292. [DOI] [PubMed] [Google Scholar]
- 11.Freedman LS, Commins JM, Moler JE, Willett W, Tinker LF, Subar AF, Spiegelman D, Rhodes D, Potischman N, Neuhouser ML, Moshfegh AJ, Kipnis V, Arab L, Prentice RL. Pooled results from 5 validation studies of dietary self-report instruments using recovery biomarkers for potassium and sodium intake. Am J Epidemiol. 2015;181:473–487. doi: 10.1093/aje/kwu325. [DOI] [PMC free article] [PubMed] [Google Scholar]
- 12.Espeland MA, Kumanyika S, Wilson AC, Reboussin DM, Easter L, Self M, Robertson J, Brown WM, McFarlane M. Statistical issues in analyzing 24-hour dietary recall and 24-hour urine collection data for sodium and potassium intakes. Am J Epidemiol. 2001;153:996–1006. doi: 10.1093/aje/153.10.996. [DOI] [PubMed] [Google Scholar]
- 13.Sun Q, Bertrand KA, Franke AA, Rosner B, Curhan GC, Willett WC. Reproducibility of urinary biomarkers in multiple 24-h urine samples. Am J Clin Nutr. 2016 doi: 10.3945/ajcn.116.139758. doi: 10.3945. [DOI] [PMC free article] [PubMed] [Google Scholar]
- 14.Terry AL, Cogswell ME, Wang CY, Chen TC, Loria CM, Wright JD, Zhang X, Lacher DA, Merritt RK, Bowman BA. Feasibility of collecting 24-h urine to monitor sodium intake in the National Health and Nutrition Examination Survey. Am J Clin Nutr. 2016;104:480–488. doi: 10.3945/ajcn.115.121954. [DOI] [PMC free article] [PubMed] [Google Scholar]
- 15.National Center for Health Statistics (NCHS) National Health and Nutrition Examination Survey (NHANES), 24-Hour Urine Study Procedures Manual. Centers for Disease Control and Prevention; 2014. Accessed on October 20, 2016. https://www.cdc.gov/nchs/data/nhanes/nhanes_13_14/24_Hour_Urine_Study_Procedures_Manual.pdf. [Google Scholar]
- 16.National Center for Health Statistics (NCHS) National Health and Nutrition Examination Survey (NHANES) 2013–2014. Centers for Disease Control and Prevention; Accessed on September 22, 2017. https://wwwn.cdc.gov/nchs/nhanes/continuousnhanes/default.aspx?BeginYear=2013. [Google Scholar]
- 17.National Center for Health Statistics (NCHS) NHANES 2013–2014 Non-Public Data. Centers for Disease Control and Prevention; Accessed on September 22, 2017. https://wwwn.cdc.gov/nchs/nhanes/search/datapage.aspx?Component=Non-Public&CycleBeginYear=2013. [Google Scholar]
- 18.National Center for Health Statistics (NCHS) National Health and Nutrition Examination Survey (NHANES) 2013–2014 Physician Examination Procedures Manual. Centers for Disease Control and Prevention; 2013. Accessed on Oct 20, 2016. https://www.cdc.gov/nchs/data/nhanes/nhanes_13_14/Phys_Exam_Manual_2013.pdf. [Google Scholar]
- 19.Prospective Studies Collaborative. Age-specific relevance of usual blood pressure to vascular mortality: a meta-analysis of individual data for one million adults in 61 prospective studies. Lancet. 2002;360:1903–1913. doi: 10.1016/s0140-6736(02)11911-8. [DOI] [PubMed] [Google Scholar]
- 20.Dodd KW, Guenther PM, Freedman LS, Subar AF, Kipnis V, Midthune D, Tooze JA, Krebs-Smith SM. Statistical methods for estimating usual intake of nutrients and foods: a review of the theory. J Am Diet Assoc. 2006;106:1640–1650. doi: 10.1016/j.jada.2006.07.011. [DOI] [PubMed] [Google Scholar]
- 21.National Cancer Institute. Usual Dietary Intakes. National Institutes of Health; 2015. Accessed on October 5 2017. https://epi.grants.cancer.gov/diet/usualintakes/ [Google Scholar]
- 22.Levey AS, Stevens LA, Schmid CH, Zhang YL, Castro AF, 3rd, Feldman HI, Kusek JW, Eggers P, Van Lente F, Greene T, Coresh J. A new equation to estimate glomerular filtration rate. Ann Intern Med. 2009;150:604–612. doi: 10.7326/0003-4819-150-9-200905050-00006. [DOI] [PMC free article] [PubMed] [Google Scholar]
- 23.Desquilbet L, Mariotti F. Dose-response analyses using restricted cubic spline functions in public health research. Stat Med. 2010;29:1037–1057. doi: 10.1002/sim.3841. [DOI] [PubMed] [Google Scholar]
- 24.John KA, Cogswell ME, Campbell NR, Nowson CA, Legetic B, Hennis AJ, Patel SM. Accuracy and Usefulness of Select Methods for Assessing Complete Collection of 24-Hour Urine: A Systematic Review. J Clin Hypertens (Greenwich) 2016;18:456–467. doi: 10.1111/jch.12763. [DOI] [PMC free article] [PubMed] [Google Scholar]
- 25.Intersalt Cooperative Research Group. Intersalt: an international study of electrolyte excretion and blood pressure. Results for 24 hour urinary sodium and potassium excretion. Br Med J. 1988;297:319–328. doi: 10.1136/bmj.297.6644.319. [DOI] [PMC free article] [PubMed] [Google Scholar]
- 26.Liu L, Ikeda K, Yamori Y. Twenty-four hour urinary sodium and 3-methylhistidine excretion in relation to blood pressure in Chinese: results from the China-Japan cooperative research for the WHO-CARDIAC Study. Hypertens Res. 2000;23:151–157. doi: 10.1291/hypres.23.151. [DOI] [PubMed] [Google Scholar]
- 27.Hedayati SS, Minhajuddin AT, Ijaz A, Moe OW, Elsayed EF, Reilly RF, Huang CL. Association of urinary sodium/potassium ratio with blood pressure: sex and racial differences. Clin J Am Soc Nephrol. 2012;7:315–322. doi: 10.2215/CJN.02060311. [DOI] [PMC free article] [PubMed] [Google Scholar]
- 28.Mente A, O’Donnell MJ, Rangarajan S, McQueen MJ, Poirier P, Wielgosz A, Morrison H, Li W, Wang X, Di C, Mony P, Devanath A, Rosengren A, Oguz A, Zatonska K, Yusufali AH, Lopez-Jaramillo P, Avezum A, Ismail N, Lanas F, Puoane T, Diaz R, Kelishadi R, Iqbal R, Yusuf R, Chifamba J, Khatib R, Teo K, Yusuf S. Association of Urinary Sodium and Potassium Excretion with Blood Pressure. N Engl J Med. 2014;371:601–611. doi: 10.1056/NEJMoa1311989. [DOI] [PubMed] [Google Scholar]
- 29.Zhang Z, Cogswell ME, Gillespie C, Fang J, Loustalot F, Dai S, Carriquiry AL, Kuklina EV, Hong Y, Merritt R, Yang Q. Association between usual sodium and potassium intake and blood pressure and hypertension among U.S. adults: NHANES 2005-2010. PLoS One. 2013;8:e75289. doi: 10.1371/journal.pone.0075289. [DOI] [PMC free article] [PubMed] [Google Scholar]
- 30.Cogswell ME, Maalouf J, Elliott P, Loria CM, Patel S, Bowman BA. Use of Urine Biomarkers to Assess Sodium Intake: Challenges and Opportunities. Annu Rev Nutr. 2015;35:349–387. doi: 10.1146/annurev-nutr-071714-034322. [DOI] [PMC free article] [PubMed] [Google Scholar]
- 31.Turban S, Miller ER, Ange B, Appel LJ. Racial Differences in Urinary Potassium Excretion. J Am Soc Nephrol. 2008;19:1396–1402. doi: 10.1681/ASN.2007101142. [DOI] [PMC free article] [PubMed] [Google Scholar]
- 32.Sacks FM, Svetkey LP, Vollmer WM, Appel LJ, Bray GA, Harsha D, Obarzanek E, Conlin PR, Miller ER, 3rd, Simons-Morton DG, Karanja N, Lin PH. Effects on blood pressure of reduced dietary sodium and the Dietary Approaches to Stop Hypertension (DASH) diet. DASH-Sodium Collaborative Research Group. N Engl J Med. 2001;344:3–10. doi: 10.1056/NEJM200101043440101. [DOI] [PubMed] [Google Scholar]
- 33.Jackson SL, Coleman King SM, Park S, Fang J, Odom EC, Cogswell ME. Health Professional Advice and Adult Action to Reduce Sodium Intake. Am J Prev Med. 2016;50:30–39. doi: 10.1016/j.amepre.2015.04.034. [DOI] [PMC free article] [PubMed] [Google Scholar]
- 34.Mattes RD, Donnelly D. Relative contributions of dietary sodium sources. J Am Coll Nutr. 1991;10:383–393. doi: 10.1080/07315724.1991.10718167. [DOI] [PubMed] [Google Scholar]
- 35.Institute of Medicine (US) Committee on Strategies to Reduce Sodium Intake. Strategies to Reduce Sodium Intake in the United States 2010. National Academies Press; US: Accessed on August 9, 2017. https://www.ncbi.nlm.nih.gov/books/NBK50956/ [PubMed] [Google Scholar]
- 36.US Food and Drug Administration. Draft Guidance for Industry: Voluntary Sodium Reduction Goals: Target Mean and Upper Bound Concentrations for Sodium in Commercially Processed, Packaged, and Prepared Foods. US Dept of Health and Human Services; 2016. Accessed on September 2, 2016. http://www.fda.gov/Food/GuidanceRegulation/GuidanceDocumentsRegulatoryInformation/ucm494732.htm. [Google Scholar]
- 37.Bibbins-Domingo K, Chertow GM, Coxson PG, Moran A, Lightwood JM, Pletcher MJ, Goldman L. Projected Effect of Dietary Salt Reductions on Future Cardiovascular Disease. N Engl J Med. 2010;362:590–599. doi: 10.1056/NEJMoa0907355. [DOI] [PMC free article] [PubMed] [Google Scholar]
Associated Data
This section collects any data citations, data availability statements, or supplementary materials included in this article.