

Abstract
Objective
The traditional fee-for-service approach to healthcare can lead to the management of a patient’s conditions in a siloed manner, inducing various negative consequences. It has been recognized that a bundled approach to healthcare - one that manages a collection of health conditions together - may enable greater efficacy and cost savings. However, it is not always evident which sets of conditions should be managed in a bundled manner. In this study, we investigate if a data-driven approach can automatically learn potential bundles.
Methods
We designed a framework to infer health condition collections (HCCs) based on the similarity of their clinical workflows, according to electronic medical record (EMR) utilization. We evaluated the framework with data from over 16,500 inpatient stays from Northwestern Memorial Hospital in Chicago, Illinois. The plausibility of the inferred HCCs for bundled care was assessed through an online survey of a panel of five experts, whose responses were analyzed via an analysis of variance (ANOVA) at a 95% confidence level. We further assessed the face validity of the HCCs using evidence in the published literature.
Results
The framework inferred four HCCs, indicative of 1) fetal abnormalities, 2) late pregnancies, 3) prostate problems, and 4) chronic diseases, with congestive heart failure featuring prominently. Each HCC was substantiated with evidence in the literature and was deemed plausible for bundled care by the experts at a statistically significant level.
Conclusions
The findings suggest that an automated EMR data-driven framework conducted can provide a basis for discovering bundled care opportunities. Still, translating such findings into actual care management will require further refinement, implementation, and evaluation.
Keywords: Workflow, Clinical phenotyping, Network analysis, Data mining, Electronic medical record, Topic modeling, Phenotype clusters, Bundled care
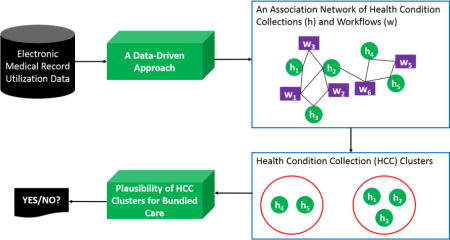
Graphical abstract
Introduction
Under a fee-for-service healthcare model, each of a patient’s conditions is managed relatively independently [1–2]. This approach to care can lead to several problems, including delays in (or failure to deliver) service, testing and treatment redundancies, and increased costs for healthcare organizations (HCOs) and patients. In turn, these problems can lead to declines in quality, patient satisfaction, and cost effectiveness [3]. It is anticipated that a shift from fee-for-service to pay-for-value has the potential to resolve, or at least reduce the severity of, many of these problems [4–5]. To realize this alternative vision, HCOs are migrating towards a bundled care model, which is a middle ground between F4S and capitation reimbursement that aims to account for the interplay between various health conditions, rather than focus on each in isolation [6–7].
There are numerous challenges in realizing bundled care. Two of the more pressing are: 1) it is not always evident which health condition collections (HCCs) are appropriate for such a care model and 2) the cost of refining current healthcare systems to support bundled care should be minimized. While HCOs already manage certain complex health needs of patients (e.g., management of comorbidities when treating the primary health problem), such routines often arise in an ad hoc fashion and are not formalized. As such, there is an opportunity to design a data-driven approach to learn HCCs, which are, or could be, ripe for bundling. A data-driven approach may be further beneficial because, if models are based on the current activities of healthcare professionals, then HCOs could minimize implementation costs for newly established, or the formalization of existing, management routines.
Towards this goal, there is growing evidence that data derived from electronic medical records (EMRs) can be mined to discover associations between health problems [8–14], infer clinical phenomena [15–18], and model healthcare workflow patterns [19–23]. More recently, it has been shown that the relationship between health problems and workflows can be specialized for certain phenomena, such as congestive heart failure [24]. In this paper, we build on such observations and introduce an automated learning framework to discover more general HCCs, which share similar workflows according to the utilization records of an EMR system. We hypothesize that such HCCs could be bundled and managed together based on their shared workflows.
In this paper, we report on how we accomplished this goal by designing a data-driven framework that relies upon a generative topic modeling strategy to infer an association network between HCCs and workflows. We applied a community detection algorithm to infer HCC clusters via the association network. We evaluated this framework with four months of inpatient data (over 16,500 inpatient stays) from Northwestern Memorial Hospital (NMH) and confirmed the plausibility of inferred HCC clusters through an online survey with administrative and clinical experts. We further demonstrated the face validity of HCC clusters through evidence in the published literature.
Background
The past several years have witnessed a number of investigations both expert- and data-driven, into modeling and characterizing clinical phenotypes and workflows. However, there has been limited research into automatically establishing relationships between these phenomena. In this section, we review representative expert and data-driven methodologies and illustrate their relationship with our own approach.
Phenotyping Algorithms
Phenotyping aims to use EMR data to detect phenotypes of clinical interest. There has been a flurry of activity in various learning methods for high-throughput phenotyping over the past several years. There are two typical phenotyping algorithms: expert- and data-driven, the latter of which can be further partitioned into supervised and unsupervised techniques.
Expert-driven methods leverage rules developed by experts to identify phenotypes. These methods require substantial manual effort from domain experts. For instance, Kho et. al. developed rule-based phenotyping algorithms to identify subjects for five primary phenotypes (e.g., type 2 diabetes) to support further analysis in genomic association studies [61–62]. Their phenotyping algorithms were developed based on the analysis of EMR data and criteria managed by the Centers for Disease Control and Prevention.
Supervised data-driven phenotyping requires domain experts to exert a substantial of human manual effort to label cases (i.e., phenotypically positive individuals) and controls (i.e., phenotypically negative individuals) and then train and calibrate classifiers. For each new patient record, the classifiers can determine their class label (e.g., case versus control) according to their features. The NIH-sponsored Electronic Medical Records and Genomics (eMERGE) [51] consortium, a network of academic medical centers, has developed a variety of supervised phenotyping algorithms [15–16, 52–54]. For instance, Chen et. al. designed a supervised learning algorithm to detect rheumatoid arthritis, colorectal cancer, and venous thromboembolism [52]. Additionally, Zheng et. al. developed a machine learning algorithm to identify type 2 diabetes from EMR data [18].
Unsupervised data-driven phenotyping does not require manual chart review, but instead automatically clusters phenotypes or subtypes [17, 24, 26, 55–56]. The challenge for this type of learning is in the validation of the discovered phenotypes or subtypes. Specifically, there is no clear ground truth for the phenotypes or subtypes that are identified through such an approach. A traditional approach to evaluate the learned phenotypes is to involve clinical and administrative experts to let them review their plausibility [17, 64]. For instance, Ho et. al developed a tensor factorization model to automatically identify phenotypes for several major diseases (e.g., metabolic syndrome) from EMR data and, subsequently, recruited expert respondents to review their plausibility. Additionally, Chen et. al. developed a unsupervised learning algorithm to infer phenotypes from EMR data coming from two distinct healthcare systems and validated the similarity, stability and transferability of the learned phenotypes [26].
Workflow Modeling Algorithms
Workflow modeling algorithms can be grossly categorized into two types: i) observational and ii) data-driven.
Observational studies often rely on manual data collection approaches, such as observations and interviews. One such example was presented by Unertl and colleagues [63], which analyzed direct observations and interviews in hospitals to understand workflow and information flow in the care of chronic diseases. Data-driven algorithms, by contrast, have been proposed to infer clinical pathway patterns through the activity logs of healthcare systems [24–25, 57–59]. Almost all of these approaches followed a similar style: i) infer workflow patterns, then ii) evaluate the effectiveness of the methods in a clinical case study. For instance, Bouarfa et. al. derived a workflow consensus from clinical activity logs to detect outlying workflows without prior knowledge from experts [57]. They adopted a tree-guided multiple sequence alignment approach to model the consensus of workflows. This strategy was validated over the workflow processes associated with laparoscopic cholecystectomy, where the results indicated the derived consensus conforms to the main steps of the surgical procedure as described in best practice guidelines. In another example, Chen et. al. introduced an altered latent Dirichlet allocation (LDA) based framework to infer clinical workflows through the utilization of an EMR [25] and applied such framework to infer 8 different types of workflows for heart failure patients [24].
To date, phenotyping and workflow modeling algorithms have been developed independently. While there has been little investigation into relating these concepts together, this is vital to the establishment of effective care coordination strategy [60].
Research Design and Methods
The framework for relating phenotypes and workflows is generally composed of four parts: i) a workflow inference module, which is based on the electronically documented actions of EMR users, ii) a HCC inference module, based on patient-specific clinical phenomena indicated in an EMR (e.g., diagnosis codes), iii) an association module, which constructs the association network of HCCs and workflows, and then infer HCC clusters according to the similarity in their workflow patterns and iv) an evaluation module, which consists of online surveys from administrative and clinical experts to determine if the HCC clusters are worthy of consideration for bundling.
We begin with a high-level overview of the models and then proceed with a deeper dive into each component. The general relationships between the workflow module, HCC model and association modeling algorithm are depicted in Figure 1.
Figure 1.
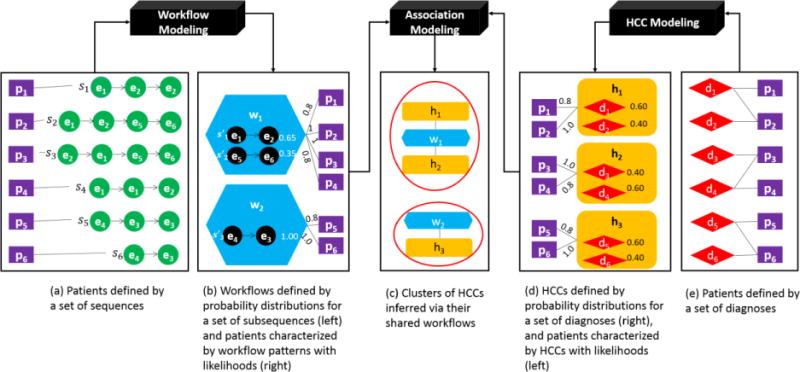
A high-level architecture for discovering associations between clinical workflows and HCCs, which are further leveraged to infer HCC clusters. (Legend: e = action event, p = EMR patient, d = diagnosis, HCC = Health condition collection, s = action sequence, s′ = action subsequence and w = workflow)
Here, we take a moment to formalize the environment. Let P = {p1, p2, ⋯, pn} be the set of patients, S = {s1, s2, ⋯, sn} be the set of action sequences (issued by approved EMR users) and D = {d1, d2, ⋯, dl} be the set of clinical phenomena (e.g., diagnosis codes). Each patient hi in H is defined as a sequence si in S (as shown in Figure 1a) and a collection of clinical phenomena in D, as shown in Figure 1e. The set of workflows W = {w1, w2, ⋯, wk} (Figure 1b-left) and HCCs HCCs = {h1, h2, ⋯, hq} (Figure 1d-right) are learned from S and D, respectively. Specifically, a workflow wi is defined as a probability distribution over a set of subsequences in S′ = {s′1, s′2, ⋯, s′q} (Figure 1b-left). s′i is defined as a subsequence that frequently occurs across the sequences in S. An HCC hj is a probability distribution over a set of diagnoses (e.g., Figure 1d-right depicts three HCCs).
A patient is explained by their affinity to workflows and HCCs through φW (Figure 1b-right) and φH (Figure 1d-left), respectively. For instance, as shown in Figure 1b-right, workflow w1 has a probability of 0.8 of explaining the affinity between the sequence for patient p1 and w1. The strength of association between a workflow and an HCC is measured via the set of patients in common they explain. The HCC clusters are inferred via the association network that was established between the HCCs and workflows (as shown in Figure 1c).
To focus on the knowledge learned from the EMR, we relied on existing inference algorithms to learn workflows and HCCs. For orientation, we provide two examples as shown in Figure 2 and 3 to illustrate how the algorithms work, but refer the reader to [25] and [26] for a more detailed description.
Figure 2.
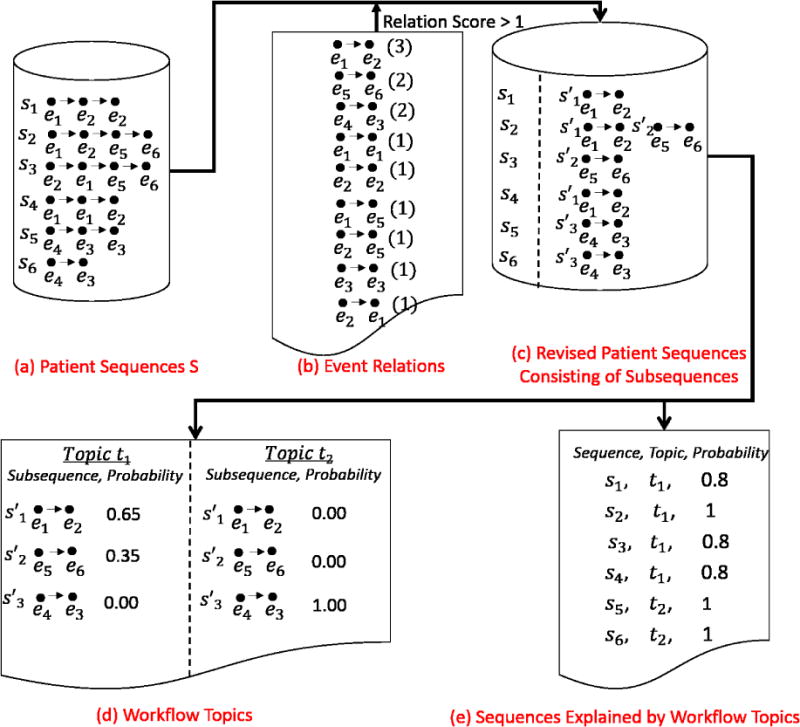
The process by which workflows are generated from patient sequences. The input is the patient sequences (see a), and the outputs are the topics (workflows) (see d) and the explanations between the patient sequences and the topics (see e).
Figure 3.
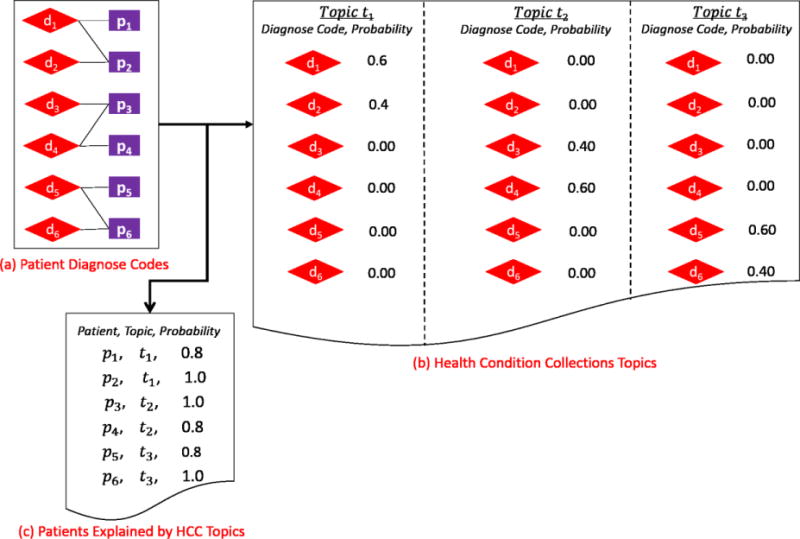
The process by which HCCs topics are generated from patients’ diagnoses. The input is the patient diagnosis codes (see a), and the outputs are HCC topics (see b) and explanations between the topics and the patient diagnoses (see c).
Workflow Inference Algorithm
The workflow inference algorithm [25] learns topics, W = {w1, w2, ⋯, wk}from the sequences in S via a modified LDA algorithm [27–28]. S is a set of patient sequences. Each patient sequence was revised to retain the strong event relations and filter out the weak event relations. The strength of an event relation is measured as the number of times the relation appearing in patient sequences S. As shown in Figure 2, if we remove event relations with scores less than a threshold of 2, then s3 = e2 → e1 → e5 → e6 (e.g., both e2 → e1 and e1 → e5 have a score of 1) will be revised to s3 = e5 → e6. Each revised sequence is made up of subsequences, each of which is a series of events with strong relations between neighbors. For instance, s2 = e1 → e2 → e5 → e6 was revised to consist of two subsequences: s′1 = e1 → e2 and s′2 = e5 → e6. Briefly, the set of workflow topics is inferred from a matrix R|P|×|S′|. Here, R|P|×|S′|(i, j) corresponds to the number of times a subsequence s′j was in a patient sequence si. Each workflow topic is represent by a set of subsequences with their corresponding probabilities. For instance, as shown in Figure 2, the algorithm inferred two workflow topics. The first topic t1 consists of two subsequences e1 → e2 and e5 → e6, and the second topic t2 consists of one subsequence e4 → e3. φW corresponds to a matrix of the likelihoods that the patients’ sequences in S are explained by the topics in W. As shown in Figure 2, the first two patient sequences are explained by topic t1, while the last two patient sequences are explained by topic t2.
It is often the case that the fitness of an LDA model, and thus the number of topics k, is determined through an information theoretic measure, such as perplexity [27–28]. However, in our situation, we aim to determine the value that maximizes the separation between the workflow topics, which are more semantically meaningful. As such, we calibrate k by setting it to the value that minimizes the average covariance between the workflow topics.
HCC Modeling Algorithm
The HCC modeling algorithm [26] also learns topics HCCs = {h1, h2, …, hq} via a modified LDA method as well. Briefly, the set of topics is inferred from a matrix R|P|×|D|. Here, R|p|×|D|(i, j) corresponds to the number of times that diagnosis code dj was assigned to patient pi. Figure 3 depicts an example of three topics. Each topic is represented by a collection of diagnosis codes. For instance, as shown in Figure 3b, topic t1 consists of d1 and d2, t2 consists of d3 and d4, and t3 consists of d5 and d6. φh is a matrix of the likelihoods that patients are explained by the topics. Figure 3c depicts an example of the probabilities that the patients’ conditions are explained by topics in the form of HCCs. We use the same strategy invoked for workflow topics to set the number of topics for HCCs, which we denote as q.
Measuring Associations
Each workflow and phenotypic topic is leveraged to explain the patients (Figure 2 and Figure 3). We use the patients they explain in common to measure their association. Specifically, the degree of association between a workflow topic wi and an HCC topic hj is measured as the cosine of their respective vectors:
| (1) |
where φW(i)is a vector indicating the distribution of probabilities that a workflow topic wi explains each patient. For instance, as shown in Figure 2e, the first workflow explains four patients with the following vector of probabilities (〈p1, 0.8〉, 〈p2, 1〉, 〈p3, 0.8〉, 〈p4, 0.8〉). Similarly, φH(j) is a vector specifying the distribution of probabilities that a phenotypic topic hj explains each patient. For instance, as shown in Figure 3c, the first HCC topic explains four patients with a vector of probabilities (〈p1, 0.8〉, 〈p2, 1.0〉, 〈p3, 0〉, 〈p4, 0〉). According to Equation (1), the cosine similarity between the first workflow and HCC topic Cosine(w1, h1) is 0.7494.
Our goal is to infer HCC clusters that share workflows because we anticipate that each cluster is a candidate for bundled care management. Thus, we use a community detection algorithm [29] to infer HCC clusters via the association network of HCCs and workflows. We guide the algorithm using a heuristic that is based on the optimization of the modularity measure [30], which is efficient (in running time) and effective (in quality of communities) for weighted and undirected graphs. Modularity is defined as:
| (2) |
where m is the number edges in the network, kv, kw is the degree of vertex v and w respectively, Avw = 1 means there is an edge between the two vertices and Svr is defined as 1 if vertex v belongs to group r and zero otherwise. Clusters with high modularity have dense connectivity within HCCs, as well as workflows within clusters, but sparse connectivity between clusters.
Plausibility Evaluation for Bundled Care
We investigated if the HCC clusters are potential candidates for bundled care management. To do so, we designed a survey that consisted of paired 〈inferred, random〉 HCC clusters that we provided to administrative and clinical experts for review. We did not indicate which cluster was inferred or which was randomly generated to the experts. Each inferred HCC topic was represented as the list of diagnoses that exhibited the largest probabilities for a specific topic. A random cluster was generated by selecting a number of HCC topics at random, the number of which was set equal to the number of HCC topics within the inferred cluster. Each random topic was also represented as a list of diagnoses. Each random cluster contained the same number of diagnoses as its inferred counterpart.
We recruited a set of experts to answer questions of the following form, “To what extent do you believe health conditions in the displayed group can be managed in a bundled way?” For each question, we provided five candidate answers (in the form of Not At All Likely, Slightly Likely, Moderately Likely, Very Likely and Completely Likely). To perform hypothesis testing, we converted these answers into values in the range 0 to 1 (e.g., Not = 0, Slightly = 0.25, Moderately = 0.5, Very = 0.75, and Completely = 1). Further details about the survey design, including the specific questions, are provided in online Appendix A.
Given the responses, we conducted a series of formal hypothesis tests, each of which can be summarized as: “For a given pair of 〈inferred, random〉 clusters of health conditions, experts can distinguish the inferred from the random in terms of bundled care”. We applied a linear regression model and analysis of variance (ANOVA) [31] to test the significance of difference at the 95% confidence level.
To achieve a power of 0.8 with a standard deviation of 0.4 in the difference in experts’ scores for inferred and random clusters, the required sample size was five respondents. As such, we invited five knowledgeable professionals with a diverse array of expertise, including HCO management, internal medicine, and emergency care. Each participant was emailed an introduction to the goals of the research and a link to access a REDCap survey [32]. The response rate was 100% because all respondents agreed to participate in the survey beforehand.
Experimental Design
Dataset
This study focused on four months of inpatient EMR data from Northwestern Memorial Hospital (NMH) during 2013. In this data, an event corresponds to an instance of an EMR access and is represented as a 〈role, patient〉 pair, which indicates an HCO employee affiliated with the role had an access event on the patient’s records. We rely on the employee’s role, as opposed to the employee themselves, to represent the access events because the role has been shown to be more stable to represent clinical workflow [64]. There were 1,138,317 access events distributed over 16,569 patient encounters. Additionally, each patient was associated with a set of ICD-9 codes assigned after discharge from the hospital. The EMRs contained 144 unique roles and 4,543 unique ICD-9 codes.
In recognition of the fact that multiple ICD-9 codes may be applied to describe the same clinical phenomena [33–34], various phenotyping investigations (e.g., [35–36]) have adopted alternative vocabularies for the secondary analysis of EMRs, such as the Phenome-Wide Association Study (PheWAS) vocabulary [15]. PheWAS codes correspond to groups of ICD-9 codes more closely match the clinical and biological basis of diseases and reduce variability in identifying diseases. Based on this expectation, we translated a patient’s ICD-9 codes to PheWAS codes, which compressed the space into 1,374 unique PheWAS codes.
Number of Topics
The number of workflow and HCC topics were determined by minimizing the similarity over the range of 15 to 35 possible topics. This occurred when k = q = 25. At this point, the workflows and HCCs exhibited a minimum similarity of 0.003 and 0.031, respectively.
Results
To provide context for the findings, we begin with a depiction of the learned workflow and HCC topics. Next, we report on the clusters of HCCs and the extent to which they were deemed plausible for bundled care and had face validity according to evidence in the published literature.
Learned Workflow and HCC Topics
Recall that each workflow and HCC topic is expressed as a probability distribution over terms (i.e., subsequences of actions and PheWAS codes, respectively). To illustrate each topic succinctly, we depict the 10 terms with the largest probabilities. This cutoff was selected because the terms beyond this point had a negligible contribution to the probability mass for the affiliated topic. Specifically, none of these terms contributed a probability that was larger than 0.01.
We use ProM [37], a software tool for process mining, to visualize workflow topics as a directed graph. The graphs for all 25 workflow topics and their corresponding top 10 subsequences are provided in Appendix B. To orient the reader to workflow topics, we list workflow topic 15, which consists of two loops (a pair of + symbols represents the beginning and ending of a loop), as an example in Figure 4.
Figure 4.
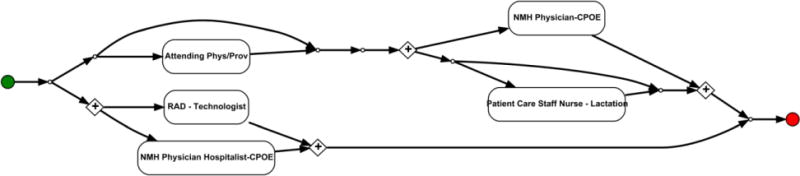
The directed graph of an echocardiography-based prenatal workflow. This visualization is based on the 10 subsequences with largest probabilities for the workflow topic. Note that, in this diagram, a pair of + symbols represents the beginning and ending of a loop.
The first loop resides between a Radiology Technologist (RAD) and an NMH Physician Hospitalist invoking Computerized Physician Order Entry (CPOE). This loop was associated with the process of an echocardiography, where a physician approves the quality of a radiological report or participates in the peer review process of a report. The second loop resides between an NMH Physician CPOE and a Patient Care Staff Nurse - Lactation. This loop is likely associated with a primary physician and staff nurse responsible for an inpatient’s care associated with obstetrics.
Each HCC topic is expressed as a probability distribution over the PheWAS codes. The top 10 PheWAS codes, along with their associated probabilities, for each HCC topic is provided in Appendix C. We summarized each HCC topic and provided a label to refer to them (as shown in Appendix C). To provide intuition, we report on an example of the topics associated with childbirth in Table 1. This topic shows that interventions are required for complicated pregnancies and delivery associated problems (e.g., short gestation, endocrine and metabolic disturbances of fetus or newborn).
Table 1.
The ten PheWAS codes in a HCC topic that are the most indicative of childbirth.
| PheWAS Code | Description | Probability |
|---|---|---|
| 1010 | Tests associated with child birth | 0.25 |
| 637 | Short gestation; low birth weight; and fetal growth retardation | 0.18 |
| 656 | Other perinatal conditions | 0.16 |
| 656.1 | Perinatal jaundice; isoimmunization | 0.10 |
| 651 | Multiple gestation | 0.05 |
| 656.3 | Endocrine and metabolic disturbances of fetus and newborn | 0.05 |
| 747.11 | Cardiac shunt; heart septal defect | 0.05 |
| 656.2 | Other respiratory conditions of fetus and newborn | 0.02 |
| 647 | Infectious & parasitic conditions complicating pregnancy | 0.02 |
| 747.13 | Congenital anomalies of great vessels | 0.01 |
Clusters of HCC and Workflow Topics
The modularity of the HCC and workflow topic cluster was 0.62. This indicates that the HCC topics and workflow topics within each cluster exhibited strong associations, while they exhibited weak associations between clusters. Figure 5 depicts the four inferred HCC topic cluster (shown in blue, green, purple and red) and their affiliated workflow topics.
Figure 5.
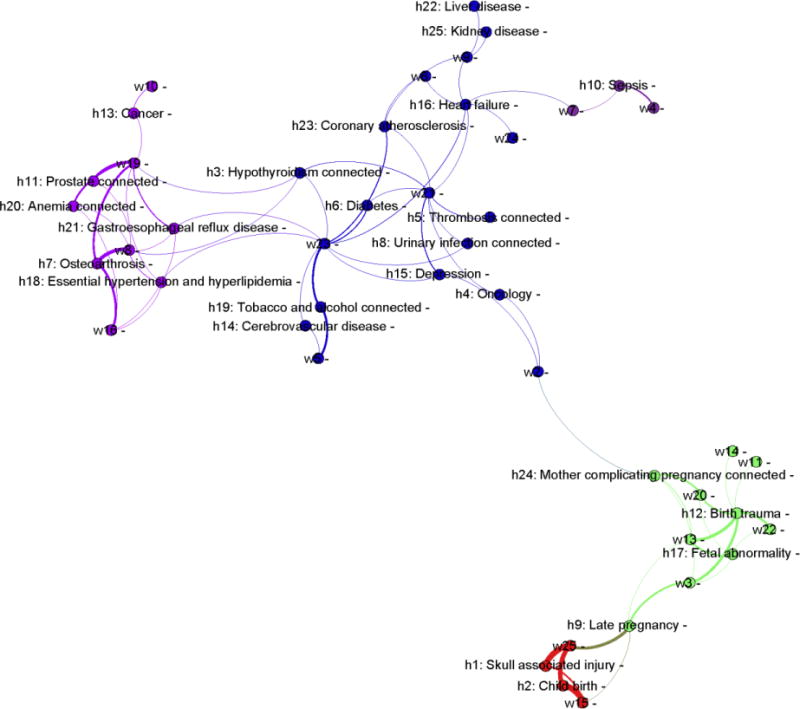
Four clusters of HCC topics inferred via their shared workflow topics. The edges represent the association strength between HCC and workflow topics. The wider the edge, the stronger the association. (Legend: h = HCC topic; w = workflow topic)
Cluster C1 (in green) is associated with fetal abnormality; C2 (in red) is associated with late pregnancy; C3 is associated with prostate problems and its corresponding complications (in purple); while C4 is complex, but is associated with various chronic problems, including cerebrovascular disease, coronary atherosclerosis, congestive heart failure (CHF), diabetes, and kidney failure (in blue).
To gain a deeper understanding of the inferred clusters and their associated workflow patterns, let us consider C1 as an example. The health conditions affiliated with C1 are the following HCC topics:
h12: Birth trauma,
h17: Fetal abnormality, and
h24: Mother complicating pregnancy,
which were associated with care patterns that incorporated the following workflow topics:
w3: Interactions between physicians and staff nurses,
w11: Interactions between physicians, anesthesiologists, advanced practice clinicians and pharmacists,
w13: Interactions between physicians and unit secretaries,
w14: Interactions between physicians, anesthesiologists and staff nurses, and
w22: Interactions between physicians, radiologists and unit secretaries.
This suggests that pregnancy complications (e.g., fetal abnormality and mother complicating pregnancy) are already managed together, requiring communication between various clinicians, obstetricians, anesthesiologists, radiologists, nurses, pharmacists, and administrative personnel.
Plausibility of Phenotypic Clusters for Bundled Care
The results of the plausibility survey are provided in Table 2. It can be seen that the experts always scored the inferred clusters as the more plausible for bundled care. All four clusters were statistically significantly higher than the randomized cluster in terms of the respondents’ scores (based on a 95% confidence interval). This suggests that the HCC clusters associated with fetal abnormality, late pregnancy, prostate problems and CHF are plausible candidates for bundled care.
Table 2.
Survey results of the knowledgeable experts (n = 5) regarding the plausibility of HCC clusters for bundled care. Each cluster is represented as a list of PheWAS codes and a brief summary. Each row reports the distance between the Likert score of the inferred HCC cluster and its random counterpart. Note that a positive distance indicates the inferred cluster received a higher Likert score.
| Cluster | PheWAS Code and Description | Likert Score Difference | P-value | |
|---|---|---|---|---|
| Informal Description: Fetal abnormality leads to complicated pregnancy and additional delivery problems (e.g., fetal distress), which requires interventions, such as those provided by the birth trauma service. | ||||
|
| ||||
| C1 | 649 | Other conditions of the mother complicating pregnancy | 0.95 | 6.09 × 10⁻⁸* |
| 652 | Malposition and malpresentation of fetus or obstruction | |||
| 654 | Abnormality pelvic soft tissues & organs complicating pregnancy | |||
| 658 | Problems associated with amniotic cavity and membranes | |||
| 659 | Indications for care or intervention related to labor and delivery NEC | |||
| 663 | Umbilical cord complications during labor and delivery | |||
| 665 | Obstetrical/birth trauma | |||
|
| ||||
| Informal Description: Late pregnancy suggests a larger size infant requiring intervention (e.g. use of suction or forceps), which can cause temporary skull injuries. | ||||
|
| ||||
| C2 | 637 | Short gestation; low birth weight; and fetal growth retardation | 0.95 | 6.09 × 10⁻⁸* |
| 645 | Late pregnancy and failed induction | |||
| 649 | Other conditions of the mother complicating pregnancy | |||
| 656 | Other perinatal conditions | |||
| 656.1 | Perinatal jaundice/isoimmunization | |||
| 665 | Obstetrical/birth trauma | |||
| 819 | Skull fracture and other intracranial injury | |||
| 1010 | Other tests | |||
| 1008 | Internal injury to organs | |||
|
| ||||
| Informal Description: Anemia and hypogonadism are often complications of prostate cancer and can lead to bone loss. When the thyroid does not produce a sufficient amount of hormones, it can cause lower esophageal sphincter dysfunction. This allows stomach contents and digestive juices to enter the esophagus, which may lead to gastroesophageal reflux disease. | ||||
|
| ||||
| C3 | 244 | Hypothyroidism | 0.65 | 2.80 × 10⁻⁴* |
| 272.1 | Hyperlipidemia | |||
| 276.14 | Hypopotassemia | |||
| 285.9 | Anemia | |||
| 327.32 | Obstructive sleep apnea | |||
| 401.1 | Essential hypertension | |||
| 495 | Asthma | |||
| 530.11 | Gastroesophageal reflux disease | |||
| 600 | Hyperplasia of prostate | |||
| 740.1 | Osteoarthritis; localized | |||
|
| ||||
| Informal Description: Cerebrovascular disease and coronary atherosclerosis are the most common cause of congestive heart failure (CHF); smoking and diabetes are associated with all three diseases. Depression is associated with coronary disease. Liver test abnormalities and renal failure may occur with CHF. | ||||
|
| ||||
| C4 | 250.2 | Type 2 diabetes | 0.70 | 7.04 × 10⁻⁵* |
| 272.1 | Hyperlipidemia | |||
| 286.5 | Hemorrhagic disorder due to intrinsic circulating anticoagulants | |||
| 296.2 | Depression | |||
| 316 | Substance addiction and disorders | |||
| 318 | Tobacco use disorder | |||
| 401.1 | Essential hypertension | |||
| 401.22 | Hypertensive chronic kidney disease | |||
| 427.21 | Atrial fibrillation | |||
| 428 | Heart failure | |||
| 428.1 | Systolic/diastolic heart failure | |||
| 433.31 | Transient cerebral ischemia | |||
| 452 | Venous embolism & thrombosis | |||
| 585.3 | Chronic renal failure | |||
| 591 | Urinary tract infection | |||
| 707.1 | Decubitus ulcer | |||
= statistical significance at the 0.05 confidence level)
Additionally, to orient the reader to each HCC cluster, we provide each, along with an informal summary, in Table 2.
Evidence in the Published Literature for HCC Clusters
While the HCC clusters were deemed plausible for bundled care from a management perspective, we further investigated if the health conditions within such clusters were clinically related. If there was support from both care process and clinical perspectives, we anticipate that the identified HCC clusters would be better received by HCO administrators.
Towards this goal, we reviewed evidence for the inferred HCC cluster in the peer-reviewed literature. Evidence was uncovered for each cluster, a summary of which is shown in Table 3. For instance, within cluster C3, bone loss is known to be caused by hypogonadism following prostate cancer [38]. Furthermore, acid reflux is known to be affiliated with thyroid problems [39].
Table 3.
Evidence in the peer-reviewed literature to support the face validity of the HCCs within each inferred cluster.
| Cluster | Evidence of Associations in the Literature |
|---|---|
| C1 | |
| C2 | |
| C3 | |
| C4 |
Discussion
Main Findings
This study proposed a data-driven framework to automatically learn clinical workflow patterns, phenotypic patterns and the relationships between them. We believe this approach, and the associated empirical analysis, provide evidence to assist in identifying, as well as refining, bundled care models. The study has several notable implications.
First, the associations we uncovered between patients with a bundle of healthcare conditions and clinical workflows can provide knowledge that HCOs can build upon to establish care teams that are in alignment with a patient’s needs. In particular, we learned workflow patterns at the level of HCO employees and their affiliated roles. We believe this provides evidence to depict who works with whom in a care team and what are the interactive relationships between the team members. Moreover, the relationship between workflow and phenotypic patterns suggests that a set of related health conditions could be managed by a set of HCO employees in the form of a workflow. This is important because it suggests such workflows could be leveraged to put the right HCO employees in place for the right patients. For instance, consider patients who are nearing childbirth. These patients’ conditions may be affiliated with three specific HCC topics: h12: Birth trauma, h17: Fetal abnormality, and h24: Mother complicating pregnancy. And, these HCC topics are associated with care patterns that incorporate three specific workflow topics: w3: associated with physicians and care staff nurses, w14: associated with anesthesiologists, and w22: associated with radiologists. Now, if a patient is associated with the three HCC topics, it may be better to assign the patient to a care team that includes all HCO employees from all three workflows. In doing so, the HCO could manage the patient’s conditions in a bundled manner, as opposed to attempting to manage each health condition independently.
Second, the associations between workflow and HCC topics should provide support for HCOs to manage patients and conduct resource allocation more efficiently. For instance, if the volume of patients associated with complicated pregnancies (e.g., birth trauma, fetal abnormality) grows, then HCOs could dedicate a larger amount of resources to workflow topics w3, w14 and w22.
Third, we believe that the evidence derived through our framework can be leveraged to design testable hypotheses regarding workflow and patient outcomes. Specifically, the output of our framework could be relied upon to investigate the differences between learned care teams and existing patient management protocols. This could be accomplished in terms of their impact on patient outcomes, such as readmission rates or length of stay in the hospital.
Limitations and Next Steps
Despite the merits of our findings, there are several limitations that we wish to highlight for future investigations. First, this study focused on the development of a methodology to infer general collections of health conditions that share similar workflow patterns according to EMR system utilization. However, we did not validate the clinical meaning (e.g., semantic context) for each of the inferred HCCs nor their workflows. If such HCC and workflow are to be relied upon in care management applications, their semantics will require further interpretation by administrative experts.
Second, while all four HCC clusters were deemed plausible for bundled care, several associations within congestive heart failure cluster C4 were not clear to the experts. Specifically, there are a number of reasons why renal failure and liver disease might co-occur in a patient, such that this cluster may be too general in nature. In this respect, our study indicates health conditions have the potential to be managed in a bundled manner, but what precisely should be managed is an open question and will require guidance by process management experts.
Third, we acknowledge that this is a pilot only, which focuses on a case study of four months of data from a single HCO. As such, we uncovered only four HCC clusters. It is unknown if the proposed strategy directly generalizes to other healthcare systems.
Conclusions
In this paper, we introduced a data-driven framework to mine EMRs for HCC clusters that might benefit from the establishment, or formalization, of bundled care routines. We evaluated our approach with four months of inpatient data from a large hospital system and uncovered four clusters of HCCs, which were deemed plausible for bundled care by knowledgeable experts and evidence in the literature. We anticipate working with process management and clinical experts to assess the workflow patterns affiliated with each inferred cluster to ascertain how they can support bundled care. Furthermore, we plan to test the performance and efficacy of such the framework with data from additional healthcare systems.
Supplementary Material
Highlights.
A data-driven framework to infer an association network of health condition collections (HCCs) and workflows.
A strategy to learn HCC clusters based on the associations network.
An online survey method to evaluate the plausibility of HCC clusters managed in a seemingly bundled way.
Acknowledgments
The authors thank Daniel Schneider and Prasanth Nannapaneni for gathering and supplying the de-identified data from Northwestern Memorial Hospital analyzed in this investigation.
Funding
This research was supported, in part, by the National Institutes of Health under grants R00LM011933 and R01LM010685.
Appendices
Appendix A
Survey questions.
Appendix B
Workflow topics, each of which is represented by its top 10 subsequences and visualized as a process graph via Business Process Model and Notation (BPMN) in ProM.
Appendix C
HCC topics, each of which is represented by its top 10 PheWAS codes.
Footnotes
Publisher's Disclaimer: This is a PDF file of an unedited manuscript that has been accepted for publication. As a service to our customers we are providing this early version of the manuscript. The manuscript will undergo copyediting, typesetting, and review of the resulting proof before it is published in its final citable form. Please note that during the production process errors may be discovered which could affect the content, and all legal disclaimers that apply to the journal pertain.
Contributors
YC performed the data collection and analysis, methods design, hypotheses design, experiments design, evaluation and interpretation of the experiments, and drafting and revising of the manuscript. AK and DL performed data collection, evaluation and interpretation of the experiments and revising of the manuscript. CI, SO, and JB performed evaluations of inferred clusters of phenotypes, and revising of the manuscript. BM performed the data collection and analysis, evaluation and interpretation of the experiments, and revising of the manuscript.
References
- 1.Mulley AG. The global role of health care delivery science: learning from variation to build health systems that avoid waste and harm. J Gen Intern Med. 2013;28:646–653. doi: 10.1007/s11606-013-2457-6. [DOI] [PMC free article] [PubMed] [Google Scholar]
- 2.Peterson MW. Emerging developments in postsecondary organization theory and research: fragmentation or integration. Educational Researcher. 1985;14:5–12. [Google Scholar]
- 3.Stange KC. The problem of fragmentation and the need for integrative solutions. Ann Fam Med. 2009;7:100–103. doi: 10.1370/afm.971. [DOI] [PMC free article] [PubMed] [Google Scholar]
- 4.Zismer DK. The promise of the brand: how health system leaders are guiding the transition to health services integration. J Healthc Manag. 2013;58(1):12–14. [PubMed] [Google Scholar]
- 5.Committee on Quality of Health Care in America. Crossing the Quality Chasm: A New Health System for the 21st Century. National Academy Press. 2001 [Google Scholar]
- 6.McDonald KM, Schultz E, Albin L, et al. AHRQ Publication No. 14-0037-EF. Rockville, MD: Agency for Healthcare Research and Quality; 2014. Care Coordination Atlas Version 4 (Prepared by Stanford University under subcontract to American Institutes for Research on Contract No. HHSA290-2010-00005I) [Google Scholar]
- 7.Berry LL, Beckham D. Team-based care at Mayo Clinic: a model for ACOs. J Healthc Manag. 2014;59(1):9–13. [PubMed] [Google Scholar]
- 8.Emmert-Streib F, Tripathi S, Simoes R, et al. The human disease network: opportunities for classification, diagnosis and prediction of disorders and disease genes. Syst Biomed. 2013;1:15–22. [Google Scholar]
- 9.Janjić V, Pržulj N. Biological function through network topology: a survey of the human diseasome. Brief Funct Genomics. 2012;11:522–532. doi: 10.1093/bfgp/els037. [DOI] [PMC free article] [PubMed] [Google Scholar]
- 10.Linghu B, Snitkin ES, Hu Z, et al. Genome-wide prioritization of disease genes and identification of disease-disease associations from an integrated human functional linkage network. Genome Biol. 2009;10:R91. doi: 10.1186/gb-2009-10-9-r91. [DOI] [PMC free article] [PubMed] [Google Scholar]
- 11.Schriml LM, Arze C, Nadendla S, et al. Disease Ontology: a backbone for disease semantic integration. Nucleic acids research. 2011;40(D1):D940–D946. doi: 10.1093/nar/gkr972. [DOI] [PMC free article] [PubMed] [Google Scholar]
- 12.Žitnik M, Janjić V, Larminie C, et al. Discovering disease-disease associations by fusing systems-level molecular data. Sci Rep. 2013;3:3202. doi: 10.1038/srep03202. [DOI] [PMC free article] [PubMed] [Google Scholar]
- 13.Schulam P, Wigley F, Saria S. Clustering longitudinal clinical marker trajectories from electronic health data: applications to phenotyping and endotype discovery. Proceedings of the AAAI Annual Conference; 2015. pp. 2956–2964. [Google Scholar]
- 14.Pivovarov R, Perotte AJ, Grave E, Angiolillo J, Wiggins CH, Elhadad N. Learning probabilistic phenotypes from hetergeneous EHR data. J Biomed Inform. 2015;58:156–165. doi: 10.1016/j.jbi.2015.10.001. [DOI] [PMC free article] [PubMed] [Google Scholar]
- 15.Denny JC, Ritchie MD, Basford MA, et al. PheWAS: demonstrating the feasibility of a phenome-wide scan to discover gene-disease associations. Bioinformatics. 2010;26:1205–1210. doi: 10.1093/bioinformatics/btq126. [DOI] [PMC free article] [PubMed] [Google Scholar]
- 16.Hripcsak G, Albers DJ. Next-generation phenotyping of electronic health records. J Am Med Inform Assoc. 2013;20:117–121. doi: 10.1136/amiajnl-2012-001145. [DOI] [PMC free article] [PubMed] [Google Scholar]
- 17.Ho J, Ghosh J, Steinhubl SR, Stewart WF, Denny JC, Malin BA, Sun J. Limestone: high-throughput candidate phenotype generation via tensor factorization. J Biomed Inform. 2014;52:199–211. doi: 10.1016/j.jbi.2014.07.001. [DOI] [PMC free article] [PubMed] [Google Scholar]
- 18.Zheng T, Xie W, Xu l, Zhang Y, Yang G, Chen Y. A machine learning-based framework to identify type 2 diabetes through electronic health records. Int J Med Inform. 2017;97:120–127. doi: 10.1016/j.ijmedinf.2016.09.014. [DOI] [PMC free article] [PubMed] [Google Scholar]
- 19.Chen Y, Lorenzi NM, Sandberg WS, Wolgast K, Malin BA. Identifying collaborative care teams through electronic medical record utilization patterns. J Am Med Inform Assoc. 2017;24(e1):e111–e120. doi: 10.1093/jamia/ocw124. [DOI] [PMC free article] [PubMed] [Google Scholar]
- 20.DeFlitch C, Geeting G, Paz HL. Reinventing Emergency Department Flow via Healthcare Delivery Science. HERD. 2015;8:105–115. doi: 10.1177/1937586715580949. [DOI] [PubMed] [Google Scholar]
- 21.Hribar MR, Brown SR, Reznick LG, et al. Secondary use of EHR timestamp data: validation and application for workflow optimization. AMIA Annu Symp. 2015:1909–1917. [PMC free article] [PubMed] [Google Scholar]
- 22.Huang ZX, Dong W, Wang F, et al. Medical inpatient journey modeling and clustering: a Bayesian hidden Markov model based approach. AMIA Annu Symp. 2015:649–658. [PMC free article] [PubMed] [Google Scholar]
- 23.Merill JA, Sheehan BM, Carley KM, Stetson PD. Transition networks in a cohort of patients with congestive heart failure. Appl Clin Inform. 2015;6:548–564. doi: 10.4338/ACI-2015-02-RA-0021. [DOI] [PMC free article] [PubMed] [Google Scholar]
- 24.Yan C, Chen Y, Li B, et al. Learning clinical workflows to identify subgroups of heart failure patients. AMIA Annu Symp. 2016:1248–1257. [PMC free article] [PubMed] [Google Scholar]
- 25.Chen Y, Xie W, Gunter C, et al. Inferring clinical workflow efficiency via electronic medical record utilization. AMIA Annu Symp. 2015:416–425. [PMC free article] [PubMed] [Google Scholar]
- 26.Chen Y, Ghosh J, Bejan CA, et al. Building bridges across electronic health record systems through inferred phenotypic topics. J Biomed Inform. 2015;55:482–493. doi: 10.1016/j.jbi.2015.03.011. [DOI] [PMC free article] [PubMed] [Google Scholar]
- 27.Blei DM, Ng AY, Jordan MI. Latent Dirichlet allocation. Journal of Machine Learning Research. 2003;3:993–1022. [Google Scholar]
- 28.Newman D, Asuncion A, Smyth P, et al. Distributed inference for latent Dirichlet allocation. Proceedings of Neural Information Processing Systems; 2007. pp. 1–9. [Google Scholar]
- 29.Blondel VD, Guillaume JL, Lambiotte R, et al. Fast unfolding of communities in large networks. Journal of Statistical Mechanics: Theory and Experiment. 2008;10:P1000. [Google Scholar]
- 30.Newman M. Modularity and community structure in networks. Proc Nat Acad Sci USA. 2006;103(23):8577–8696. doi: 10.1073/pnas.0601602103. [DOI] [PMC free article] [PubMed] [Google Scholar]
- 31.David C, Hoaglinab E. The hat matrix in regression and ANOVA. American Statistician. 1978;32(1):17–22. [Google Scholar]
- 32.Harris PA, Taylor R, Thielke R, et al. Research electronic data capture (REDCap) - a metadata-driven methodology and workflow process for providing translational research informatics support. J Biomed Inform. 2009;42:377–381. doi: 10.1016/j.jbi.2008.08.010. [DOI] [PMC free article] [PubMed] [Google Scholar]
- 33.Chan M, Lim PL, Chow A, et al. Surveillance for Clostridium difficile infection: ICD-9 coding has poor sensitivity compared to laboratory diagnosis in site patients. PLoS One. 2001;6:e15603. doi: 10.1371/journal.pone.0015603. [DOI] [PMC free article] [PubMed] [Google Scholar]
- 34.Deych EB, Waterman AD, Yan Y, Nilasena DS, et al. Accuracy of ICD-9-CM codes for identifying cardiovascular and stroke risk factors. Med Care. 2005;43:480–485. doi: 10.1097/01.mlr.0000160417.39497.a9. [DOI] [PubMed] [Google Scholar]
- 35.Ludvigsson JF, Pathak J, Murphy S. Use of computerized algorithm to identify individuals in need of testing for celiac disease. J Am Med Inform Assoc. 2013;20:e306–310. doi: 10.1136/amiajnl-2013-001924. [DOI] [PMC free article] [PubMed] [Google Scholar]
- 36.Pathak J, Kho AN, Denny JC. Electronic health records-driven phenotyping: challenges, recent advances, and perspectives. J Am Med Inform Assoc. 2013;20:e206–11. doi: 10.1136/amiajnl-2013-002428. [DOI] [PMC free article] [PubMed] [Google Scholar]
- 37.Van der Aalst WMP, van Dongen BF, et al. ProM 4.0: Comprehensive support for real process analysis. In: Kleijn J, Yakovlev A, editors. Application and Theory of Petri Nets and Other Models of Concurrency. Vol. 4546. 2007. pp. 484–494. [Google Scholar]
- 38.Mittan D, Lee S, Miller E, et al. Bone loss following hypogonadism in men with prostate cancer treated with GnRH analogs. J Clin Endocrinol Metab. 2002;87:3656–3661. doi: 10.1210/jcem.87.8.8782. [DOI] [PubMed] [Google Scholar]
- 39.Hamdan A, Jabbour J, Dowli A, Dahouk EI, Azar ST. Prevalence of Laryngopharyngeal reflux disease in patient diagnosied with hypothyroidism. Acta Endocrinologica. 2012;8(2):239–248. [Google Scholar]
- 40.Gordon M, Rich H, Deutschberger J, et al. The immediate and long-term outcome of obstetric birth trauma: I. Brachial plexus paralysis. Am J Obst Gynecol. 1973;117:51–56. doi: 10.1016/0002-9378(73)90727-8. [DOI] [PubMed] [Google Scholar]
- 41.Jovanovic-Petersona L, Petersona CM. Dietary manipulation as a primary treatment strategy for pregnancies complicated by diabetes. J Am Coll Nutr. 1990;9:320–325. doi: 10.1080/07315724.1990.10720387. [DOI] [PubMed] [Google Scholar]
- 42.Murphy NJ, Quinlan JD. Trauma in pregnancy: assessment, management, and prevention. Am Fam Physician. 2014;90:717–722. [PubMed] [Google Scholar]
- 43.Gülmezoglu AM, Crowther CA, Middleton P, et al. Induction of labour for improving birth outcomes for women at or beyond term. Cochrane Database Syst Rev. 2012;4:CD004945. doi: 10.1002/14651858.CD004945.pub3. [DOI] [PMC free article] [PubMed] [Google Scholar]
- 44.Towner D, Castro MA, Eby-Wilkens E, et al. Effect of mode of delivery in nulliparous women on neonatal intracranial injury. N Engl J Med. 1999;341:1709–1714. doi: 10.1056/NEJM199912023412301. [DOI] [PubMed] [Google Scholar]
- 45.Rothenberger D. Blunt maternal trauma: a review of 103 cases. J Trauma. 1987;18(3):173–179. [PubMed] [Google Scholar]
- 46.Nalesnik JG, Mysliwiec AG, Canby-Hagino E. Anemia in men with advanced prostate cancer: incidence, etiology, and treatment. Rev Urol. 2004;6:1–4. [PMC free article] [PubMed] [Google Scholar]
- 47.Pednekara MS, Sansonea G, Guptaa PC. Association of alcohol, alcohol and tobacco with mortality: findings from a prospective cohort study in Mumbai (Bombay), India. Alcohol. 2012;46:139–146. doi: 10.1016/j.alcohol.2011.08.006. [DOI] [PubMed] [Google Scholar]
- 48.Shantsila E, Lip G. Thrombotic complications in heart failure - an underappreciated challenge. Circulation. 2014;130:387–389. doi: 10.1161/CIRCULATIONAHA.114.011353. [DOI] [PubMed] [Google Scholar]
- 49.Piazza G, Seddighzadeh A, Goldhaber SZ. Heart failure in patients with deep vein thrombosis. Am J Cardiol. 2008;101:1056–1059. doi: 10.1016/j.amjcard.2007.11.051. [DOI] [PubMed] [Google Scholar]
- 50.Johnson RJ, Segal MS, Sautin Y, et al. Potential role of sugar (fructose) in the epidemic of hypertension, obesity and the metabolic syndrome, diabetes, kidney disease, and cardiovascular disease. Am J Clin Nutr. 2007;86:899–906. doi: 10.1093/ajcn/86.4.899. [DOI] [PubMed] [Google Scholar]
- 51.McCarty CA, Chisholm RL, Chute CG, et al. The eMERGE Network: a consortium of biorepositories linked to electronic medical records data for conducting genomic studies. BMC Med Genomics. 2011;4:13. doi: 10.1186/1755-8794-4-13. [DOI] [PMC free article] [PubMed] [Google Scholar]
- 52.Chen Y, Carroll RJ, Hinz ER, et al. Applying active learning to high-throughput phenotyping algorithms for electronic health records data. J Am Med Inform Assoc. 2013;20(e2):e253–e259. doi: 10.1136/amiajnl-2013-001945. [DOI] [PMC free article] [PubMed] [Google Scholar]
- 53.Henderson J, Bridges R, Ho JC, Wallace BC, Ghosh J. A tool for evaluating high-throughput phenotype candidates using online medical literature. AMIA Jt Summits Transl Sci Proc. 2017:149–157. [PMC free article] [PubMed] [Google Scholar]
- 54.Yu S, et al. Toward high-throughput phenotyping: unbiased automated feature extraction and selection from knowledge sources. J Am Med Inform Assoc. 2015;22(5):993–1000. doi: 10.1093/jamia/ocv034. [DOI] [PMC free article] [PubMed] [Google Scholar]
- 55.Wang Y, Chen R, Ghosh J, et al. Rubik: Knowledge guided tensor factorization and completion for health data analytics. Proceedings of the 21st ACM SIGKDD International Conference on Knowledge Discovery and Data Mining; 2015. pp. 1265–1274. [DOI] [PMC free article] [PubMed] [Google Scholar]
- 56.Lasko TA, Denny JC, Levy MA. Computational phenotype discovery using unsupervised feature learning over noisy, sparse, and irregular clinical data. PLoS One. 2013;8(6):e66341. doi: 10.1371/journal.pone.0066341. [DOI] [PMC free article] [PubMed] [Google Scholar]
- 57.Bouarfa L, Dankelman J. Workflow mining and outlier detection from clinical activity logs. J Biomed Inform. 2012;45(6):1185–90. doi: 10.1016/j.jbi.2012.08.003. [DOI] [PubMed] [Google Scholar]
- 58.Zhang H, Mehotra S, Liebovitz D, Gunter CA, Malin B. Mining deviations from patient care pathways via electronic medical record system audits. ACM Transactions on Management Information Systems. 2013;4(4):17. [Google Scholar]
- 59.Huang ZX, Dong W, Ji L, Gan CX, Lu XD, Duan HL. Discovery of clinical pathway patterns from event logs using probabilistic topic models. J Biomed Inform. 2014;47:39–57. doi: 10.1016/j.jbi.2013.09.003. [DOI] [PubMed] [Google Scholar]
- 60.Fullerton CA, Henke RM, Crable EL, et al. The impact of Medicare ACOs on improving integration and coordination of physical and behavioral health care. Health Aff. 2016;35(7):1257–1265. doi: 10.1377/hlthaff.2016.0019. [DOI] [PubMed] [Google Scholar]
- 61.Kho AN, Pacheco JA, Peissig PL, et al. Electronic medical records for genetic research: results of the eMERGE consortium. Sci Transl Med. 2011;3(79):79re1. doi: 10.1126/scitranslmed.3001807. [DOI] [PMC free article] [PubMed] [Google Scholar]
- 62.Kho AN, Hayes MG, Rasmussen-Torvik L, et al. Use of diverse electronic medical record systems to identify genetic risk for type 2 diabetes within a genome-wide association study. J Am Med Inform Assoc. 2011;19(2):212–218. doi: 10.1136/amiajnl-2011-000439. [DOI] [PMC free article] [PubMed] [Google Scholar]
- 63.Unertl KM, Weinger MB, Johnson KB, Lorenzi NM. Describing and modeling workflow and information flow in chronic disease care. J Am Med Inform Assoc. 2009;16(6):826–36. doi: 10.1197/jamia.M3000. [DOI] [PMC free article] [PubMed] [Google Scholar]
- 64.Chen Y, Lorenzi N, Nyemba S, et al. We work with them? Healthcare workers interpretation of organizational relations mined from electronic health records. International journal of medical informatics. 2014;83(7):495–506. doi: 10.1016/j.ijmedinf.2014.04.006. [DOI] [PMC free article] [PubMed] [Google Scholar]
Associated Data
This section collects any data citations, data availability statements, or supplementary materials included in this article.