

Abstract
Three-dimensional proton magnetic resonance spectroscopic imaging (MRSI) is a powerful non-invasive tool for characterizing spatial variations in metabolic profiles for patients with glioma. Metabolic parameters obtained using this technique have been shown to predict treatment response, disease progression, and transformation to a more malignant phenotype. The availability of ultra-high-field MR systems has the potential to improve the characterization of metabolites. The purpose of this study was to compare the metabolite profiles acquired with conventional long echo time (TE) MRSI at 3T with those obtained with short TE MRSI at 3T and 7T in patients with glioma. The data acquisition parameters were optimized separately for each echo time and field strength to obtain volumetric coverage within clinically feasible data acquisition times of 5–10 min. While a higher field strength did provide better detection of metabolites with overlapping peaks, spatial coverage was reduced and the use of inversion recovery to reduce lipid precluded the detection of lipid in regions of necrosis. For serial evaluation of large, heterogeneous lesions, the use of 3T short TE MRSI may thus be preferred. Despite the limited number of metabolites that it is able to detect, the use of 3T long TE MRSI gives the best contrast in choline/N-acetyl aspartate between normal appearing brain and tumor and also allows the separate detection of lactate and lipid. It may therefore be preferred for serial evaluation of patients with high-grade glioma and for detection of malignant transformation in patients with low-grade glioma.
Keywords: Glioma, 3T, 7T, Magnetic resonance spectroscopic imaging, Echo time, Metabolites, Automatic prescription
Graphical abstract
INTRODUCTION
Gliomas are heterogeneous, infiltrative lesions that account for the majority of primary brain tumors in adults.1 Surgical resection is the first-line treatment, with radiation and a variety of therapeutic agents being used to address residual or recurrent disease. The median survival for patients with high-grade glioma who are being treated with the current standard of care is approximately 15 months.2 Patients with low-grade glioma have a better prognosis and, after resection, may be followed with active surveillance until they show evidence of progression. Deciding when and how to treat, as well as assessing whether the lesion has undergone transformation to a more malignant phenotype, is critical. Although conventional magnetic resonance imaging (MRI) is useful for planning surgery and following gross changes in the anatomic lesion, the effects of treatment on the tumor and surrounding tissue can make it difficult to differentiate between response to therapy and recurrent disease. The development of alternative imaging methods is essential for making informed decisions about patient care.
Multivoxel three-dimensional (3D) proton magnetic resonance spectroscopic imaging (H-1 MRSI) is a powerful, noninvasive tool that has been used to characterize spatial variations in metabolic profiles for patients with glioma.3–7 Most studies have been performed at 3T using a relatively long echo time (TE), which provides levels of choline-containing compounds (Cho), creatine, N-acetyl aspartate (NAA), lactate, and lipid. The increase in the level of Cho, which is thought to be due to increased cell density and/or membrane turnover in neoplasm, and the reduction in the level of neuronal marker NAA are general marks for brain tumor. Levels of lactate and lipid within regions having abnormal Cho and NAA were found to be critical markers for assessing the response to combination therapies and predicting the outcome for patients with glioblastoma.7–9 Recent studies with ex vivo high-resolution magic-angle spinning (HRMAS) of tissue samples that were obtained during image-guided surgery have highlighted the potential of other in vivo metabolites, such as glutamine (Gln), glutamate (Glu), myo-inositol (mI), GABA, and glutathione, to detect malignant transformation10,11 and to differentiate between tumor and gliosis.12 These metabolites are visible in vivo using short TE acquisitions, but the majority of studies performed so far have focused on acquiring such data in single-voxel mode from regions with a volume of approximately 8 cm3. Uncertainty about the location of tumor relative to treatment effects and the difficulty in obtaining data from the same location in serial studies have made it difficult to interpret the results obtained.
MR systems with a field strength of 7 T (7T) offer improved sensitivity and spectral resolution that are likely to be important for distinguishing between partially overlapping metabolites such as Glu and Gln or mI and glycine, which are often reported as the combined indices (Glx and mIG). Previous studies in normal volunteers have reported a linear increase in the signal-to-noise ratio (SNR) at higher field strengths13 and improvements in spectral quantification at 7T relative to 3T14,15 that may be needed to evaluate differences in metabolite profiles within regions of pathology. Our prior study demonstrated the successful application of short TE MRSI to patients with glioma by using a 7T MR scanner in conjunction with a high-sensitivity 32-channel coil16 but also highlighted challenges in terms of obtaining reliable lipid suppression from large regions of the brain. This brings into question the practicability of using the higher field strength for routine evaluation of brain metabolites in patients with glioma.
A further challenge to obtaining good quality multivoxel volumetric H-1 MRSI, which applies to both 3T and 7T field strengths, is to reproducibly select the volume of interest and place multiple outer volume suppression (OVS) bands to eliminate unwanted signals. This can be difficult and time-consuming, even for skilled operators, because of alterations in the orientation of the head and changes in the appearance of the anatomic lesion. Our recent studies have shown that automatic prescription of the volume of interest and of the OVS bands greatly facilitates the acquisition process17,18 and can offer consistent data quality for serial studies of changes in metabolite levels. This can be achieved by either optimizing the coverage based upon analysis of anatomic images during the MR scan itself or using atlas-based registration to specify the location using predefined templates in the MNI152 standard space.19
The purpose of this study was to use the automated prescription method in patients with glioma to compare the metabolite profiles acquired using three different data acquisition strategies that had each separately been optimized on the available hardware prior to the analysis. These are conventional long TE MRSI at 3T, short TE MRSI at 3T, and short TE MRSI at 7T. Criteria used to distinguish between them were the spatial coverage provided, the number of voxels within that region that contained quantifiable spectra, and the ratios of key metabolites in normal appearing brain and the region of T2 hyperintensity on the anatomic images. In all cases, the acquisition time was kept within 5–10 min, which is comparable with other volumetric imaging sequences and is therefore reasonable for use in patient studies.
RESULTS AND DISCUSSION
The availability of ultra-high-field MR systems has the potential for more detailed analysis of brain metabolites because it provides a higher SNR and improved spectral resolution for patients with glioma. The differences in relaxation times of brain metabolites between the T2 lesion and normal brain20 and shortening of T2 relaxation times at 7T21 could change the contrast between metabolites in the different regions. These effects have not previously been evaluated for patients with glioma. In this study, we first established the optimal strategies for acquiring H-1 MRSI data and then applied them to assess patients with glioma.
Figure 1 illustrates automatic prescriptions of 3D MRSI excitation volume and OVS bands from patients with glioma at 3T and 7T. The median automatically prescribed PRESS volume was 1032.4 cm3 (range, 821.2–1244.5 cm3) with an average of 6.7 cm in the S/I direction at 3T, while the excited slab at 7T was localized using spin echo slice selection with a fixed thickness of 4 cm.16 Considering the location and width of the OVS bands, the percentage of excitation for each voxel was calculated. The median number of voxels that were excited was 523 (range, 465–765) and 405 (range, 282–542) at 3T and 7T, respectively. The volume of the T2 lesion varied from 0.75 to 168.8 cm3, and the median coverage was 76% at 3T and 69% at 7T.
Figure 1.
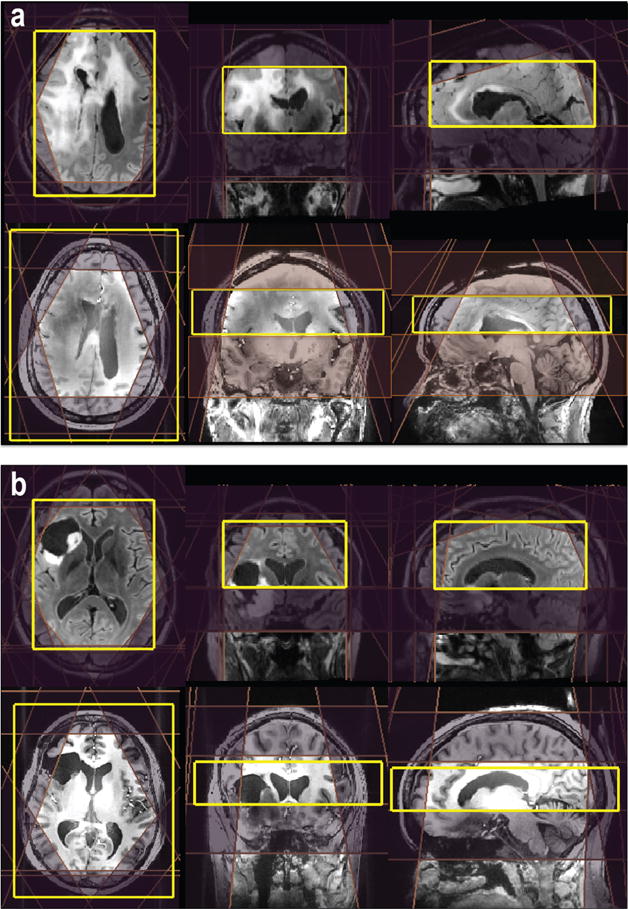
Examples of automatic prescription for 3D MRSI. The locations of the PRESS excitation volume and VSS outer suppression bands for 3T MRSI were automatically placed by (a) a method that calculates the masks of brain and lipid in real time or (b) predefining templates on the MNI152 standard space. For 7T MRSI, eight VSS were automatically prescribed on the basis of the position of the excitation volume that was selected.
By using a flyback echo-planar trajectory22 for spatial localization, it was possible to excite a large number of voxels with a nominal voxel size of 1 cm3 within a clinically feasible acquisition time (5–10 min) for each acquisition. The 7T MRSI data set had relatively less coverage because of the smaller number of phase encodes in the slice direction, which allowed for the application of an interleaved flyback trajectory and provided a bandwidth of 1916 Hz with a spectral resolution of ∼1.74 Hz per point.16 The spatial resolution of 3D MRSI (1 cm3) and the use of OVS bands meant that the number of voxels in the T2 lesion was smaller than the volume of T2 coverage, especially for tumors located close to skull.
The estimated linewidths for Cho, Cr, and NAA in NAWM during 3T long TE MRSI were 6.4 ± 0.5, 5.4 ± 0.5, and 7.1 ± 0.5 Hz, respectively; for 3T short TE MRSI, they were 5.9 ± 0.3, 5.6 ± 0.3, and 8.5 ± 0.9 Hz, respectively, and for 7T short TE MRSI, they were 11.8 ± 1.1, 11.8 ± 1.8, and 15.5 ± 2.1 Hz, respectively (values expressed as means ± the standard deviation). When expressed in terms of parts per million, these values corresponded to 0.043 ppm at 3T and 0.040 ppm at 7T for the Cr peak. The linewidths of Cr in the T2 lesion were 5.5 ± 1.2, 6.0 ± 1.3, and 14.4 ± 3.4 Hz for the three acquisitions. These values are slightly higher than those previously reported for healthy volunteers.14 This implies that the commercially available high-order shimming worked well but that the presence of surgical cavities and other treatment effects make it more challenging to achieve B0 homogeneity at 7T. It is not clear whether alternative shimming methods such as FASTERMAP23 and the use of third or other high order24 could be used to improve the 7T results.
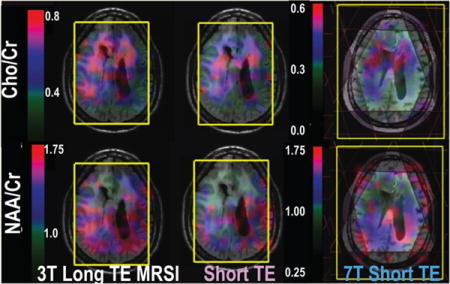
Among the three acquisitions, there were significant differences in the median levels of the main metabolites in the NAWM and T2 lesion but not for Cho/NAA or NAA/Cr in the T2 lesion (Kruskal–Wallis; p > 0.05). Note that the tumor voxels with a very low NAA were excluded from the analysis. Between 3T short and long MRSI, there were statistically significant differences in the levels of Cho/NAA in the NAWM and T2 lesion when comparing voxel by voxel (18 patients; p < 0.0001 and 0.0009, signed rank). Box plots of Cho/Cr, NAA/Cr, and Cho/NAA within the T2 lesion and NAWM are shown in Figure 2. The differences in relative levels of Cho, Cr, and NAA reflect differences in T2 relaxation times between tissue types and field strengths. The median levels of Cho/NAA were 0.53 vs 0.23 (T2 lesion vs NAWM), 0.41 vs 0.23, and 0.31 vs 0.16 for 3T long TE, 3T short TE, and 7T short TE MRSI, respectively. The finding of increased contrast for long TE MRSI compared to that of short TE MRSI is consistent with our previous findings.20 Although the metabolite ratios obtained from 7T short TE MRSI were smaller overall, the contrast between NAWM and the T2 lesion was preserved. Future studies should perform voxel by voxel analysis between 3T and 7T acquisitions to understand the changes in T2 relaxation times within the T2 lesions.
Figure 2.
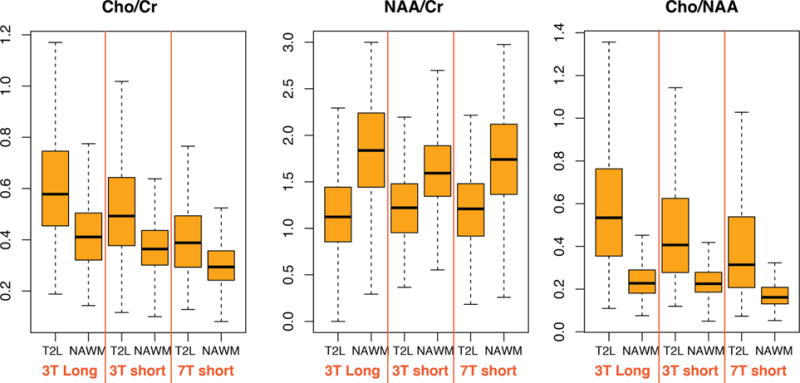
Box plots of Cho/Cr, NAA/Cr, and Cho/NAA from the T2 lesion and NAWM that were acquired with 3T long TE, 3T short TE, and 7T short TE MRSI.
Figure 3 shows examples of MRSI (a) within regions of metabolically active tumor, (b) the treatment effect, and (c) NAWM for patients with glioma. Signal intensities are higher at short TE, but there was also more lipid contamination, which may cause ambiguities in using lipid as a marker of necrosis. In this study, we applied both spectrally selective inversion recovery25 and multiple OVS bands for lipid suppression. The levels of normalized LL (lipid and lactate) calculated from metabolite peak heights divided by the median of NAA in the NAWM were −0.03 ± 0.03 and 0.08 ± 0.09 in the NAWM during 3T long TE and short TE MRSI, respectively. Despite using more conservative methods for acquisition, there were more signals from lipid at short TE. Given that the presence of lipid and lactate is an important factor for predicting the outcome, the use of long TE MRSI may be preferred for patients with glioblastoma.
Figure 3.
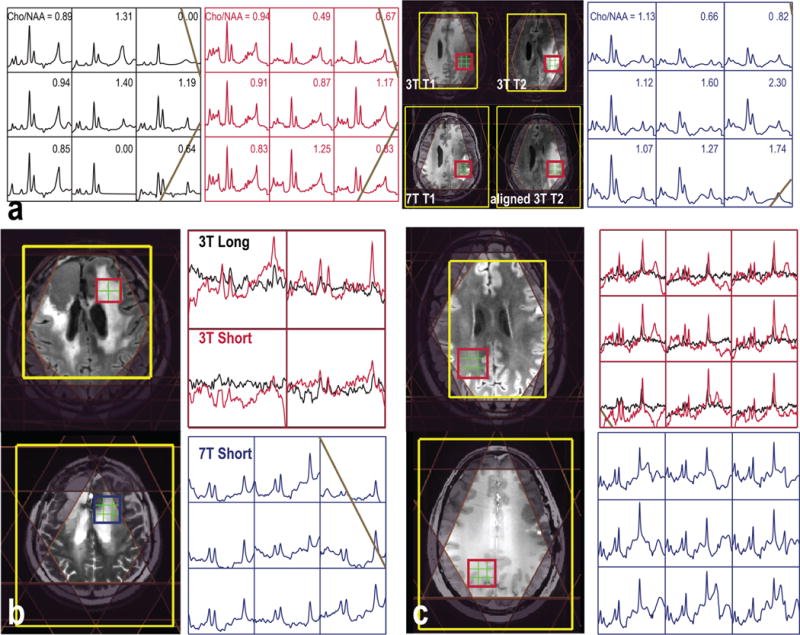
Examples of 3D MRSI data sets that were quantified (a) using LCModel or (b and c) with the baseline not removed before LCModel quantification from patients with (a) grade 4 and (b and c) grade 2 glioma.
The percentages of voxels with CRLB ≤ 20 for Glu, Glx, mI, mIG, GSH, and GABA that were quantified using LCModel are listed in Table 1. The numbers of voxels with a lower CRLB for Glu and mI are larger from data acquired with 7T short TE MRSI than from those acquired at 3T. This is consistent with the increase in field strength providing an increase in SNR and improved spectral quantification.14,15 This offers the opportunity for investigation of a larger range of metabolites in patients with glioma. The information from metabolites other than Cho, Cr, and NAA may be useful for evaluating disease processes and for directing subsequent treatment.
Table 1.
Percent of Voxels with CRLB ≤ 20% within the NAWM for Short TE MRSI at 3T and 7T
| 3T | 7T | |
|---|---|---|
| Glu | 67.3% | 85.0% |
| Glx | 77.1% | 92.2% |
| mI | 52.8% | 78.7% |
| mIG | 90.5% | 80.5% |
| GABA | 6.0% | 65.5% |
Patients recruited to this study were at different stages of disease and had received previous treatment. The 90% confidence intervals of metabolite ratios in the NAWM and T2 lesions from the patients were summarized in Table 2. Compared to those in the NAWM, the variations in the T2 lesion were larger for all of the metabolites. This is consistent with the anatomic lesion corresponding to a mixture of edema, gliosis, inflammation, and active tumor. Glu is the main neurotransmitter in the brain and has been found to be inversely correlated to the presence of isocitrate dehydrogenase (IDH) mutation,10 and there was no difference in the levels of Glu/Cr and Glx/Cr. The levels of mI/Cr and mIG/Cr obtained from 3T short TE MRSI were statistically significantly higher in the T2 lesion than in the NAWM in patients with lower-grade glioma (p = 0.002 and 0.015, respectively). mI is predominately located within the glial cells and has been suggested as a marker for glia. Being able to use these metabolites to distinguish between regions of tumor that are metabolically active or correspond to treatment-related effects is likely to be very important for evaluating treatment effects in patients. Although no significance was found between stable and progressive disease in this study (15 vs 5 patients), future studies will increase the number of patients to examine the value of these metabolic markers and to assess more complicated models.
Table 2.
Metabolite Ratios (90% confidence interval of the mean) Quantified Using LCModel
| low-grade T2L | high-grade T2L | NAWM | ||
|---|---|---|---|---|
| Cho/Cr | 3T long | 0.32–0.56 | 0.42–0.59 | 0.34–0.44 |
| 3T short | 0.39–0.58 | 0.33–0.53 | 0.35–0.38 | |
| 7T short | 0.26–0.45 | 0.26–0.45 | 0.27–0.31 | |
| NAA/Cr | 3T long | 0.70–1.22 | 1.10–1.54 | 1.35–1.71 |
| 3T short | 0.86–1.21 | 1.10–1.25 | 1.43–1.56 | |
| 7T short | 0.49–1.34 | 0.90–1.44 | 1.29–1.65 | |
| Cho/NAA | 3T long | 0.37–0.59 | 0.25–0.55 | 0.23–0.27 |
| 3T short | 0.35–0.62 | 0.24–0.49 | 0.22–0.26 | |
| 7T short | 0.23–0.62 | 0.02–1.01 | 0.17–0.21 | |
| Glu/Cr | 3T short | 1.13–1.61 | 1.13–1.38 | 1.21–1.29 |
| 7T short | 1.10–1.60 | 0.94–1.18 | 1.02–1.25 | |
| Glx/Cr | 3T short | 1.52–1.80 | 1.35–1.64 | 1.49–1.56 |
| 7T short | 0.35–1.58 | 1.17–1.47 | 1.08–1.18 | |
| mI/Cr | 3T short | 1.06–1.27 | 0.75–1.05 | 0.83–0.93 |
| 7T short | 0.54–0.93 | 0.53–0.95 | 0.55–0.71 | |
| mIG/Cr | 3T short | 1.00–1.34 | 0.78–0.94 | 0.77–0.87 |
| 7T short | 0.59–1.09 | 0.54–0.89 | 0.67–0.92 |
Several molecular markers, such as IDH mutation,26,27 have been recently identified as predictors of survival in patients with glioma. The oncometabolite 2-hydroxyglutarate, which is produced because of the presence of IDH mutation,28 can be non-invasively detected using specific acquisition methodologies at both 3T and 7T.29–32 Although 2HG was included in the basis set for quantification to prevent its presence contaminating other measurements, the IDH status of the patients in the study was unknown, and hence, we did not attempt to perform analysis of 2HG levels in this study.
In conclusion, this study has evaluated metabolite profiles in patients with gliomas acquired with different TE and field strengths. Changes in T2 relaxation times caused differences in contrast for metabolite ratios between the three acquisition strategies. If the contrast between tumor and normal tissue is the primary consideration, conventional long TE MRSI at 3T gave the best and most reliable results for evaluating Cho and NAA. It is also the only method that when combined with spectral editing allows separate detection of lactate and lipid. As these are important for predicting the outcome in patients with high-grade glioma, long TE MRSI at 3T would be preferred as the most robust method for these subjects. For short TE acquisitions, there is a compromise between improved metabolite detection at 7T versus improved coverage and a reduced level of lipid contamination at 3T. This means that the lower field strength may be preferred for serial studies of large, heterogeneous tumors, while the higher field may be more relevant for smaller lesions.
METHODS
Twenty patients with glioma (16 males and 4 females, median age of 45 years) who were at different clinical stages were recruited for this study. Tumor grade had been established by histological examinations of tissue samples obtained during biopsy or surgical resection: 11 had grade 2, 3 grade 3, and 6 grade 4 lesions. All the patients were being followed by the Neuro-Oncology service at the University of California San Francisco (UCSF) using RANO criteria.33,34 Fifteen of the patients were recurrent with 10 patients having stable disease, and five had newly diagnosed glioma with stable disease. Each participant was given written informed consent in accordance with the UCSF IRB procedures and had both 3T and 7T MR scans on the same day with a brief rest between the two scans.
MR scans were performed using an eight-channel receive-only phased array coil or a 32-channel receive-only array with a volume transmit head coil (NOVA Medical, Wilmington, MA) on 3T MR750 or 7T MR950 scanners (GE Healthcare, Waukesha, WI).
The MR protocol included the acquisition of anatomical and spectroscopic imaging data. Anatomic MR images were composed of (1) T1-weighted 3D spoiled gradient echo (SPGR) [pre- and postcontrast at 3T; repetition time (TR), TE, and inversion time (TI) of 6.6, 1, and 450 ms at 3T and 6, 2, and 600 ms at 7T, respectively; matrix size of 512 × 512 × 120 at 3T and 256 × 256 × 192 at 7T; voxel size of 0.5 mm × 0.5 mm × 1.5 mm at 3T and 1 mm × 1 mm × 1 mm at 7T], (2) T2-weighted [3D fluid attenuated inversion recovery at 3T: TR, TE, and TI of 6250, 139, and 1699 ms, respectively; matrix size of 512 × 512 × 156; voxel size of 0.5 cm × 0.5 cm × 1.2 cm; 2D fast spin echo at 7T: TR, TE, and TI of 6000, 86, and 600 ms, respectively; matrix size of 512 × 512; field of view (FOV) of 241 mm × 241 mm; 19–21 slices; slice thickness and gap of 3 and 1 mm, respectively], and (3) proton density-weighted gradient echo images to obtain estimates of coil sensitivities. A bolus of 0.1 mmol of gadolinium diethyltriamine pentaacetic acid (Gd-DTPA) per kilogram of body weight was injected intravenously at a speed of 5 mL/s at 3T.
The manufacturer’s high-order shimming procedure was performed before the spectral acquisition. The parameters used to obtain the 3D H-1 MRSI data are detailed in Table 3. The 3T MRSI data utilized chemical shift selective (CHESS) water suppression, very selective suppression (VSS)35 OVS, and point-resolved spectral selection (PRESS) volume selection with an automatic prescription of both the excitation region and OVS17–19 (TE of 35/144 ms, spectral array of 18 × 18 × 16, nominal spatial resolution of 1 cm3). The 7T MRSI data were localized using a spin echo slice selection that was positioned to cover as much of the T2 lesion as possible with a TE of 30 ms, a spectral array of 18–22 × 8, and a nominal spatial resolution of 1 cm3.16 At 7T, power considerations allowed only eight VSS OVS bands to be applied. Their positions were calculated by using masks of lipids and brain that were generated from T1-weighted images.18 A flyback echo-planar gradient trajectory22 was applied to shorten the acquisition time. At 3T, this was placed in the S/I direction and at 7T in the A/P direction. At 3T, this provided a bandwidth of 988 Hz and a spectral resolution of ∼1.39 Hz per point, and at 7T, this provided a bandwidth of 1916 Hz and ∼1.74 Hz per point after reconstruction from interleaved acquisitions. Of the 20 long TE 3T MRSI sets, three data sets were acquired using lactate editing.36 Of the 20 short TE 3T MRSI sets, 12 data sets were acquired with a matrix of 18 × 22 × 16 and the others with a matrix of 18 × 18 × 16.
Table 3.
MRSI Acquisition Parameters
| long TE 3T | short TE 3T | short TE 7T | |
|---|---|---|---|
| TE | 144 ms | 35 ms | 30 ms |
| TR | 1.25–1.30 s | 1.28–1.30 s | 2 s |
| water suppression | CHESS | CHESS | CHESS |
| lipid suppression | 9 VSS + OCT | 9 VSS + OCT inversion recovery | 9 VSS inversion recovery |
| localization | PRESS | PRESS | spin echo |
| phase encoding | 18 × 18 × 16 | 18 × 18–22 × 16 | 18 × 22 × 8 |
| voxel resolution | 1 cm3 | 1 cm3 | 1 cm3 |
| acquisition time | ∼7 mina | 7–9 min | ∼10 min |
Three data sets were acquired with lactate-edited MRSI, which had a total acquisition time of ∼10 min.
Postprocessing was performed using previously published methodologies.3,16,37,38 The flyback data were (combined and) reordered to a rectilinear grid, followed by processing with phase and frequency corrections individually for each coil. The signals were combined using software developed in-house weighting with coil sensitivities,37 which were determined from the calibration scan. The linewidths of Cho, Cr, and NAA peaks were computed for each voxel. Spectra were then quantified using LCModel.39 Metabolite signals for the basis set were generated using NMR-SCOPE with prior knowledge of chemical shift and J coupling information.40 The phased, fitted, and residual spectra after quantification were then converted to DICOM and visualized using SIVIC to check the quality of the fitting. Only metabolites with Cramer-Rao lower bounds (CRLB) of <10% for Cho, Cr, and NAA and 20% for other resonances were considered in the analysis.
The 3D MRSI data were referenced to the 3D T1-weighted images by assuming that there was no movement between the two acquisitions. The T2-weighted image was aligned to the corresponding 3D SPGR image. Segmentation of the brain was performed automatically on the 3T precontrast 3D SPGR images using a program based on a Markov random field model.41 The segmented white matter mask was then used to identify voxels for normal appearing white matter (NAWM). The masks of the T2 lesions were segmented on the 3T T2-weighted FLAIR images using SmartBrush (BrainLab). The 3T T1-weighted SPGR images were then rigidly registered to the T1-weighted images at 7T (FMRIB Software Library, fsl.fmrib.ox.ac.uk/fsl/fslwiki/FSL), and the corresponding transformation matrix was applied to transfer these regions of interest (ROIs) to the 7T space.
Statistical analyses were performed using R (www.r-project.org) and matlab (Mathworks Inc.). Descriptive statistics of segmented tissue components, MRSI prescription volume, and metabolic profiles were calculated for each type of spectral acquisition. Kruskal–Wallis tests were utilized to determine whether the levels of metabolites differed among three acquisitions. Then Wilcoxon signed-rank tests or rank-sum tests were used to test the differences between short and long TE 3T MRSI or between 3T and 7T short TE MRSI.
Acknowledgments
This work was presented in part at the Annual Meeting of the International Society for Magnetic Resonance in Medicine, Toronto, ON, May 2015. We thank Angela Jakary for assistance in data acquisition.
Funding
This research was supported by National Institutes of Health Grant R01CA127612 and a technology development research grant from GE Healthcare.
Footnotes
ORCID
Yan Li: 0000-0003-2145-2869
Author Contributions
Y.L. performed study design, sequence implementation, and data analysis and wrote the first draft of the manuscript. M.L. performed data acquisition and image segmentation. S.C. referred patients for the study. S.J.N. set up MRSI processing scripts and oversaw the project. All co-authors contributed to interpretation of results and approved the manuscript.
Notes
The authors declare no competing financial interest.
References
- 1.Ostrom QT, Gittleman H, Fulop J, Liu M, Blanda R, Kromer C, Wolinsky Y, Kruchko C, Barnholtz-Sloan JS. CBTRUS Statistical Report: Primary Brain and Central Nervous System Tumors Diagnosed in the United States in 2008–2012. Neuro-Oncology (Cary NC, U S) 2015;17(Suppl 4):iv1–iv62. doi: 10.1093/neuonc/nov189. [DOI] [PMC free article] [PubMed] [Google Scholar]
- 2.Stupp R, Mason WP, van den Bent MJ, Weller M, Fisher B, Taphoorn MJ, Belanger K, Brandes AA, Marosi C, Bogdahn U, Curschmann J, Janzer RC, Ludwin SK, Gorlia T, Allgeier A, Lacombe D, Cairncross JG, Eisenhauer E, Mirimanoff RO. Radiotherapy plus concomitant and adjuvant Temozolomide for glioblastoma. N Engl J Med. 2005;352:987–996. doi: 10.1056/NEJMoa043330. [DOI] [PubMed] [Google Scholar]
- 3.Nelson SJ, Li Y, Lupo JM, Olson M, Crane JC, Molinaro A, Roy R, Clarke J, Butowski N, Prados M, Cha S, Chang SM. Serial analysis of 3D H-1 MRSI for patients with newly diagnosed GBM treated with combination therapy that includes bevacizumab. J Neuro-Oncol. 2016;130:171–179. doi: 10.1007/s11060-016-2229-3. [DOI] [PMC free article] [PubMed] [Google Scholar]
- 4.Fulham MJ, Bizzi A, Dietz MJ, Shih HH, Raman R, Sobering GS, Frank JA, Dwyer AJ, Alger JR, Di Chiro G. Mapping of brain tumor metabolites with proton MR spectroscopic imaging: clinical relevance. Radiology. 1992;185:675–686. doi: 10.1148/radiology.185.3.1438744. [DOI] [PubMed] [Google Scholar]
- 5.Nelson SJ, Huhn S, Vigneron DB, Day MR, Wald LL, Prados M, Chang S, Gutin PH, Sneed PK, Verhey L, Hawkins RA, Dillon WP. Volume MRI and MRSI techniques for the quantitation of treatment response in brain tumors: presentation of a detailed case study. Journal of magnetic resonance imaging: JMRI. 1997;7:1146–1152. doi: 10.1002/jmri.1880070630. [DOI] [PubMed] [Google Scholar]
- 6.Preul MC, Caramanos Z, Leblanc R, Villemure JG, Arnold DL. Using pattern analysis of in vivo proton MRSI data to improve the diagnosis and surgical management of patients with brain tumors. NMR Biomed. 1998;11:192–200. doi: 10.1002/(sici)1099-1492(199806/08)11:4/5<192::aid-nbm535>3.0.co;2-3. [DOI] [PubMed] [Google Scholar]
- 7.Li Y, Lupo JM, Parvataneni R, Lamborn KR, Cha S, Chang SM, Nelson SJ. Survival analysis in patients with newly diagnosed glioblastoma using pre- and postradiotherapy MR spectroscopic imaging. Neuro-oncology. 2013;15:607–617. doi: 10.1093/neuonc/nos334. [DOI] [PMC free article] [PubMed] [Google Scholar]
- 8.Park I, Tamai G, Lee MC, Chuang CF, Chang SM, Berger MS, Nelson SJ, Pirzkall A. Patterns of recurrence analysis in newly diagnosed glioblastoma multiforme after three-dimensional conformal radiation therapy with respect to pre-radiation therapy magnetic resonance spectroscopic findings. Int J Radiat Oncol, Biol, Phys. 2007;69:381–389. doi: 10.1016/j.ijrobp.2007.03.019. [DOI] [PMC free article] [PubMed] [Google Scholar]
- 9.Nelson SJ, Kadambi AK, Park I, Li Y, Crane J, Olson M, Molinaro A, Roy R, Butowski N, Cha S, Chang S. Association of early changes in 1H MRSI parameters with survival for patients with newly diagnosed glioblastoma receiving a multimodality treatment regimen. Neuro-Oncology (Cary, NC, U S) 2017;19:430–439. doi: 10.1093/neuonc/now159. [DOI] [PMC free article] [PubMed] [Google Scholar]
- 10.Jalbert LE, Elkhaled A, Phillips JJ, Neill E, Williams A, Crane JC, Olson MP, Molinaro AM, Berger MS, Kurhanewicz J, Ronen SM, Chang SM, Nelson SJ. Metabolic Profiling of IDH Mutation and Malignant Progression in Infiltrating Glioma. Sci Rep. 2017;7:44792. doi: 10.1038/srep44792. [DOI] [PMC free article] [PubMed] [Google Scholar]
- 11.Elkhaled A, Jalbert L, Constantin A, Yoshihara HA, Phillips JJ, Molinaro AM, Chang SM, Nelson SJ. Characterization of metabolites in infiltrating gliomas using ex vivo (1) H high-resolution magic angle spinning spectroscopy. NMR Biomed. 2014;27:578–593. doi: 10.1002/nbm.3097. [DOI] [PMC free article] [PubMed] [Google Scholar]
- 12.Srinivasan R, Phillips JJ, Vandenberg SR, Polley MY, Bourne G, Au A, Pirzkall A, Cha S, Chang SM, Nelson SJ. Ex vivo MR spectroscopic measure differentiates tumor from treatment effects in GBM. Neuro-oncology. 2010;12:1152–1161. doi: 10.1093/neuonc/noq075. [DOI] [PMC free article] [PubMed] [Google Scholar]
- 13.Otazo R, Mueller B, Ugurbil K, Wald L, Posse S. Signal-to-noise ratio and spectral linewidth improvements between 1.5 and 7 T in proton echo-planar spectroscopic imaging. Magn Reson Med. 2006;56:1200–1210. doi: 10.1002/mrm.21067. [DOI] [PubMed] [Google Scholar]
- 14.Mekle R, Mlynarik V, Gambarota G, Hergt M, Krueger G, Gruetter R. MR spectroscopy of the human brain with enhanced signal intensity at ultrashort echo times on a clinical platform at 3T and 7T. Magn Reson Med. 2009;61:1279–1285. doi: 10.1002/mrm.21961. [DOI] [PubMed] [Google Scholar]
- 15.Terpstra M, Cheong I, Lyu T, Deelchand DK, Emir UE, Bednarik P, Eberly LE, Oz G. Test-retest reproducibility of neurochemical profiles with short-echo, single-voxel MR spectroscopy at 3T and 7T. Magn Reson Med. 2016;76:1083–1091. doi: 10.1002/mrm.26022. [DOI] [PMC free article] [PubMed] [Google Scholar]
- 16.Li Y, Larson P, Chen AP, Lupo JM, Ozhinsky E, Kelley D, Chang SM, Nelson SJ. Short-echo three-dimensional H-1 MR spectroscopic imaging of patients with glioma at 7 T for characterization of differences in metabolite levels. Journal of magnetic resonance imaging: JMRI. 2015;41:1332–1341. doi: 10.1002/jmri.24672. [DOI] [PMC free article] [PubMed] [Google Scholar]
- 17.Ozhinsky E, Vigneron DB, Chang SM, Nelson SJ. Automated prescription of oblique brain 3D magnetic resonance spectroscopic imaging. Magn Reson Med. 2013;69:920–930. doi: 10.1002/mrm.24339. [DOI] [PMC free article] [PubMed] [Google Scholar]
- 18.Ozhinsky E, Vigneron DB, Nelson SJ. Improved spatial coverage for brain 3D PRESS MRSI by automatic placement of outer-volume suppression saturation bands. Journal of magnetic resonance imaging: JMRI. 2011;33:792–802. doi: 10.1002/jmri.22507. [DOI] [PMC free article] [PubMed] [Google Scholar]
- 19.Bian W, Li Y, Crane JC, Nelson SJ. Fully automated atlas-based method for prescribing 3D PRESS MR spectroscopic imaging: Toward robust and reproducible metabolite measurements in human brain. Magn Reson Med. 2017 doi: 10.1002/mrm.26718. n/a. [DOI] [PMC free article] [PubMed] [Google Scholar]
- 20.Li Y, Srinivasan R, Ratiney H, Lu Y, Chang SM, Nelson SJ. Comparison of T(1) and T(2) metabolite relaxation times in glioma and normal brain at 3T. Journal of magnetic resonance imaging: JMRI. 2008;28:342–350. doi: 10.1002/jmri.21453. [DOI] [PMC free article] [PubMed] [Google Scholar]
- 21.Li Y, Xu D, Ozturk-Isik E, Lupo JM, Chen AP, Vigneron DB, Nelson SJ. T1 and T2 metabolite relaxation times in normal brain at 3T and 7T. J Mol Imaging Dyn. 2013;S1:002. [Google Scholar]
- 22.Cunningham CH, Vigneron DB, Chen AP, Xu D, Nelson SJ, Hurd RE, Kelley DA, Pauly JM. Design of flyback echo-planar readout gradients for magnetic resonance spectroscopic imaging. Magn Reson Med. 2005;54:1286–1289. doi: 10.1002/mrm.20663. [DOI] [PubMed] [Google Scholar]
- 23.Shen J, Rycyna RE, Rothman DL. Improvements on an in vivo automatic shimming method [FASTERMAP] Magn Reson Med. 1997;38:834–839. doi: 10.1002/mrm.1910380521. [DOI] [PubMed] [Google Scholar]
- 24.Pan JW, Lo KM, Hetherington HP. Role of very high order and degree B0 shimming for spectroscopic imaging of the human brain at 7 T. Magn Reson Med. 2012;68:1007–1017. doi: 10.1002/mrm.24122. [DOI] [PMC free article] [PubMed] [Google Scholar]
- 25.Balchandani P, Spielman D. Fat suppression for 1H MRSI at 7T using spectrally selective adiabatic inversion recovery. Magn Reson Med. 2008;59:980–988. doi: 10.1002/mrm.21537. [DOI] [PMC free article] [PubMed] [Google Scholar]
- 26.Parsons DW, Jones S, Zhang X, Lin JC, Leary RJ, Angenendt P, Mankoo P, Carter H, Siu IM, Gallia GL, Olivi A, McLendon R, Rasheed BA, Keir S, Nikolskaya T, Nikolsky Y, Busam DA, Tekleab H, Diaz LA, Jr, Hartigan J, Smith DR, Strausberg RL, Marie SK, Shinjo SM, Yan H, Riggins GJ, Bigner DD, Karchin R, Papadopoulos N, Parmigiani G, Vogelstein B, Velculescu VE, Kinzler KW. An integrated genomic analysis of human glioblastoma multiforme. Science. 2008;321:1807–1812. doi: 10.1126/science.1164382. [DOI] [PMC free article] [PubMed] [Google Scholar]
- 27.Yan H, Parsons DW, Jin G, McLendon R, Rasheed BA, Yuan W, Kos I, Batinic-Haberle I, Jones S, Riggins GJ, Friedman H, Friedman A, Reardon D, Herndon J, Kinzler KW, Velculescu VE, Vogelstein B, Bigner DD. IDH1 and IDH2 mutations in gliomas. N Engl J Med. 2009;360:765–773. doi: 10.1056/NEJMoa0808710. [DOI] [PMC free article] [PubMed] [Google Scholar]
- 28.Dang L, White DW, Gross S, Bennett BD, Bittinger MA, Driggers EM, Fantin VR, Jang HG, Jin S, Keenan MC, Marks KM, Prins RM, Ward PS, Yen KE, Liau LM, Rabinowitz JD, Cantley LC, Thompson CB, Vander Heiden MG, Su SM. Cancer-associated IDH1 mutations produce 2-hydroxyglutarate. Nature. 2009;462:739–744. doi: 10.1038/nature08617. [DOI] [PMC free article] [PubMed] [Google Scholar]
- 29.Berrington A, Voets NL, Plaha P, Larkin SJ, McCullagh J, Stacey R, Yildirim M, Schofield CJ, Jezzard P, Cadoux-Hudson T, Ansorge O, Emir UE. Improved localisation for 2-hydroxyglutarate detection at 3T using long-TE semi-LASER. Tomography: A Journal for Imaging Research. 2016;2:94–105. doi: 10.18383/j.tom.2016.00139. [DOI] [PMC free article] [PubMed] [Google Scholar]
- 30.Emir UE, Larkin SJ, de Pennington N, Voets N, Plaha P, Stacey R, Al-Qahtani K, McCullagh J, Schofield CJ, Clare S, Jezzard P, Cadoux-Hudson T, Ansorge O. Noninvasive Quantification of 2-Hydroxyglutarate in Human Gliomas with IDH1 and IDH2Mutations. Cancer Res. 2016;76:43–49. doi: 10.1158/0008-5472.CAN-15-0934. [DOI] [PMC free article] [PubMed] [Google Scholar]
- 31.Choi C, Ganji SK, DeBerardinis RJ, Hatanpaa KJ, Rakheja D, Kovacs Z, Yang XL, Mashimo T, Raisanen JM, Marin-Valencia I, Pascual JM, Madden CJ, Mickey BE, Malloy CR, Bachoo RM, Maher EA. 2-hydroxyglutarate detection by magnetic resonance spectroscopy in IDH-mutated patients with gliomas. Nat Med. 2012;18:624–629. doi: 10.1038/nm.2682. [DOI] [PMC free article] [PubMed] [Google Scholar]
- 32.Andronesi OC, Rapalino O, Gerstner E, Chi A, Batchelor TT, Cahill DP, Sorensen AG, Rosen BR. Detection of oncogenic IDH1 mutations using magnetic resonance spectroscopy of 2-hydroxyglutarate. J Clin Invest. 2013;123:3659–3663. doi: 10.1172/JCI67229. [DOI] [PMC free article] [PubMed] [Google Scholar]
- 33.van den Bent MJ, Wefel JS, Schiff D, Taphoorn MJ, Jaeckle K, Junck L, Armstrong T, Choucair A, Waldman AD, Gorlia T, Chamberlain M, Baumert BG, Vogelbaum MA, Macdonald DR, Reardon DA, Wen PY, Chang SM, Jacobs AH. Response assessment in neuro-oncology (a report of the RANO group): assessment of outcome in trials of diffuse low-grade gliomas. Lancet Oncol. 2011;12:583–593. doi: 10.1016/S1470-2045(11)70057-2. [DOI] [PubMed] [Google Scholar]
- 34.Wen PY, Macdonald DR, Reardon DA, Cloughesy TF, Sorensen AG, Galanis E, Degroot J, Wick W, Gilbert MR, Lassman AB, Tsien C, Mikkelsen T, Wong ET, Chamberlain MC, Stupp R, Lamborn KR, Vogelbaum MA, van den Bent MJ, Chang SM. Updated response assessment criteria for high-grade gliomas: response assessment in neuro-oncology working group. J Clin Oncol. 2010;28:1963–1972. doi: 10.1200/JCO.2009.26.3541. [DOI] [PubMed] [Google Scholar]
- 35.Tran TK, Vigneron DB, Sailasuta N, Tropp J, Le Roux P, Kurhanewicz J, Nelson S, Hurd R. Very selective suppression pulses for clinical MRSI studies of brain and prostate cancer. Magn Reson Med. 2000;43:23–33. doi: 10.1002/(sici)1522-2594(200001)43:1<23::aid-mrm4>3.0.co;2-e. [DOI] [PubMed] [Google Scholar]
- 36.Park I, Chen AP, Zierhut ML, Ozturk-Isik E, Vigneron DB, Nelson SJ. Implementation of 3 T lactate-edited 3D 1H MR spectroscopic imaging with flyback echo-planar readout for gliomas patients. Ann Biomed Eng. 2011;39:193–204. doi: 10.1007/s10439-010-0128-x. [DOI] [PMC free article] [PubMed] [Google Scholar]
- 37.Li Y, Osorio JA, Ozturk-Isik E, Chen AP, Xu D, Crane JC, Cha S, Chang S, Berger MS, Vigneron DB, Nelson SJ. Considerations in applying 3D PRESS H-1 brain MRSI with an eight-channel phased-array coil at 3 T. Magn Reson Imaging. 2006;24:1295–1302. doi: 10.1016/j.mri.2006.07.012. [DOI] [PubMed] [Google Scholar]
- 38.Nelson SJ. Analysis of volume MRI and MR spectroscopic imaging data for the evaluation of patients with brain tumors. Magn Reson Med. 2001;46:228–239. doi: 10.1002/mrm.1183. [DOI] [PubMed] [Google Scholar]
- 39.Provencher SW. Estimation of metabolite concentrations from localized in vivo proton NMR spectra. Magn Reson Med. 1993;30:672–679. doi: 10.1002/mrm.1910300604. [DOI] [PubMed] [Google Scholar]
- 40.Govindaraju V, Young K, Maudsley AA. Proton NMR chemical shifts and coupling constants for brain metabolites. NMR Biomed. 2000;13:129–153. doi: 10.1002/1099-1492(200005)13:3<129::aid-nbm619>3.0.co;2-v. [DOI] [PubMed] [Google Scholar]
- 41.Zhang Y, Brady M, Smith S. Segmentation of brain MR images through a hidden Markov random field model and the expectation-maximization algorithm. IEEE transactions on medical imaging. 2001;20:45–57. doi: 10.1109/42.906424. [DOI] [PubMed] [Google Scholar]