Abstract
Radiologists play a central role in the assessment of patient response to locoregional therapies for hepatocellular carcinoma (HCC). The identification of viable tumor following treatment guides further management and potentially affects transplantation eligibility. Liver Imaging Reporting and Data Systems (LI-RADS) first introduced the concept of LR-Treated in 2014, and a new Treatment Response Algorithm is included in the 2017 update to assist radiologists in image interpretation of HCC after locoregional therapy. In addition to offering imaging criteria for viable and nonviable HCC, new concepts of nonevaluable tumors as well as tumors with equivocal viability are introduced. Existing guidelines provided by Response Evaluation Criteria In Solid Tumors (RECIST) and modified RECIST address patient-level assessments and are routinely used in clinical trials but do not address the variable appearances following different locoregional therapies. The new LI-RADS Treatment Response Algorithm addresses this gap and offers a comprehensive approach to assess treatment response for individual lesions after a variety of locoregional therapies, using either contrast-enhanced CT or MRI.
Keywords: LI-RADS, Hepatocellular Carcinoma, Locoregional Therapy, Response, RECIST
Introduction
The Liver Imaging Reporting and Data Systems (LI-RADS), like other diagnostic algorithms, provides essential imaging criteria for the diagnosis of untreated liver observations. It was originally released by the American College of Radiology in 2011. A new category called “LR-Treated” was subsequently introduced in version 2014 (v2014) to identify lesions that have undergone liver-directed therapies and for which the diagnostic algorithm for categorization should not be applied. LI-RADS v2014, however, did not provide guidance for the assessment of viability of treated lesions. In order to address this gap, the Tumor Response Working Group (TRWG) was formed in 2014 with the charge of expanding content related to the LR-Treated category based on best available evidence and expert consensus. The TRWG is comprised of both diagnostic and interventional radiologists as well as many members of the LI-RADS Steering Committee. The TRWG created a new Treatment Response Algorithm for LI-RADS version 2017 (v2017) that provides guidance for the interpretation of imaging findings after locoregional therapies.
This new algorithm takes into consideration that patients with hepatocellular carcinoma (HCC) often undergo locoregional therapies for curative intent, as a bridge to liver transplantation, or for the treatment of advanced disease. In addition to tumor stage, the choice of therapy is often influenced by patient factors, institutional preference, equipment availability, and expertise. As a result, practice patterns can differ widely. CT and MR imaging are routinely used to assess treatment response following therapy, identify new lesions, and guide further management. While Response Evaluation Criteria In Solid Tumors (RECIST) and modified RECIST (mRECIST) serve as reference standards for treatment response assessment in clinical trials for HCC, they have not been routinely adopted in clinical practice and current transplantation policies (UNOS/OPTN policy 3.6.4.4) defer on this topic. Similar to the main charge of LI-RADS, the TRWG aims to improve consistency and standardization in reporting and define a lexicon for use in the setting of response assessment. In this review article, we provide background information on the mechanisms of different liver-directed therapies, illustrate typical expected CT and MR appearances after locoregional therapy, and describe the new LI-RADS v2017 Treatment Response Algorithm.
A primer on locoregional therapies
Treatment options for HCC continue to expand, but therapies are generally grouped into loco-ablative and transcatheter tumor therapies. Other treatments for HCC include external beam radiotherapy (EBRT), which can be considered a locoregional therapy, and systemic therapies, such as sorafenib. Radiologists should become familiar with principles of loco-ablative and transcatheter therapies, since they produce predictable changes in the appearance of the treated mass and surrounding tissue.
A unified approach to the terminology of loco-ablative therapies was released in 2014 by the International Working Group on Image Guided Tumor Ablation, Interventional Oncology Sans Frontières Expert Panel, Technology Assessment Committee of the Society of Interventional Radiology, and the Standard of Practice Committee of the Cardiovascular and Interventional Radiological Society of Europe [1]. Such therapies are categorized as chemical ablations (i.e. percutaneous ethanol ablation) or energy-based ablations (Table 1). Radiofrequency ablation (RFA), microwave ablation (MWA), and cryoablation, represent thermal therapies whereas non-thermal therapies include irreversible electroporation [2] and high intensity focused ultrasound ablation, which are still under investigation for the treatment of HCC.
Table 1.
Overview of Locoregional Therapies
| Name | Definition |
|---|---|
| Radiofrequency Ablation (RFA) | Thermal ablative technique that creates heat with medium frequency alternating current (in the range of 350–500 kHz) to destroy cancerous cells [34]. |
| Microwave Ablation (MWA) | Thermal ablative technique using electromagnetic waves at 900 or 2450 mHz. Cell death is achieved through the repeated application of short duration high-voltage electrical pulses that create irreversible injuries to cellular membranes [1]. |
| Cryoablation | Thermal ablative technique in which inserted probes are used to cause rapid gas expansion, generating subzero cytotoxic temperatures leading to cell death through repeated freeze-thaw cycles. |
| Ethanol Ablation (PEA) | Image-guided direct injection of ethanol into a mass in order to effect chemically-induced coagulation necrosis of the tumor in situ. |
| Embolization (TAE) | Selective intra-arterial infusion of embolic agent (e.g. microspheres, polyvinyl alcohol, gelfoam) into the branch(es) of the hepatic artery supplying the targeted tumor(s) in order to obstruct their blood flow, with the goal of inducing ischemia and necrosis. |
| Conventional Chemoembolization (TACE) | Selective intra-arterial infusion of a suspension consisting of one or more chemotherapeutic agents with ethiodized oil and an embolic agent [3]. |
| Drug-eluting beads chemoembolization (DEB-TACE) | Selective intra-arterial administration of microspheres onto which chemotherapeutic medication is loaded or adsorbed with the intention of delivering a sustained in vivo release of drug while decreasing or obstructing the blood flow to the tumor(s) [3]. |
| Radioembolization (TARE) | Selective intra-arterial infusion of radioactive microspheres into the arterial supply of a tumor with the goal of delivering a high dose of focused radiation to the tumor. |
| External Beam Radiation Therapy (EBRT) | Delivery of focused x-ray beams (or other particle beams at some centers) from external sources to targeted tumor and its margins. Hypofractionated, high-dose image-guided EBRT with complex treatment planning, referred to as Stereotactic Body Radiotherapy (SBRT) or Stereotactic Ablative Radiotherapy (SABR), is increasingly used for local control of HCC. |
On the other hand, transcatheter tumor therapy consists of the intra-arterial delivery of therapeutic agents via a catheter placed selectively under image guidance [3]. Transcatheter therapies include chemotherapy-based conventional transarterial chemoembolization (TACE), drug-eluting bead TACE (DEB-TACE), bland transarterial embolization (TAE), and transarterial radioembolization (TARE) (Table 1).
An alternative treatment for HCC, EBRT uses focused radiation beams with x-rays or particles, which are delivered to a targeted tissue volume. Hypofractionated, high dose-per-fraction EBRT using image guidance and complex treatment planning is often referred to as Stereotactic Body Radiotherapy or Stereotactic Ablative Radiotherapy [4]. With EBRT, a therapeutic radiation dose is delivered to the planning target volume, which includes the gross tumor volume and a small volume of liver tissue along the tumor margins [5]. Some normal tissue outside of the planning target volume will also receive subtherapeutic radiation dose as a function of the radiation beam arrangements and treatment plan.
Common to all of these therapies is some degree of damage to the surrounding liver, which may produce perfusional abnormality, injury, fibrosis, or a combination of these. Understanding the appearance of both the treated lesion and the background liver response to therapy is crucial for determining the viability of the treated tumor and will be addressed in the following sections.
Imaging of HCC after locoregional therapy
Multiple imaging modalities are available to assess HCC treatment response, but contrast-enhanced 4-phase CT and dynamic contrast-enhanced MRI are routinely used, with contrast-enhanced ultrasound remaining under investigation for selected HCC treatments (Table 2). Standard CT and MR imaging protocols include unenhanced, late arterial phase, portal venous phase and delayed phase. Unlike pretreatment imaging with CT, a precontrast phase is suggested in the posttreatment setting to allow for identification of hyperdensity related to blood products or embolic material and to facilitate the determination of enhancement. Regardless of the therapy or imaging modality, the major metric for viability is arterial phase hyperenhancement (APHE) and/or washout appearance. In instances where the pretreatment imaging did not demonstrate APHE but showed washout appearance alone or progressive enhancement, response assessment may be challenging.
Table 2.
Imaging Modalities for Post Treatment Response Assessment
| Modality | Summary |
|---|---|
|
| |
| Contrast-Enhanced CT (CECT) | CT multiphasic imaging is required with noncontrast and postcontrast images obtained in the arterial, portal venous, and delayed phases. |
| Multiplanar reconstructions may be helpful, especially for the arterial phase. | |
| Assessment of enhancement may be limited by presence of hyperdense material related to TACE. | |
|
| |
| Contrast-Enhanced MRI (CEMR) | Liver MRI should include volumetric T1-weighted fat suppressed precontrast and dynamic postcontrast imaging in the arterial phase and portal venous phase. Delayed phase imaging should be obtained with extracellular contrast agents, while transitional and hepatobiliary phases can be obtained with hepatobiliary agents. |
| Subtraction imaging is useful to assess arterial phase hyperenhancement in situations where there is T1 hyperintense signal in the treated lesion/area, but should be interpreted with caution in the event of image misregistration between contrast phases. | |
| T2-weighted and diffusion-weighted imaging are routinely acquired and may be helpful in the interpretation of the findings on postcontrast imaging, but are not currently used in tumor response assessment. | |
|
| |
| Contrast-Enhanced Ultrasound (CEUS) | As with CECT and CEMR, treated lesions should have no internal enhancement on CEUS. It is best suited for patients with a single or dominant lesion, and its utility may be limited by lesion location and patient body habitus. |
| CEUS has been used to assess treatment effect immediately post thermal ablation and enables additional ablation in the same treatment session, when indicated [35]. | |
| The echogenicity from iodized oil is minimally seen on CEUS, therefore, CEUS is an alternative to CECT where hyperdense iodized oil limits the utility of CT [36, 37] | |
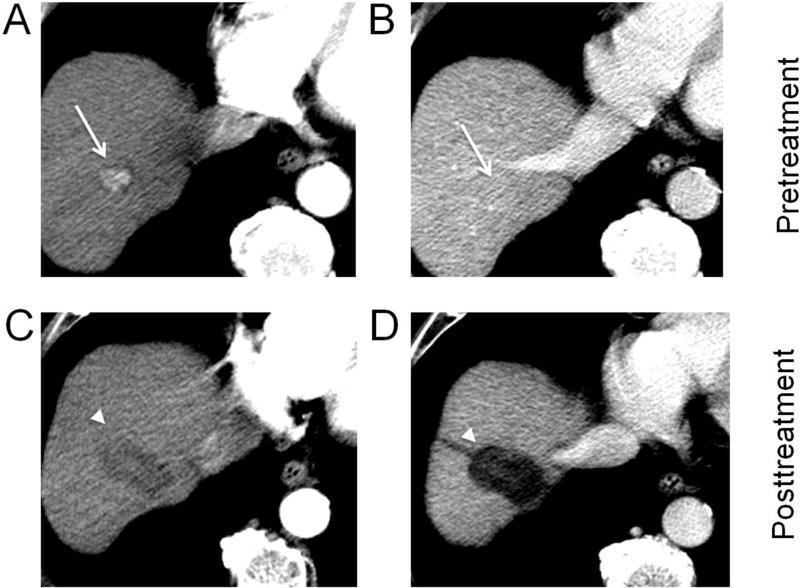
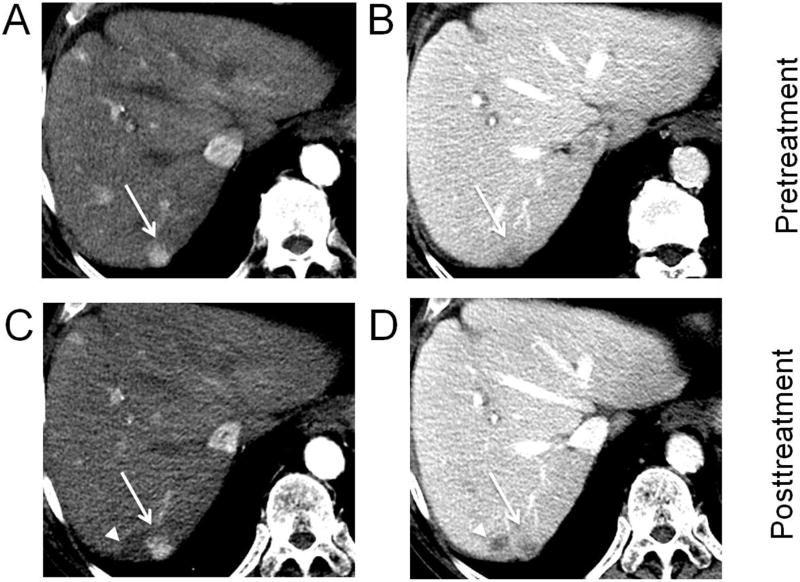
Despite the unifying theme of APHE, it should be mentioned that there are varying post treatment appearances specific to each treatment modality (Tables 3). With RFA and MWA, an ablation zone larger than the pretreatment tumor size should be anticipated, usually 5–10 mm or greater, and no residual enhancement is expected (Figure 1). Recurrent or residual tumor is commonly located along the periphery of an ablation zone and manifests as focal nodular APHE (Figure 2). Imaging in the early period following therapy may show a thin area of enhancement along the periphery of the treatment cavity that resolves by later time points and does not necessarily indicate viability [6].
Table 3.
Expected Appearances After Locoregional Therapies
| Therapy | Expected Posttreatment Findings |
|---|---|
|
| |
| General | A successfully treated tumor typically does not show any enhancement. Viable tumor may be present along the margins of the treated lesion as nodular or mass-like areas of APHE and/or washout. Subtraction imaging may help identify areas of viable tumor when T1 hyperintense blood products are present. |
|
| |
| Radiofrequency Ablation (RFA) and Microwave Ablation (MWA) | After treatment, the ablation zone typically extends beyond the pretreatment tumor border, with usual margins of 5–10 mm beyond the border. For the first 3–6 months post RFA or MWA, a thin, smooth rind of enhancing peripheral liver tissue may be seen. The ablation zone shrinks around 6 months and thereafter. |
| On CT, the area of ablation can be hyperdense centrally and hypodense peripherally on unenhanced images, reflecting coagulative necrosis. On MRI, post ablation blood products may be T1 hyperintense, with variable T2 signal intensity. A transient area of hyperemia in the tissue surrounding the ablated lesion, iatrogenic arterioportal shunting, and small intra-lesional air pockets are frequently seen on immediate follow-up imaging and can lead to pitfalls in interpretation [38]. | |
|
| |
| Cryoablation | After treatment, the ablation zone typically extends beyond the pretreatment tumor border, with usual margins of 5–10 mm beyond the border. A thin rim of peripheral enhancement (reactive hyperemia) may be seen around the ablation zone immediately after cryoablation and can last for up to several months. Ablation zones gradually contract over time and may disappear completely or be associated with focal hepatic atrophy, including focal surface concavity or distortion of parenchymal vascular anatomy[39]. |
| On CT, small gas bubbles can be seen in the ablation zone immediately after treatment and can persist for up to several weeks. This should not be interpreted as infection/abscess if the patient is asymptomatic[40]. | |
|
| |
| Ethanol Ablation (PEA) | The treated area may be the same size or larger than the tumor before treatment. As fibrosis and retraction within the treated area begins several months after treatment, there is a decrease in the size of the treated mass. |
| On noncontrast CT, a treated mass may demonstrate air bubbles several days following treatment if the air was introduced during instillation of ethanol and for up to a month posttreatment if the air is associated with tumor necrosis (particularly if PEA was used as an adjunct to MWA or RFA) [41]. | |
|
| |
| Transarterial Embolization (TAE), Transarterial Chemoembolization (TACE) and Drug eluting beads (DEB)-TACE | After treatment, a thin, smooth, linear rim of enhancement at the margin of the lesion may persist for months to years. Ill-defined regional or geographic hyperenhancement surrounding the treated tumor may be a transient post-procedural finding. |
| For TAE, a noncontrast CT (NCCT) or noncontrast cone beam CT can be performed within 20 minutes of treatment completion to evaluate the postembolization tumor contrast agent retention pattern. Moderate to marked tumor contrast retention with Glisson’s sheath filling or arterial filling without defect in contrast retention is an ideal end point of embolization [42]. | |
| With TACE, areas of oil uptake are often seen on the first follow-up at 4 weeks. Greater oil uptake by the tumor is often associated with higher tumor response rates. However, oil embolic agent (aka lipiodol or ethiodol) often make it difficult to assess enhancement on CT; both oil uptake and nonviable tumor have low signal intensity on contrast-enhanced MRI, with no enhancement on subtraction imaging [43]. | |
| With DEB-TACE, there is transient or no retention of iodinated contrast after treatment, and drug-eluting beads are not visible on MRI [44]. Tiny foci of gas may be a normal post procedural finding for the first few days but should raise concern for infection after 1–2 weeks. | |
|
| |
| Transarterial radioembolization (TARE) | Patchy geographic enhancing regions surrounding the treated tumor can be seen for 1–5 months, most strongly in the arterial phase, mimicking infiltrative tumor. These areas may develop fibrosis and resultant atrophy at later time points. |
| Compared to other intra-arterial therapies TARE is minimally embolic, and tumor enhancement can persist, even in a nodular pattern, on early follow-up imaging. Enhancement of any type (internal, nodular or rim enhancement) may not indicate residual viable tumor and should be interpreted with caution during the first 6 months after treatment [45]. | |
|
| |
| External Beam Radiation Therapy (EBRT) | Typically the tumor gradually decreases in size and enhancement over several months to a year, with or without central necrosis or fibrosis [12]. The appearance of the liver parenchyma around the treated tumor evolves over time from radiation exposure at a subtherapeutic dose: congestive edema, microvascular thrombosis and sinusoidal outflow obstruction (early, < 3 months), chronic hemorrhage and hemosiderosis (~3–6 months); fibrosis, atrophy, and architectural distortion (late, > 6 months). |
Fig. 1. Hepatocellular carcinoma (HCC) treated with radiofrequency ablation.
A biopsy proven HCC in the right hepatic lobe (arrows) shows arterial phase hyperenhancement (A) and no washout on portal venous phase (B). After radiofrequency ablation, an ablation zone (arrowheads) is now visible as a larger defect than the original tumor, with a linear ablation tract along the course of the electrode used (C, D). No residual enhancement is seen, and the lesion should be reported as LR-TR Nonviable.
Fig. 2. Treatment with percutaneous ethanol ablation.
A lesion in segment 7 (arrows) showing arterial phase hyperenhancement (A) and washout on portal venous phase (B) measures 1.3 cm (LR-4). After ethanol ablation (PEA), a nonenhancing ablation zone (arrowheads) is present, but more medially, a nodular area (arrows) of arterial phase hyperenhancement (C) and washout (D), measures 1.5 cm and is consistent with viable tumor (LR-TR Viable 1.5 cm).
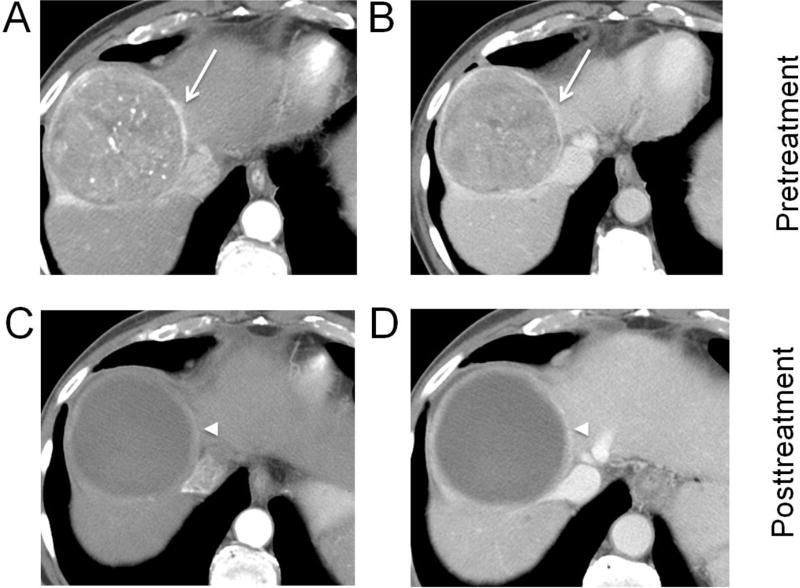
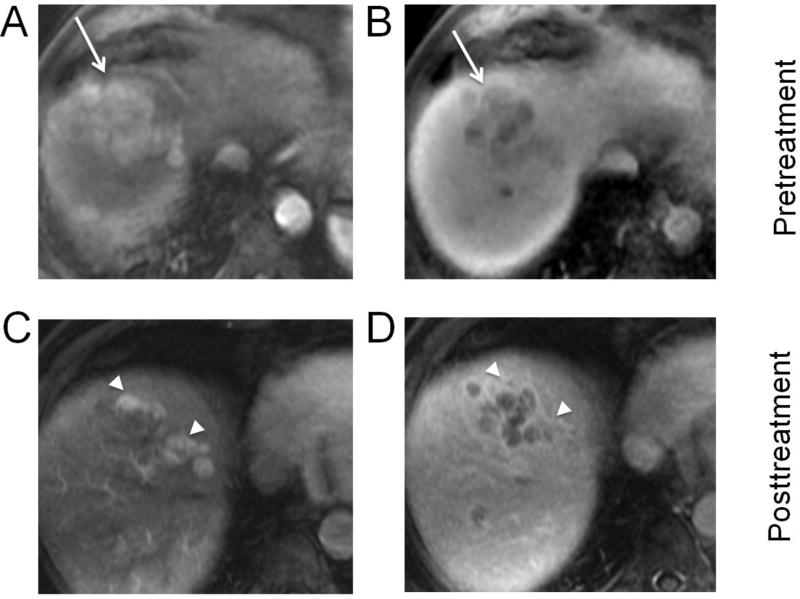
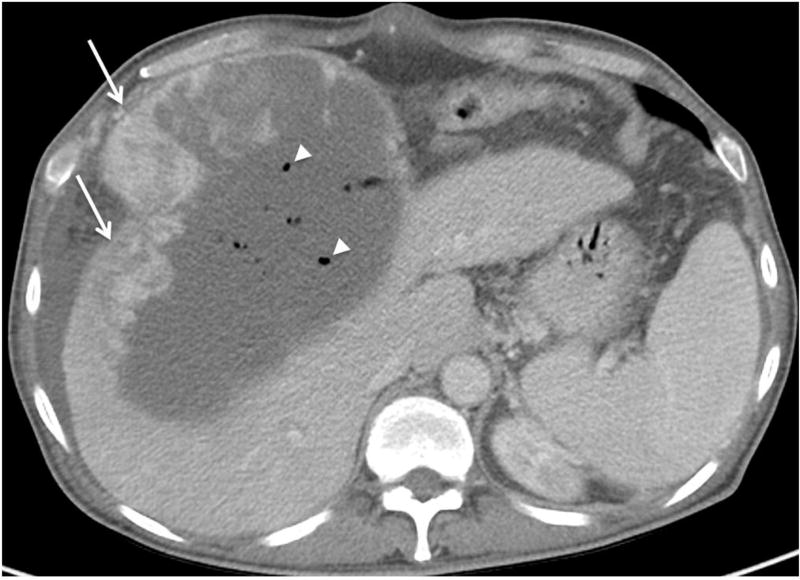
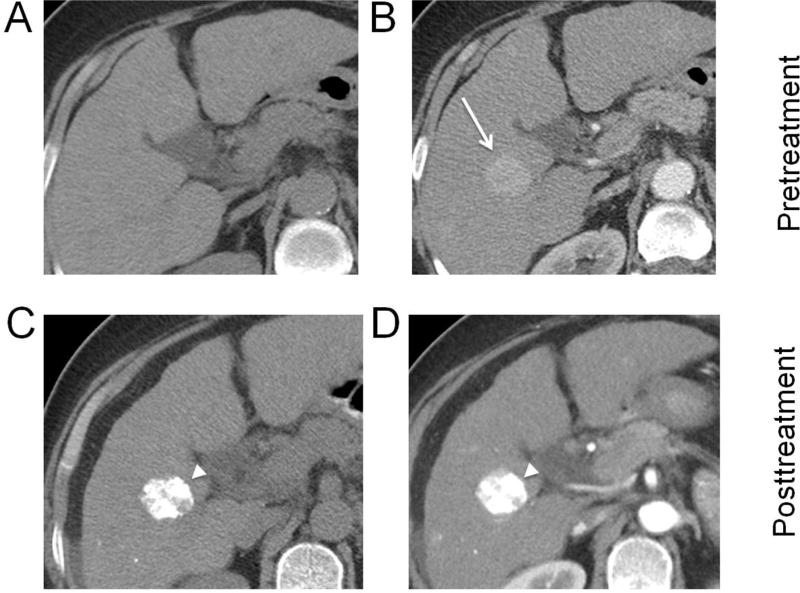
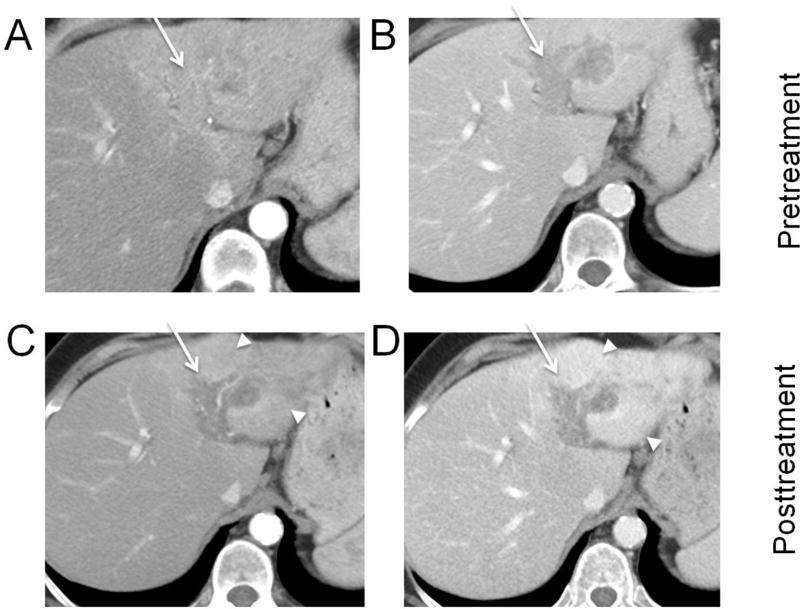
Following transcatheter therapies (TACE, DEB-TACE, or TAE), varying degrees and patterns of response may emerge. In general, the treated tumor is expected to be nonenhancing on all phases. A thin smooth rim of enhancement surrounding a nonenhancing lesion may represent expected posttreatment change (Figure 3) while a nodular thick or mass-like area of APHE indicates viable tumor (Figure 4) [7–10]. Findings specific to transcatheter therapies include the presence of gas (Figure 5) [11] and deposition of hyperdense embolic material representing ethiodol or lipiodol after TACE, which can limit evaluation of posttreatment enhancement with CT (Figure 6).
Fig. 3. Hepatocellular carcinoma (HCC) treated with drug-eluting bead transarterial chemoembolization (DEB-TACE).
Biopsy-proven HCC (arrows) in segment 8 showing arterial phase hyperenhancement (A), washout and capsule on portal venous phase (B). After DEB-TACE, no residual enhancement except for a thin rim of enhancement (arrowheads) is seen on arterial (C) and portal venous phases (D) (LR-TR Nonviable).
Fig. 4. Hepatocellular carcinoma (HCC) treated with transarterial chemoembolization (TACE).
A lesion in segment 8 showing arterial phase hyperenhancement (A) and washout on portal venous phase (B) (arrows), measuring 8.0 cm (LR-5). After TACE, multiple nodular areas (arrowheads) of arterial phase hyperenhancement (C) and washout (D) anteriorly and medially are consistent with viable tumor. The largest nodular area of enhancement without intervening necrosis measures 2.5 cm and the lesion should be reported as: LR-TR Viable 2.5 cm (previously LR-5, 8.0 cm).
Fig. 5. Hepatocellular carcinoma 2 days after treatment with transarterial embolization (TAE).
Foci of gas (arrowheads) are visible on portal venous phase CT within the embolized tumor. This is an early posttreatment expected finding that resolves over a few weeks and should not be confused with infection. Residual nodular enhancement measuring up to 10.1 cm along the right lateral margin (arrows) is consistent with viable tumor (LR-TR Viable 10.1 cm).
Fig. 6. Hepatocellular carcinoma (HCC) treated with transarterial chemoembolization (TACE).
HCC in the right hepatic lobe on precontrast (A) and arterial phase (arrow) (B). After TACE, the presence of lipiodol appears hyperdense (arrowheads) on precontrast (C) and limits evaluation for enhancement on arterial phase imaging (D).
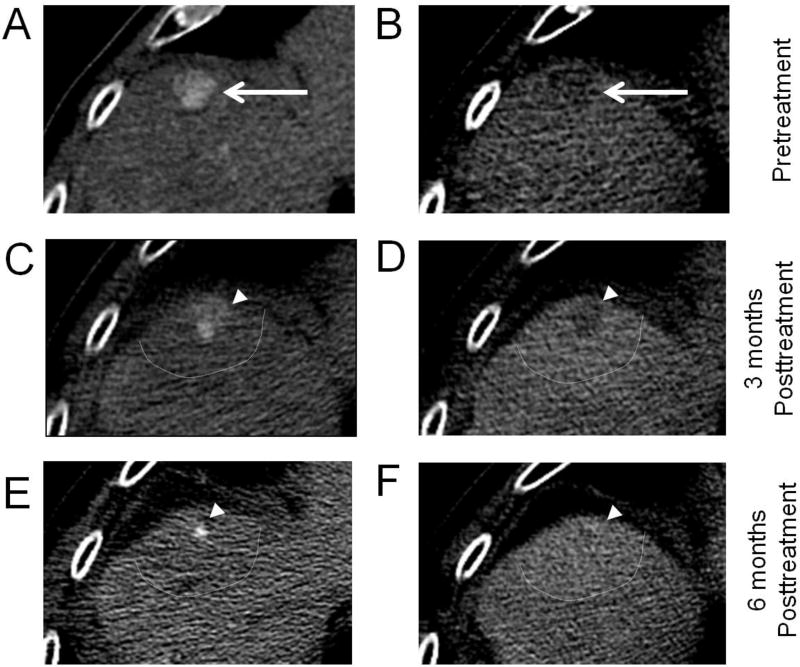
Unlike loco-ablative or other transcatheter therapy, radioembolization and EBRT may not cause rapid tumor size reduction or immediate de-vascularization, with the development of a nonenhancing treatment cavity. Patchy and/or geographic regions of enhancement surrounding the tumor can be seen after TARE, especially in the arterial phase (Figure 7). In the very early postradiation period (~1 month), tumor size and enhancement may transiently increase — a pseudo-progression phenomenon. In the early postradiation period (~3 months), the tumor may retain a typical HCC enhancement pattern: APHE and/or washout may be seen (Figure 8) [12], but these patterns become less conspicuous thereafter, and the tumor eventually becomes isoenhancing or hypoenhancing compared to the surrounding penumbra [13]. The penumbra may demonstrate hyperenhancement in the arterial, portal, and/or delayed phases [14, 15], depending on the degree and phase of tissue injury and repair (fibrosis), which evolve over many months. Eventually, tumor may be replaced by fibrosis, with or without a nonenhancing component. In the late postradiation phase, persistent, delayed hyperenhancement of the surrounding parenchymal fibrosis may mimic a “washout” appearance of the tumor. The appearance following radioembolization may present with a mix between that described with EBRT and transcatheter therapies, due to the combination of an embolic effect (producing more immediate devascularization) and the prolonged effect of the radiation. The response may vary based on the distribution of delivery and the overall tumor burden.
Fig. 7. Hepatocellular carcinoma (HCC) with tumor in vein (arrows), treated with transarterial radioembolization (TARE).
Biopsy-proven HCC in the left hepatic lobe with tumor in vein on arterial phase (A) and portal venous phase (B). One month after TARE, the tumor in vein demonstrates decreased enhancement, but hyperenhancement in the surrounding treated left lateral segment (arrowheads) is visible on both arterial phase (C) and portal venous phase (D). Vague areas of enhancement within the tumor in vein are equivocal for tumor viability (LR-TR Equivocal 4.4 cm).
Fig. 8. Hepatocellular carcinoma (HCC) treated with Stereotactic Body Radiotherapy (SBRT).
Multiphasic contrast-enhanced CT (A,B) demonstrating HCC in the hepatic dome (arrows), segment 4A, with arterial phase hyperenhancement (APHE), washout appearance, and threshold growth since 3 months prior, (LR-5, 1.7 cm). The 3-month post-SBRT follow-up CT (C,D) demonstrates unchanged size of the 1.7-cm tumor (arrowheads), with decreased prominence of APHE and washout appearance (LR-TR Equivocal 1.7 cm). The 6-month post-SBRT follow-up CT (E,F) demonstrates decreased tumor size, 0.5 cm, with persistent APHE and questionable washout appearance (LR-TR Viable 0.5 cm). HCCs after SBRT often demonstrate continued enhancement suggestive of tumor viability, but should be followed by serial imaging as long as the tumor size continues to regress. Note how the irradiated areas of penumbra (bounded by dashed line) shows slight differential enhancement compared to the rest of the liver parenchyma.
The use of subtraction as well as multiplanar reconstructions or acquisitions may be helpful. Treatment may lead to hemorrhage within a mass or deposition of dense material (such as lipiodol), which can make assessment of postcontrast enhancement challenging. Subtraction imaging in MRI may be helpful to discern precontrast bright appearance from true enhancement and to identify areas of necrosis [16]. If the enhancement of viable tumor occurs at the superior or inferior margins of the treated tumor, it may be difficult to detect on axial images alone, requiring careful review of coronal and sagittal reconstructed images. T2-weighted sequences and diffusion-weighted imaging may be of value to detect areas of viable tumor; however, they do not supplant the need to identify enhancement patterns of viable tumor and are currently not included in the LI-RADS Treatment Response Algorithm described below. Assessing response with gadoxetate disodium (Gd-EOB-DTPA) enhanced MRI deserves special mention. Hypointensity on the hepatobiliary phase may be seen with both viable and treated lesions. Furthermore, regional hepatocyte damage surrounding the treated lesion may appear hypointense to normal parenchyma in the hepatobiliary phase and should not be confused for viable HCC [17–19].
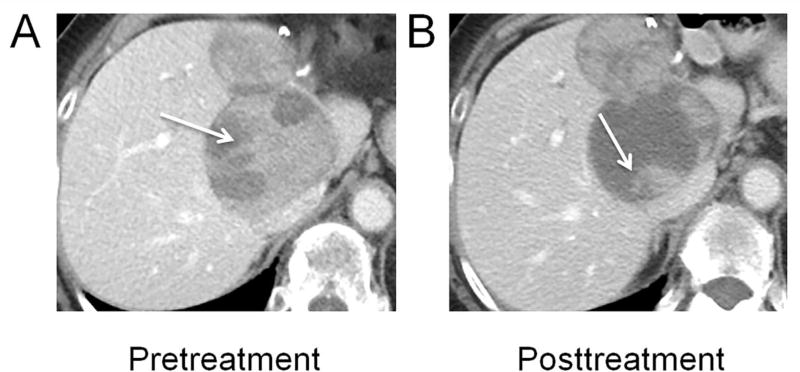
While this review focuses on the imaging appearance after locoregional therapy, radiologists should be aware that combinations of systemic therapies with locoregional therapies, including TACE and TARE, are currently under active investigation for patients with unresectable or advanced HCC [20–24]. Furthermore, locoregional, EBRT, and systemic therapies may be used in combination. Systemic therapy is traditionally reserved for advanced, unresectable HCC, where surgical therapy or locoregional therapy is not possible [25]. For example, sorafenib is an oral multikinase inhibitor that targets both tumor cell viability and tumor angiogenesis (Figure 9) and has been shown to improve survival when compared to placebo [26]. RECIST and mRECIST have been used to quantify HCC response to systemic and locoregional therapies at the patient level (Table 4). More recently, immune-related RECIST (IR-RECIST) apply to the unique response after immunotherapy where the appearance of “new” lesions may be observed without disease progression [27, 28]. However, these quantitative assessments of HCC response to therapy do not address variable appearances of tumor after therapy. The goal of LI-RADS treatment response algorithm is to bridge this gap.
Fig. 9. Multifocal hepatocellular carcinoma (HCC), treated with sorafenib.
After prior left hepatic resection, two recurrent HCCs in the caudate lobe and along the resection margin are visible on portal venous phase (A). The larger tumor (arrows) shows decreased internal enhancement (B) during treatment with sorafenib, a multikinase inhibitor that targets tumor angiogenesis.
Table 4.
Overview of Response Criteria and Categories
| RECIST | mRECIST | |
|---|---|---|
|
| ||
| Definition | Based on 1D measurement of tumor size [46]. | Created to address the shortcomings of EASL (e.g. definition of target lesions) |
| Allows for quantitative determination of changes in tumor burden in response to treatment. | Now endorsed by the European Association for the Study of the Liver (EASL) as the preferred method of assessing treatment response in HCC [48]. | |
| Revised to RECIST version 1.1 in 2009 [47]. | ||
|
| ||
| Concepts | Classifies lesions at baseline as “measurable” and “non-measurable” lesions.
|
Incorporates the concept of viable tumor [49]. |
| Integrates the RECIST definitions of response categories and target lesion selection into EASL. | ||
| Uses 1D measurements of the viable component of the tumor (on CT or MRI) on arterial phase. Overall tumor burden (includes target lesions, non-target lesions and new lesions) is determined at the baseline image. Tumor response is then determined at each subsequent follow-up [49]. | ||
| Target lesion: 1) can be accurately measured in at least 1D as 1 cm or more, 2) shows intratumoral APHE on contrast-enhanced CT or MRI and 3) is suitable for repeat measurement. | ||
| In patients with HCC and cirrhosis, certain unique considerations are required for assessment of tumor response in non-target lesions, for example, portal vein thrombosis. | Nontarget lesions: All other measurable lesions (not included as target lesions) should be identified as nontarget lesions and are recorded at baseline. | |
| Overall response is determined by combining the response of both target and non-target lesions. | ||
|
| ||
| Response Categories | ||
|
| ||
| Complete Response (CR) | Disappearance of all target lesions and non-target lesions. | Disappearance of any intratumoral APHE in all target and non-target lesions. |
|
| ||
| Partial Response (PR) | > 30% decrease in the sum of the longest diameter of target lesions. | ≥ 30% decrease in the sum of diameters of viable target lesions. |
|
| ||
| Stable Disease (SD) | Neither sufficient shrinkage to qualify for partial response nor sufficient increase to qualify for progressive disease. | Any cases that do not qualify for either partial response or progressive disease. |
|
| ||
| Progressive Disease (PD) | > 20% increase in the sum of the longest diameter of target lesions, or the appearance of one or more new lesions. RECIST 1.1 additionally requires at least a 5 mm absolute increase in the sum of the longest diameters of target lesions to avoid measurement errors in small lesions. | ≥ 20% increase in the sum of the diameters of viable target lesions or presence of one or more new lesions or unequivocal progression of existing non target lesions. |
Note: RECIST = Response Evaluation Criteria in Solid Tumors, mRECIST = Modified response evaluation criteria in solid tumors, HCC = hepatocellular carcinoma, APHE = arterial phase hyperenhancement.
LI-RADS treatment response algorithm
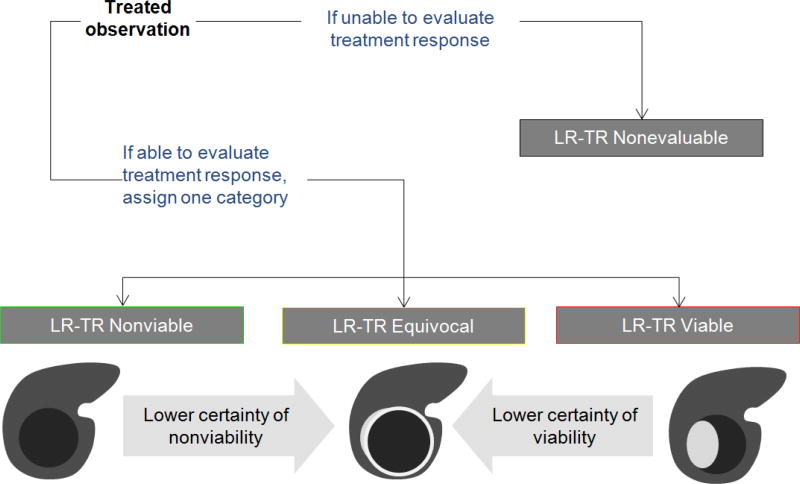
LI-RADS version 2017 introduces a new algorithm to standardize the reporting of treated observations, regardless of their pretreatment LI-RADS category, and is applicable after any locoregional therapy. The radiologist should first assess whether the treated observation is evaluable (Figure 10). Occasionally, due to image degradation, poor contrast bolus, or lack of multiphasic imaging, an accurate treatment response assessment is not possible. In such cases, the radiologist should assign an LR-TR Nonevaluable category. If the treatment response can be assessed, the radiologist assigns one of three available treatment response categories (Table 5). Similar to mRECIST, the algorithm recognizes APHE as a major feature of viability, but it also includes additional imaging criteria. When enhancing tumor meeting criteria for viability is present (Figure 2), the observation is termed LR-TR Viable. When there is complete lack of enhancement of the treated observation (Figure 1), it is assigned as LR-TR Nonviable. Since residual enhancement, for example in the form of a thin peripheral rim of hyperenhancement, often persists even after a successful treatment, expected posttreatment enhancement patterns are also included in the criteria for LR-TR Nonviable (Figure 3). Occasionally the distinction between viable tumor and expected posttreatment enhancement is challenging. In these scenarios, the radiologist is encouraged to assign the category of LR-Treated Equivocal (Figure 7). When the radiologist is unsure about the assessment of tumor viability after treatment, for example in the early posttreatment setting where residual enhancement is expected for certain therapies, tie-breaking rules should be applied (Figure 10).
Fig. 10. LI-RADS Treatment Response Algorithm with Tie-Breaking Rules.
A treated observation is either nonevaluable (LR-TR Nonevaluable) or evaluable and assigned one of three categories: Nonviable, Equivocal, or Viable. When unsure about the category of response, the LR-TR Equivocal category should be selected.
Table 5.
LI-RADS Treatment Response Categories
| Treatment Response Categories | Criteria |
|---|---|
| LR-TR Nonviable Treated, probably or definitely not viable |
|
| LR-TR Equivocal Treated, equivocally viable | Enhancement atypical for treatment-specific expected enhancement pattern and not meeting criteria for probably viable or definitely viable |
| LR-TR Viable Treated, probably or definitely viable | Nodular, mass-like, or thick irregular tissue in or along the treated lesion with any of the following:
|
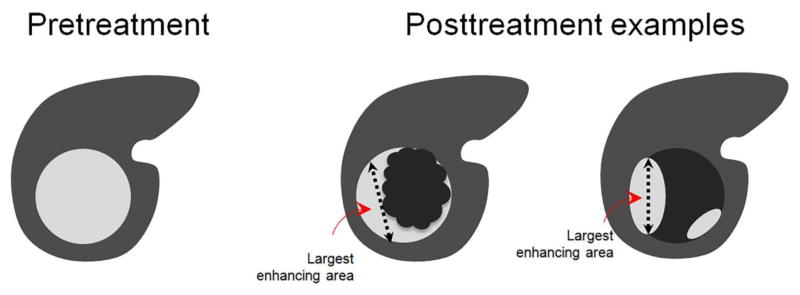
Whether the treated observation is LR-TR Viable or LR-TR Equivocal, the radiologist should report the size of the treated observation as the largest single dimension of the enhancing tumor, in any standard orthogonal plane of imaging (axial, sagittal, or coronal), without crossing intervening areas of nonviable tumor (Figure 11). In summary, after an observation is treated by locoregional therapy and is deemed evaluable by a radiologist, it can be reported as follows:
No size is reported if the treated lesion is considered LR-TR Nonviable. Reporting the viable tumor size communicates to the referring physician if re-treatment or alternative treatments should be considered. When treatment response is equivocal, the decision to re-treat may be weighed against the option to perform follow-up imaging, based on a multidisciplinary discussion.
Fig. 11. Measurements of viable tumor after treatment.
When reporting the size of the tumor after treatment, the viable tumor should be reported by measuring the single largest dimension covering the area of enhancement and avoiding intervening areas of nonenhancement. When multiple discrete areas of nodular enhancement are present, the single largest enhancing area is measured.
In addition to applying the Treatment Response Algorithm, radiologists should report the pretreatment LI-RADS category of the lesion or biopsy results, whenever available. The pretreatment LI-RADS category is the basis for determining transplant candidacy and is concordant with the criteria adopted by Organ Procurement and Transplantation Network (OPTN), as defined by United Network of Organ Sharing (UNOS). At this time, only previously OPTN-5 and biopsy-proven HCC can be considered OPTN-5T after treatment. Thus, an observation meeting criteria for LR-4 or LR-M that is empirically treated without histologic confirmation cannot be classified as OPTN-5T. In the absence of available pretreatment imaging, a pretreatment LI-RADS category should be omitted. In addition to pretreatment LI-RADS category or pathology diagnosis, the size of the observation prior to the treatment should be reported. Reporting both the pretreatment and posttreatment tumor sizes allows for an estimation of the percent response. For example, consider an observation that meets imaging criteria for LR-5 and measures 5.2 cm at baseline, undergoes treatment, and shows residual nodular APHE measuring 2.3 cm. This lesion may be reported as: LR-TR Viable 2.3 cm (previously LR-5, 5.2 cm). This succinctly communicates the magnitude of the response to locoregional therapy as well as the potential eligibility of the patient for transplantation by downstaging.
The Treatment Response Algorithm utilizes a single dimension to describe viable tumors; mRECIST response categories have shown substantial to excellent agreement between radiologists and is similarly based on single dimension measurements of arterially enhancing tumors [29–32]. While LI-RADS Treatment Response Algorithm provides a lesion-by-lesion response assessment, the radiologist can incorporate their tumor measurements from the algorithm into an mRECIST approach to generate patient level responses, based on changes in the sum-of-diameters of target lesions. Furthermore, measurements of residual viable tumor are important for determining transplant eligibility in the case of locoregional therapy used as a bridge to transplant or in the setting of downstaging to achieve candidacy.
When a radiologist judges that reporting a single dimension for viable tumor in the treated observation is not helpful or potentially misleading, the radiologist is encouraged to provide additional information to assist the treating physician. In these instances, it is often helpful to engage in a multidisciplinary discussion to determine how to best manage the individual case.
A few points regarding the new algorithm deserve mention. The assessment of tumor viability by imaging may not be concordant with pathologic viability. Microscopic tumor viability is not uncommon in treated observations that lack enhancement [7, 9, 33]. Thus, the viability defined by LI-RADS Treatment Response Algorithm is an imaging definition that was developed to improve consistency in reporting and guide patient management. Further research is needed to validate these criteria, both as a tool for communicating patient responses to treating physicians and as a methodology for outcomes measurements. The LI-RADS Treatment Response Algorithm, similar to the diagnostic algorithm for LI-RADS, was not designed to assess response at the patient level. For patients with multifocal disease where listing every single treated tumor is impractical, or for those with extrahepatic disease, the radiologist should use his or her judgment in the application of the LI-RADS Treatment Response Algorithm. The choice between RECIST and mRECIST, which provide patient level response guidelines, usually depends on the needs of the practitioner, department, institution, or clinical trial. As noted above, the viable tumor measurements obtained from the LI-RADS Treatment Response Algorithm can potentially be incorporated into a patient level response assessment via mRECIST, given the similarities between the two. Even so, it is important to note the differences with mRECIST, including the new category of “equivocal viable tumor” and the inclusion of “washout” alone as an enhancement pattern favoring tumor viability in LI-RADS.
Gaps and future directions
The LI-RADS Treatment Response Algorithm was designed to assess treated tumors regardless of the type of locoregional therapy. Further research is needed to identify if certain treatment(s) may benefit from their own specific response algorithm, such as for TARE and EBRT, where early posttreatment assessment can be challenging. The optimal follow-up interval to assess treatment response is unclear and may also vary depending on the treatment chosen, institutional guidelines and even constraints of imaging reimbursement by health insurance carriers. After an initial posttreatment CT or MRI to establish a new baseline, LI-RADS currently suggests follow-up CT or MRI at 3-month intervals.
Further research is needed to assess the level of interobserver agreement among different radiologists with varying experience levels in the application of the LI-RADS Treatment Response Algorithm. Poor interobserver agreement for portions of the algorithm may inform future versions of LI-RADS. Ancillary features are currently not used for tumor viability assessment, but this may change as new evidence for their use accumulates. Correlation of LI-RADS treatment response categories with histopathology also warrants future consideration. The LI-RADS Tumor Response Working Group strived to create an algorithm that was as simple as possible, without being too simplistic. As the radiology community integrates the LI-RADS Treatment Response algorithm into clinical practice, the utility of these new LR-Treated categories will be assessed, and user feedback is encouraged to further improve future versions of LI-RADS.
Acknowledgments
Funding: Ania Kielar was funded by General Electric. Richard K Do received support from the NIH/NCI Cancer Center Support Grant P30 CA008748.
Footnotes
Conflict of Interest:
The authors declare that they have no conflict of interest.
Contributor Information
Ania Kielar, Department of Radiology, University of Ottawa, Ottawa, Canada.
Kathryn J Fowler, Department of Radiology, Washington University, St. Louis, MO, USA.
Sara Lewis, Department of Radiology, Icahn School of Medicine at Mount Sinai, New York, NY, USA.
Vahid Yaghmai, Department of Radiology, Northwestern Memorial Hospital, Northwestern University–Feinberg School of Medicine, 676 N Saint Clair St, Ste 800, Chicago, IL 60611.
Frank H. Miller, Department of Radiology, Northwestern Memorial Hospital, Northwestern University–Feinberg School of Medicine, 676 N Saint Clair St, Ste 800, Chicago, IL 60611.
Hooman Yarmohammadi, Department of Radiology, Memorial Sloan Kettering Cancer Center, New York, NY, USA.
Charles Kim, Department of Radiology, Duke University, NC, USA.
Victoria Chernyak, Department of Radiology, Montefiore Medical Center, New York, NY, USA.
Takeshi Yokoo, Department of Radiology, University of Texas Southwestern Medical Center, Dallas, TX USA.
Jeffrey Meyer, Department of Radiation Oncology, University of Texas Southwestern Medical Center, Dallas, TX USA.
Isabel Newton, Department of Radiology, UC San Diego, San Diego, CA, USA.
Richard K Do, Department of Radiology, Memorial Sloan Kettering Cancer Center, New York, NY, USA.
References
- 1.Ahmed M, et al. Image-guided tumor ablation: standardization of terminology and reporting criteria--a 10-year update. Radiology. 2014;273(1):241–60. doi: 10.1148/radiol.14132958. [DOI] [PMC free article] [PubMed] [Google Scholar]
- 2.Cheung W, et al. Irreversible electroporation for unresectable hepatocellular carcinoma: initial experience and review of safety and outcomes. Technol Cancer Res Treat. 2013;12(3):233–41. doi: 10.7785/tcrt.2012.500317. [DOI] [PubMed] [Google Scholar]
- 3.Gaba RC, et al. Transcatheter Therapy for Hepatic Malignancy: Standardization of Terminology and Reporting Criteria. J Vasc Interv Radiol. 2016;27(4):457–73. doi: 10.1016/j.jvir.2015.12.752. [DOI] [PubMed] [Google Scholar]
- 4.Benedict SH, et al. Stereotactic body radiation therapy: the report of AAPM Task Group 101. Med Phys. 2010;37(8):4078–101. doi: 10.1118/1.3438081. [DOI] [PubMed] [Google Scholar]
- 5.Halperin EC, et al. Perez and Brady's Principles and Practice of Radiation Obcology. 6. Lippincott Williams & Wilkins; 2013. [Google Scholar]
- 6.Kim SK, et al. Hepatocellular carcinoma treated with radio-frequency ablation: spectrum of imaging findings. Radiographics. 2003;23(1):107–21. doi: 10.1148/rg.231025055. [DOI] [PubMed] [Google Scholar]
- 7.Chung WS, et al. Enhancement patterns of hepatocellular carcinoma after transarterial chemoembolization using drug-eluting beads on arterial phase CT images: a pilot retrospective study. AJR Am J Roentgenol. 2012;199(2):349–59. doi: 10.2214/AJR.11.7563. [DOI] [PubMed] [Google Scholar]
- 8.Yaghmai V, et al. Imaging assessment of hepatocellular carcinoma response to locoregional and systemic therapy. AJR Am J Roentgenol. 2013;201(1):80–96. doi: 10.2214/AJR.13.10706. [DOI] [PubMed] [Google Scholar]
- 9.Ehman EC, et al. Imaging prediction of residual hepatocellular carcinoma after locoregional therapy in patients undergoing liver transplantation or partial hepatectomy. Abdom Radiol (NY) 2016;41(11):2161–2168. doi: 10.1007/s00261-016-0837-1. [DOI] [PubMed] [Google Scholar]
- 10.Kallini JR, et al. Hepatic imaging following intra-arterial embolotherapy. Abdom Radiol (NY) 2016;41(4):600–16. doi: 10.1007/s00261-016-0639-5. [DOI] [PubMed] [Google Scholar]
- 11.Furui S, et al. Hepatocellular carcinoma treated by transcatheter arterial embolization: progress evaluated by computed tomography. Radiology. 1984;150(3):773–8. doi: 10.1148/radiology.150.3.6320258. [DOI] [PubMed] [Google Scholar]
- 12.Kimura T, et al. Dynamic computed tomography appearance of tumor response after stereotactic body radiation therapy for hepatocellular carcinoma: How should we evaluate treatment effects? Hepatol Res. 2013;43(7):717–27. doi: 10.1111/hepr.12007. [DOI] [PubMed] [Google Scholar]
- 13.Kim EY, et al. Change in contrast enhancement of HCC on 1-month follow-up CT after local radiotherapy: an early predictor of final treatment response. Eur J Radiol. 2009;72(3):440–6. doi: 10.1016/j.ejrad.2008.07.036. [DOI] [PubMed] [Google Scholar]
- 14.Kimura T, et al. The Time Course of Dynamic Computed Tomographic Appearance of Radiation Injury to the Cirrhotic Liver Following Stereotactic Body Radiation Therapy for Hepatocellular Carcinoma. PLoS One. 2015;10(6):e0125231. doi: 10.1371/journal.pone.0125231. [DOI] [PMC free article] [PubMed] [Google Scholar]
- 15.Park MJ, et al. Stereotactic body radiotherapy-induced arterial hypervascularity of non-tumorous hepatic parenchyma in patients with hepatocellular carcinoma: potential pitfalls in tumor response evaluation on multiphase computed tomography. PLoS One. 2014;9(2):e90327. doi: 10.1371/journal.pone.0090327. [DOI] [PMC free article] [PubMed] [Google Scholar]
- 16.Mannelli L, et al. Assessment of tumor necrosis of hepatocellular carcinoma after chemoembolization: diffusion-weighted and contrast-enhanced MRI with histopathologic correlation of the explanted liver. AJR Am J Roentgenol. 2009;193(4):1044–52. doi: 10.2214/AJR.08.1461. [DOI] [PubMed] [Google Scholar]
- 17.Merkle EM, et al. Consensus report from the 7th International Forum for Liver Magnetic Resonance Imaging. Eur Radiol. 2016;26(3):674–82. doi: 10.1007/s00330-015-3873-2. [DOI] [PMC free article] [PubMed] [Google Scholar]
- 18.Shinagawa Y, et al. Pseudolesion of the liver observed on gadoxetate disodium-enhanced magnetic resonance imaging obtained shortly after transarterial chemoembolization for hepatocellular carcinoma. Jpn J Radiol. 2010;28(6):483–8. doi: 10.1007/s11604-010-0454-9. [DOI] [PubMed] [Google Scholar]
- 19.Watanabe H, et al. Is gadoxetate disodium-enhanced MRI useful for detecting local recurrence of hepatocellular carcinoma after radiofrequency ablation therapy? AJR Am J Roentgenol. 2012;198(3):589–95. doi: 10.2214/AJR.11.6844. [DOI] [PubMed] [Google Scholar]
- 20.Liapi E, Geschwind JF. Combination of local transcatheter arterial chemoembolization and systemic anti-angiogenic therapy for unresectable hepatocellular carcinoma. Liver Cancer. 2012;1(3–4):201–15. doi: 10.1159/000343835. [DOI] [PMC free article] [PubMed] [Google Scholar]
- 21.Weintraub JL, Salem R. Treatment of hepatocellular carcinoma combining sorafenib and transarterial locoregional therapy: state of the science. J Vasc Interv Radiol. 2013;24(8):1123–34. doi: 10.1016/j.jvir.2013.01.494. [DOI] [PubMed] [Google Scholar]
- 22.Chaudhury P, H M, Nudo C, Bouteaud J, Cabrera T, Valenti D, Metrakos P. Combined sorafenib and yttrium-90 radio-embolization in the treatment of advanced HCC: preliminary results. Hepatology. 2009;50(4) [Google Scholar]
- 23.Siegel AB, et al. Phase II trial evaluating the clinical and biologic effects of bevacizumab in unresectable hepatocellular carcinoma. J Clin Oncol. 2008;26(18):2992–8. doi: 10.1200/JCO.2007.15.9947. [DOI] [PMC free article] [PubMed] [Google Scholar]
- 24.Sun W, et al. Phase 2 trial of bevacizumab, capecitabine, and oxaliplatin in treatment of advanced hepatocellular carcinoma. Cancer. 2011;117(14):3187–92. doi: 10.1002/cncr.25889. [DOI] [PubMed] [Google Scholar]
- 25.Llovet JM, Bruix J. Molecular targeted therapies in hepatocellular carcinoma. Hepatology. 2008;48(4):1312–27. doi: 10.1002/hep.22506. [DOI] [PMC free article] [PubMed] [Google Scholar]
- 26.Llovet JM, et al. Sorafenib in advanced hepatocellular carcinoma. N Engl J Med. 2008;359(4):378–90. doi: 10.1056/NEJMoa0708857. [DOI] [PubMed] [Google Scholar]
- 27.Harding JJ, El Dika I, Abou-Alfa GK. Immunotherapy in hepatocellular carcinoma: Primed to make a difference? Cancer. 2016;122(3):367–77. doi: 10.1002/cncr.29769. [DOI] [PubMed] [Google Scholar]
- 28.Wolchok JD, et al. Guidelines for the evaluation of immune therapy activity in solid tumors: immune-related response criteria. Clin Cancer Res. 2009;15(23):7412–20. doi: 10.1158/1078-0432.CCR-09-1624. [DOI] [PubMed] [Google Scholar]
- 29.Donati OF, et al. Interreader and inter-test agreement in assessing treatment response following transarterial embolization for hepatocellular carcinoma. Eur Radiol. 2015;25(9):2779–88. doi: 10.1007/s00330-015-3677-4. [DOI] [PMC free article] [PubMed] [Google Scholar]
- 30.Sato Y, et al. Tumor response evaluation criteria for HCC (hepatocellular carcinoma) treated using TACE (transcatheter arterial chemoembolization): RECIST (response evaluation criteria in solid tumors) version 1.1 and mRECIST (modified RECIST): JIVROSG-0602. Ups J Med Sci. 2013;118(1):16–22. doi: 10.3109/03009734.2012.729104. [DOI] [PMC free article] [PubMed] [Google Scholar]
- 31.Seyal AR, et al. Reproducibility of mRECIST in assessing response to transarterial radioembolization therapy in hepatocellular carcinoma. Hepatology. 2015;62(4):1111–21. doi: 10.1002/hep.27915. [DOI] [PubMed] [Google Scholar]
- 32.Shim JH, et al. Maximum number of target lesions required to measure responses to transarterial chemoembolization using the enhancement criteria in patients with intrahepatic hepatocellular carcinoma. J Hepatol. 2012;56(2):406–11. doi: 10.1016/j.jhep.2011.04.028. [DOI] [PubMed] [Google Scholar]
- 33.Hunt SJ, et al. Radiologic monitoring of hepatocellular carcinoma tumor viability after transhepatic arterial chemoembolization: estimating the accuracy of contrast-enhanced cross-sectional imaging with histopathologic correlation. J Vasc Interv Radiol. 2009;20(1):30–8. doi: 10.1016/j.jvir.2008.09.034. [DOI] [PubMed] [Google Scholar]
- 34.Gazelle GS, et al. Tumor ablation with radio-frequency energy. Radiology. 2000;217(3):633–46. doi: 10.1148/radiology.217.3.r00dc26633. [DOI] [PubMed] [Google Scholar]
- 35.Shi W, et al. Contrast-enhanced ultrasonography used for post-treatment responses evaluation of radiofrequency ablations for hepatocellular carcinoma: a meta-analysis. Br J Radiol. 2016;89(1064):20150973. doi: 10.1259/bjr.20150973. [DOI] [PMC free article] [PubMed] [Google Scholar]
- 36.Liu M, et al. Comparison of contrast-enhanced ultrasound and contrast-enhanced computed tomography in evaluating the treatment response to transcatheter arterial chemoembolization of hepatocellular carcinoma using modified RECIST. Eur Radiol. 2015;25(8):2502–11. doi: 10.1007/s00330-015-3611-9. [DOI] [PubMed] [Google Scholar]
- 37.Takizawa K, et al. Use of contrast-enhanced ultrasonography with a perflubutane-based contrast agent performed one day after transarterial chemoembolization for the early assessment of residual viable hepatocellular carcinoma. Eur J Radiol. 2013;82(9):1471–80. doi: 10.1016/j.ejrad.2013.04.045. [DOI] [PubMed] [Google Scholar]
- 38.Tsuda M, et al. Hepatocellular carcinoma after radiofrequency ablation therapy: dynamic CT evaluation of treatment. Clin Imaging. 2001;25(6):409–15. doi: 10.1016/s0899-7071(01)00333-3. [DOI] [PubMed] [Google Scholar]
- 39.Shyn PB, et al. MRI contrast enhancement of malignant liver tumours following successful cryoablation. Eur Radiol. 2012;22(2):398–403. doi: 10.1007/s00330-011-2254-8. [DOI] [PubMed] [Google Scholar]
- 40.McLoughlin RF, et al. CT of the liver after cryotherapy of hepatic metastases: imaging findings. AJR Am J Roentgenol. 1995;165(2):329–32. doi: 10.2214/ajr.165.2.7618549. [DOI] [PubMed] [Google Scholar]
- 41.Schima W, et al. Post-treatment imaging of liver tumours. Cancer Imaging. 2007;7(Spec No A):S28–36. doi: 10.1102/1470-7330.2007.9047. [DOI] [PMC free article] [PubMed] [Google Scholar]
- 42.Wang X, et al. Pattern of retained contrast on immediate postprocedure computed tomography (CT) after particle embolization of liver tumors predicts subsequent treatment response. Cardiovasc Intervent Radiol. 2013;36(4):1030–8. doi: 10.1007/s00270-012-0506-x. [DOI] [PMC free article] [PubMed] [Google Scholar]
- 43.Kubota K, et al. Evaluation of hepatocellular carcinoma after treatment with transcatheter arterial chemoembolization: comparison of Lipiodol-CT, power Doppler sonography, and dynamic MRI. Abdom Imaging. 2001;26(2):184–90. doi: 10.1007/s002610000139. [DOI] [PubMed] [Google Scholar]
- 44.Lee S, et al. MRI Findings and Prediction of Time to Progression of Patients with Hepatocellular Carcinoma Treated with Drug-eluting Bead Transcatheter Arterial Chemoembolization. J Korean Med Sci. 2015;30(7):965–73. doi: 10.3346/jkms.2015.30.7.965. [DOI] [PMC free article] [PubMed] [Google Scholar]
- 45.Ibrahim SM, et al. Radiologic findings following Y90 radioembolization for primary liver malignancies. Abdom Imaging. 2009;34(5):566–81. doi: 10.1007/s00261-008-9454-y. [DOI] [PubMed] [Google Scholar]
- 46.Therasse P, et al. New guidelines to evaluate the response to treatment in solid tumors. European Organization for Research and Treatment of Cancer, National Cancer Institute of the United States, National Cancer Institute of Canada. J Natl Cancer Inst. 2000;92(3):205–16. doi: 10.1093/jnci/92.3.205. [DOI] [PubMed] [Google Scholar]
- 47.Eisenhauer EA, et al. New response evaluation criteria in solid tumours: revised RECIST guideline (version 1.1) Eur J Cancer. 2009;45(2):228–47. doi: 10.1016/j.ejca.2008.10.026. [DOI] [PubMed] [Google Scholar]
- 48.Galizia MS, et al. MDCT necrosis quantification in the assessment of hepatocellular carcinoma response to yttrium 90 radioembolization therapy: comparison of two-dimensional and volumetric techniques. Acad Radiol. 2012;19(1):48–54. doi: 10.1016/j.acra.2011.09.005. [DOI] [PubMed] [Google Scholar]
- 49.Lencioni R, Llovet JM. Modified RECIST (mRECIST) assessment for hepatocellular carcinoma. Semin Liver Dis. 2010;30(1):52–60. doi: 10.1055/s-0030-1247132. [DOI] [PMC free article] [PubMed] [Google Scholar]


