

Summary
Hydrogen-dependent reduction of carbon dioxide to formic acid offers a promising route to greenhouse gas sequestration, carbon abatement technologies, hydrogen transport and storage, and the sustainable generation of renewable chemical feedstocks [1]. The most common approach to performing direct hydrogenation of CO2 to formate is to use chemical catalysts in homogeneous or heterogeneous reactions [2]. An alternative approach is to use the ability of living organisms to perform this reaction biologically. However, although CO2 fixation pathways are widely distributed in nature, only a few enzymes have been described that have the ability to perform the direct hydrogenation of CO2 [3, 4, 5]. The formate hydrogenlyase (FHL) enzyme from Escherichia coli normally oxidizes formic acid to carbon dioxide and couples that reaction directly to the reduction of protons to molecular hydrogen [6]. In this work, the reverse reaction of FHL is unlocked. It is established that FHL can operate as a highly efficient hydrogen-dependent carbon dioxide reductase when gaseous CO2 and H2 are placed under pressure (up to 10 bar). Using intact whole cells, the pressurized system was observed to rapidly convert 100% of gaseous CO2 to formic acid, and >500 mM formate was observed to accumulate in solution. Harnessing the reverse reaction has the potential to allow the versatile E. coli system to be employed as an exciting new carbon capture technology or as a cell factory dedicated to formic acid production, which is a commodity in itself as well as a feedstock for the synthesis of other valued chemicals.
Keywords: Escherichia coli, hydrogenase, formate dehydrogenase, formate hydrogenase, carbon capture, formate chemosynthesis, carbon dioxide
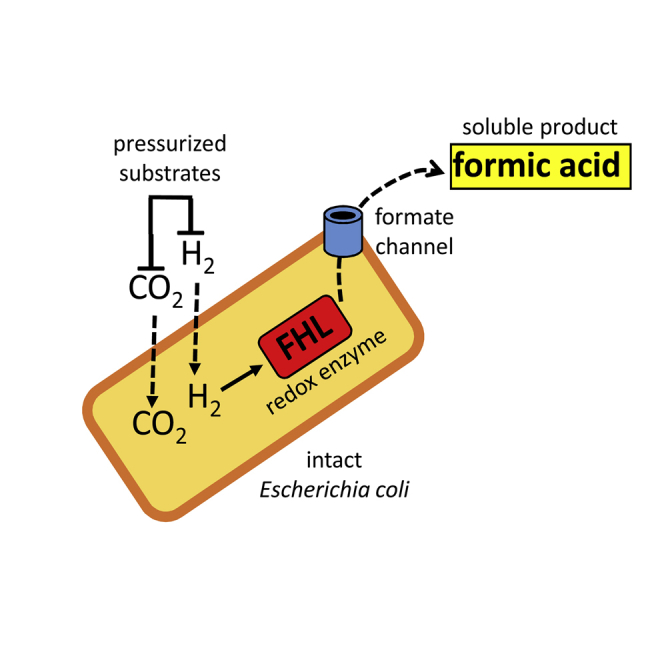
Graphical Abstract
Highlights
-
•
Escherichia coli produces a formate hydrogenlyase (FHL) enzyme
-
•
FHL can function in two modes dependent on the prevailing environmental conditions
-
•
Pressurized CO2 and H2 allow FHL to function as a hydrogen-dependent CO2 reductase
-
•
The produced formic acid accumulates outside of the bacterial cells
Under anaerobic conditions, Escherichia coli produces a formate hydrogenlyase (FHL) enzyme. Roger et al. reveal that when H2 and CO2 gases are placed under increasing pressure, FHL operates as an efficient hydrogen-dependent carbon dioxide reductase. The product of the reaction is formic acid, which accumulates outside the bacterial cells.
Results
Increasing Gas Pressure Allows Efficient Synthesis of Formate from CO2
It is thought that CO2 itself, as opposed to carbonic acid, bicarbonate, or carbonate, is the direct product (and substrate) for bacterial formate dehydrogenase enzymes [7, 8, 9, 10]. At neutral pH, the behavior of CO2 in solution is known to be complex [11], and thus substrate availability to the formate hydrogenlyase (FHL) enzyme is likely to be a limiting parameter. Henry’s law states that the amount of dissolved gas is proportional to the applied pressure [12]; thus, to predict what relative concentrations of dissolved H2 and CO2 might be attainable by applying headspace pressure to a 1:1 mixture of these gases, a non-random two-liquid (NRTL) activity coefficient model [13] with Henry’s law for H2 and CO2 derived from isothermal datasets at 308 K/35°C was devised (Figure S1). The model, consistent with Henry’s law, predicts CO2 could reach ∼120 mmol⋅L−1 in solution, and H2 ∼4 mmol⋅L−1, when mixed together at 10 bar pressure (Figure S1).
Next, a pressure bioreactor system was designed (Figure S2). A pre-mixing “H2:CO2 ballast vessel” allowed the preparation of a homogeneous gas mixture (∼44% H2 and ∼56% CO2 as quantified by gas chromatography) at high pressure (40 bar). This vessel was then used for the pressurization of the “production vessel,” which was the bioreactor containing the bacterial cell suspension (Figure S2). The system was designed with the ability to operate at constant temperatures, to monitor and modify the pH in the production vessel, to monitor gas consumption in the ballast vessel, and to withdraw liquid samples from the production vessel for analysis.
The E. coli strain FTD89, which has a genotype of ΔhyaB/ΔhybC and thus lacks all major hydrogenase activity except that from FHL, was grown under anaerobic fermentative conditions in order to induce synthesis of the FHL complex. The intact whole cells were then harvested and washed extensively before being placed in a solution containing only 20 mmol⋅L−1 MOPS (3-(N-morpholino)propanesulfonic acid) buffer (pH 7.4) at 25 g wet weight cells⋅L−1. This cell suspension was then placed in the production vessel (Figure S2) under a constant 2 bar pressure of H2:CO2 mixture (44:56 ratio as calculated by gas chromatography), corresponding to a constant 27.52 mmol⋅L−1 CO2 and 0.81 mmol⋅L−1 H2 in the aqueous phase. The increase in concentration of formate was then followed over time by high-performance liquid chromatography (HPLC) (Figure 1A; Figure S3), while the decrease in ballast vessel gas pressure, indicating gas consumption in the production vessel (Figure 1B), and the pH changes in the production vessel (Figure 1C) were all similarly monitored. Under these 2 bar/MOPS (pH 7.4) conditions, the concentration of formate in the cell suspension was observed to initially increase and then level off after a few hours, with a final concentration of formate produced in the reaction vessel of 8 mmol⋅L−1 (Figure 1A). However, this was concomitant with a strong decrease in the pH in the production vessel (Figure 1C), which can be attributed to both CO2 dissolution (at the beginning of the experiment) as well as production of formate.
Figure 1.

Increasing Gas Pressures Boost Hydrogen-Dependent CO2 Reduction
Cultures of E. coli FTD89 strain (ΔhyaB, ΔhybC) were pre-grown under FHL-inducing conditions before 25 g of washed, intact whole cells was placed in a high-pressure reactor and incubated at a constant H2:CO2 ratio (∼1:1) at 2, 4, 6, or 10 bar pressure in a final volume of 500 mL at 37°C with stirring at 500 rpm. The color key reflects the different gas pressure and buffering conditions applied for each experiment. Samples at pH 7.4 were in 20 mM MOPS buffer; samples at pH 8 were in 200 mM Tris-HCl buffer; and samples labeled “+NaOH” were titrated with 2 M NaOH during the reaction.
(A) Formate production in the production vessel was recorded over time by manual sampling and quantification by HPLC.
(B) The pressure decrease in the gas pre-mixing ballast vessel was recorded over time under the different pressure conditions applied to the cell suspension in the production vessel.
(C) The pH in the cell suspension-containing production vessel was monitored over the time course of the reactions under the different gas pressures applied.
Error bars represent ± SD (n = 3). See also Figures S1–S3.
In order to minimize the pH changes upon gas pressurization and formate production, the pH of the starting buffer was increased from pH 7.4 to pH 8.0 and MOPS buffer was replaced by 200 mmol⋅L−1 Tris-HCl. At 2 bar pressure, these modifications alone resulted in 85 mmol⋅L−1 for the final concentration of formate produced (Figure 1A), and increasing the gas pressure to 4 bar allowed a further increase of the final concentration of formate produced to 120 mmol⋅L−1 (Figure 1A).
Next, the production vessel was further modified to allow the addition of sodium hydroxide to the E. coli cell suspension in order to maintain the pH above 6.8 during the reaction. By using this strategy, a further increase in the final formate concentration to 150 and 200 mmol⋅L−1 was observed at 4 and 6 bar pressure, respectively (Figure 1A). Finally, increasing the pressure to 10 bar, which would result in 122.88 mmol⋅L−1 CO2 and 3.61 mmol⋅L−1 H2 in solution, together with the continuous pH regulation system in operation, allowed the production of >0.5 mol⋅L−1 formate in the bioreactor over the 23 hr time course of the experiment (Figure 1A).
It can be concluded from these experiments that maintaining the pressure of the gas mixture in the headspace at 10 bar, combined with the fine control of the reaction pH, leads to an over 20× increase in the total amount of formate produced per mg of total cell protein versus that observed at ambient pressure (Figure 1A). Indeed, the efficiency of this reaction was observed to be optimal, with a value of 103.0% conversion of gaseous CO2 to formate in solution recorded at 10 bar pressure (Figure 2). The reaction is dependent upon the presence of the FHL complex in the cells, with a mutant strain (RT2) devoid of the genes encoding the enzyme being unable to generate formate (Figure S3D). Intact E. coli cells are, therefore, under the correct conditions, capable of a highly efficient hydrogen-dependent reduction of CO2 to formate.
Figure 2.

Complete Conversion of Gaseous CO2 to Formic Acid
A comparison of the final formate content of the production vessel under different gas pressures (left x axis, black line) with the overall efficiency of CO2 conversion to formate by calculating and comparing CO2 uptake and formate production levels (right x axis, gray bars). Error bars represent ± SD (n = 3). See also Figure S2.
Genetic Engineering Leads to Strain Optimization
The E. coli FTD89 strain utilized thus far contains, in addition to FHL, two other formate dehydrogenases [14] and the potential ability to assimilate some of the formate produced through the reverse reaction of pyruvate formatelyase (PFL) [15]. Although in the current reaction conditions there are no exogenous respiratory electron acceptors or carbon sources, it was considered that genetic inactivation of other potential formate utilization pathways may help optimize the CO2 reduction to this organic acid. Therefore, the ability of an additionally modified E. coli strain RT1 (ΔhyaB, ΔhybC, ΔpflA, ΔfdhE) to perform hydrogen-dependent CO2 reduction was compared to FTD89. In RT1, the fdhE mutation inactivates biosynthesis of the respiratory formate dehydrogenases but does not affect the enzyme associated with FHL [16, 17], and the pflA mutation removes the PFL-activating enzyme [18].
Using low-pressure, small-scale experiments, as shown in Figure 3, a 2× increase in the final amount of formate produced from gaseous H2 and CO2 can be recorded when using a suspension of the E. coli strain RT1 in comparison with the FTD89 strain. An E. coli control strain, RT2 (ΔhyaB, ΔhybC, ΔpflA, ΔfdhE, ΔhycA–I), which is genetically identical to the RT1 strain but further deleted for the hycABCDEFGHI operon encoding the Hyd-3 [NiFe]-hydrogenase component of FHL, could not produce formate under the same conditions (Figure 3).
Figure 3.

Genetic Inactivation of Competing Formate Metabolic Pathways Enhances Hydrogen-Dependent CO2 Reduction
Cultures of E. coli strains FTD89 (ΔhyaB, ΔhybC) (black squares), RT1 (ΔhyaB, ΔhybC, ΔpflA, ΔfdhE) (black circles), and RT2 (ΔhyaB, ΔhybC, ΔpflA, ΔfdhE, ΔhycA–I) (black triangles) were pre-grown under FHL-inducing conditions. Then, small-scale 25-mg samples of washed whole cells were incubated in sealed Hungate tubes in a final volume of 3 mL 20 mmol⋅L−1 MOPS buffer (pH 7.4) at 37°C under a CO2 and H2 atmosphere at ambient pressure. The formate concentration in the liquid phase of the reaction tubes was assayed by HPLC over time. Error bars represent ± SD (n = 3).
Attention next returned to the high-pressure bioreactor, and the E. coli RT1 strain (ΔhyaB, ΔhybC, ΔpflA, ΔfdhE) was used to further explore the optimal conditions for hydrogen-dependent CO2 reduction (Figure 4). To establish the optimum amount of biomass necessary for efficient hydrogen-dependent reduction of CO2, different amounts of intact E. coli RT1 cells (2, 4, 8, 16, 25, and 50 g wet weight⋅L−1), pre-grown to induce FHL expression, were incubated in the 500 mL reaction vessel at a constant H2:CO2 pressure of 10 bar, and the final concentrations of formate produced in the aqueous phase of the bioreactor, and its initial rate of production over time, were determined (Figure 4). When the amount of cell protein used is taken into account (Figure 4A), the greatest relative final concentration of formic acid was achieved when the RT1 cells were prepared at 8 g⋅L−1 (Figure 4A). This amount of cells also corresponded to the point where conversion of CO2 to formic acid reached optimum efficiency (Figure 4B). Indeed, increasing the RT1 biomass beyond 8 g⋅L−1 up to 50 g⋅L−1 (25 g cells, wet weight, in the 500 mL reaction vessel) did not contribute to an increase in the final amounts of formate produced (Figures 4A and 4B).
Figure 4.

Relatively Low Amounts of Cells Are Required for Optimal Formate Production under Pressure
Cultures of the E. coli RT1 strain (ΔhyaB, ΔhybC, ΔpflA, ΔfdhE) were pre-grown under FHL-inducing conditions. Various amounts (2, 4, 8, 16, 25, and 50 g wet weight⋅L−1) of washed whole cells were incubated at constant H2:CO2 (∼1:1) at 10 bar pressure in a final volume of 500 mL at 37°C and 500 rpm in the high-pressure reaction vessel. Formate production over the time course of the reaction was recorded by manual sampling and quantified by HPLC.
(A) The total formate content in the production vessel at the end of the reaction (23 hr) as a factor of total cell protein used.
(B) The apparent efficiency of CO2 conversion to formate as calculated by comparing CO2 uptake with formate production.
(C) The initial rates of formate production under different conditions calculated by extrapolating formate production time courses.
(D) Overall “activity” of the FHL-dependent formate production pathway by incorporating the protein concentrations present in each reaction with the initial rates calculated in (C).
Error bars represent ± SD (n = 3). See also Figures S2 and S3.
In terms of the initial rates of formate production (Figures 4C and 4D), increasing the amount of RT1 cells allowed a clear increase in the apparent rate of formate production at 10 bar pressure (Figure 4C), which stabilized at ∼1.2 g formate produced⋅L−1⋅hr−1 through 8–16 g⋅L−1 cells (Figure 4C). When these initial formate production rates are calculated by taking into account the relative protein concentrations present in the reactions (termed “activity” in Figure 4D), it is also clear that 8 g⋅L−1 of RT1 cells is optimum under these conditions, with an initial rate of 0.6 μmol formate produced⋅min−1⋅mg−1 total cell protein.
Discussion
An Efficient Hydrogen-Dependent CO2 Reductase
Disproportionation of formate to CO2 and H2 by FHL (termed the “forward reaction” here) is the only biochemical reaction observed under physiological conditions by E. coli. Under standard conditions (pH 7, 298 K, 1 bar pressure, and 1 mol⋅L−1 substrate/product concentrations), the standard redox potential (E0′) of CO2/formate has been calculated as −420 mV, which is very close to H+/H2, where E0′ −410 mV [19]. This suggests straight away that changes in the prevailing environmental conditions should be able to push the reaction in either direction. Indeed, previous studies suggested that the FHL complex could potentially perform the “reverse reaction,” given the behavior of the purified individual enzyme components of FHL [6, 20, 21, 22] and early work in intact cells [23]. Moreover, it has been suggested that an evolutionary progenitor of FHL—perhaps already under permissive conditions in the deep ocean—could be responsible for hydrogen-dependent CO2 fixation on early Earth [24]. In this work, it was considered that the close standard redox potentials of the two half-reactions of FHL, and evidence that the enzyme activity was not coupled to other biochemical processes such as generation of electrochemical gradients [25], should allow the correct environmental conditions to be found that would drive the reverse reaction: i.e., increased pH, increased gas pressure/substrate concentrations, and rapid removal of the product from the vicinity of the enzyme.
Consistent with the thermodynamics of the half-reactions under investigation here, when headspace gas pressure was applied to a washed suspension of E. coli cells already containing FHL, the efficiency of the hydrogen-dependent CO2 reduction reaction was found to increase considerably to a peak of around 100%. Indeed, in some cases, calculations suggested slightly more formate was produced than CO2 gas was consumed (Figure 2). One likely explanation is that there is slight experiment-to-experiment variation in the substrate gas composition and associated pressure measurements, or that alternative sources of CO2 are present in the cells. Indeed, it should be considered that the biomass used here is extensively washed and placed in anaerobic buffer with no carbon or energy sources. The cells are effectively starving, and it is possible breakdown of endogenous lipids or amino acids will generate some internal CO2.
Precise quantification of the gas mixture in the ballast vessel suggested that a 56:44 CO2:H2 mixture was present, representing 137.62 mmol⋅L−1 CO2 in solution. The Km for CO2 for the formate dehydrogenase component of FHL is not known; however, its Km for formate is 26 mmol⋅L−1 [14], and the reverse reaction has been studied by electrochemistry using 10 mmol⋅L−1 carbonate as an alternative substrate [22]. The Km for H2 of the Hyd-3 [NiFe]-hydrogenase component has been estimated by electrochemistry techniques as 34 μmol⋅L−1 at pH 6 [6]. Thus, it can be concluded that at least the dissolved levels of the H2 substrate are clearly saturating under these test conditions. Note also that proton reduction activity by Hyd-3 is affected by direct product inhibition, with an inhibition constant calculated at 1.48 mmol⋅L−1 H2 [6]. This means Hyd-3 is likely to be biased toward H2 oxidation under the high-pressure reaction conditions used here.
Formate Production and Excretion from the Cell
The formic acid accumulates outside of the cells in these experiments. Although the experimental conditions applied already favor the reverse FHL reaction, the immediate excretion of the formate product from the cell upon its generation would conceivably help maintain the maximum rate of hydrogen-dependent CO2 reduction activity. The most likely route for formic acid excretion is via the FocA channel [26, 27]. The mechanism of FocA is not yet fully agreed upon, with some hypotheses supporting a pH-gating mechanism where import is favored at pH <7 and export is favored, or perhaps with FocA operating as a passive channel, at pH >7 [28, 29]. Recent work suggests FocA may function as an obligate formic acid/proton symporter at pH <7 and therefore formate uptake into the cell may be driven by the protonmotive force [30]; however, it should be noted that low-pressure experiments in the presence of ionophores had little detrimental effect on in vivo FHL activity [25]. In the key experiment described here (Figure 1A), the external environment is maintained at pH 8. If FocA is considered an open passive channel at alkaline pH [29], then the formic acid (pKa = 3.75) produced in the cell cytoplasm, which is normally maintained at pH 7.2–7.8 [31], will be drawn to and accumulate in the alkaline extracellular environment at a 10× higher concentration than that found in the cytoplasm for every pH unit difference [32].
Conclusions
In summary, this report demonstrates the use of high-pressure reactors for effective and efficient whole-cell biocatalysis by E. coli. The system could be considered a carbon capture technology, because the original aim was to process gaseous CO2 into a manageable product. Alternatively, the system may be considered as a specific formate generation technology. This approach does not require a large amount of biomass for effective conversion, and the use of a well-known industrial workhorse organism such as E. coli presents several advantages for the production of whole-cell biocatalysts and the opportunity to integrate this system into other bioprocessing projects.
The work provides proof of concept that FHL could be harnessed as a straightforward carbon capture device or CO2 recycling technology for industry. For direct use in heavy industry, however, the presence and impact of contaminant waste gases, such as carbon monoxide, should be considered. CO is a classic competitive inhibitor of [NiFe]-hydrogenases, but E. coli Hyd-3 has been observed to exhibit greater tolerance to CO attack than other enzymes, especially under H2 oxidation conditions [6]. This natural property, together with the potential to engineer heterologous enzymes that will metabolize any CO present [33, 34], means that the presence of CO in off-gases is a problem that could be solved.
E. coli FHL could be employed as a means to specifically generate formate, which is a commodity in itself, can be directly used as an H2 carrier or energy store [35], or can serve as feedstock for a wide range of (bio)chemical reactions [36]. Alternatively, the formate so produced could possibly be further converted to other products by incorporating recombinant enzymes into host organisms, representing a promising solution that couples the recycling of CO2 to its use as carbon source and chemical feedstock [37]. The experiments described here have been conducted on non-growing cell suspensions. Genetic engineering has recently demonstrated the ability of modified E. coli to grow on exogenous formate as a carbon source [15, 38]. This raises the possibility that FHL activity, as a source of formate from gaseous CO2, could be incorporated into growing cells to allow CO2 assimilation into biomass and other bio-products.
STAR★Methods
Key Resources Table
| REAGENT or RESOURCE | SOURCE | IDENTIFIER |
|---|---|---|
| Chemicals, Peptides, and Recombinant Proteins | ||
| High purity hydrogen gas (H2) | BOC | Cat # 290626-L |
| Pharmaceutical grade carbon dioxide gas (CO2) | BOC | Cat # 160624-L-C |
| BioUltra sodium formate | Sigma-Aldrich | Cat # 71539 |
| Experimental Models: Organisms/Strains | ||
| Escherichia coli K-12: FTD89 (ΔhyaB, ΔhybC) | [39] | N/A |
| E. coli K-12: RT1 (ΔhyaB, ΔhybC, ΔpflB, ΔfdhE) | [25] | N/A |
| E. coli K-12: RT2 (ΔhyaB, ΔhybC, ΔpflB, ΔfdhE. ΔhycA-I) | [25] | N/A |
| Software and Algorithms | ||
| Aspen Plus | ASPENTECH | http://aspentech.com/products/aspen-plus/ |
| Chromeleon 7.2 | DIONEX | https://www.thermofisher.com/order/catalog/product/CHROMELEON7 |
| Excel | Microsoft | https://www.microsoft.com/en-gb/ |
| Photoshop CS5.1 (64 bit) | ADOBE | http://www.adobe.com/uk/products/photoshop.html |
| SigmaPlot | Systat Software | http://sigmaplot.co.uk/products/sigmaplot/sigmaplot-details.php |
| Non-random two-liquid (NRTL) activity coefficient model | [13] | N/A |
Contact for Reagent and Resources Sharing
Further information and requests for resources and reagents should be directed to and will be fulfilled by the Lead Contact, Frank Sargent (f.sargent@dundee.ac.uk).
Experimental Model and Subject Details
Bacterial strains
The E. coli K-12 strains were based on MC4100 [40, 41] and included FTD89 (ΔhyaB, ΔhybC) [39], RT1 (ΔhyaB, ΔhybC, ΔpflA, ΔfdhE) [25] and RT2 (ΔhyaB, ΔhybC, ΔpflA, ΔfdhE, ΔhycA-I::KanR) [25] (Key Resources Table). Anaerobic fermentative growth was performed in sealed bottles at 37°C for 12-14 hr using TYEP medium [42], pH 6.5, containing 0.8% (w/v) glucose and 0.2% (w/v) sodium formate (Key Resources Table).
Method Details
Small scale catalysis of hydrogen-dependent CO2 reduction to formate at ambient pressure
After anaerobic fermentative growth, 1 L of culture was harvested by centrifugation (Beckman J6-MI centrifuge) for 30 min at 5000 g and 4°C. The cell paste was washed twice in 20 mmol.L-1 3-(N-morpholino)propanesulfonic acid (MOPS) buffer, pH 7.4, before the cell pellet was suspended in the same buffer at 50 g.L-1 (wet weight). Next, 500 μL of the washed whole-cell suspension, corresponding to 25 mg of wet cells, was transferred to a Hungate tube containing 2.5 mL of MOPS buffer. The tubes were sealed and flushed with argon for 5 min, then flushed with H2 for 5 min before 5 mL CO2 was added to the tubes. The cells were incubated at 37°C for 23 hr. Samples of the clarified liquid phase were analyzed by HPLC.
Larger scale experimental setup for the pressurized reactor
The experiments were carried out in two identical, stainless steel 1.2 L volume Premex reactors used as a ‘production vessel’ and gas mixture ‘ballast vessel’ (Figure S2). The reactors are fitted with customised gas-entraining mechanical stirrers, temperature and pressure probes, internal cooling coils (mainswater) and fluidised jacket (connected to a Huber 405w thermostatic bath), the latter ensuring that isothermal conditions between production and ballast vessels can be maintained. The temperature and pressure was continuously monitored, controlled and data logged by a Procontrol Ordino process interface. High pressure pH and reference probes (Corr Instruments) were added to the production vessel and pH changes were monitored over the time course of the reaction using the Rosemount 56 Emerson advanced analyzer. The ballast vessel was connected to the bioreactor via a stainless steel transfer line equipped with a back pressure regulator to ensure constant pressure gas feed. Feeding of base (sodium hydroxide 1.0-2.0 M) was conducted via a Knauer HPLC-pump K-120 connected to the production vessel with Ar back pressure. The pump rate was set up at 2.5 mL.min-1 at the beginning of the experiment and then controlled manually in order to maintain the pH above 6.8. Initially, both vessels were heated to 110°C under vacuum for 2 hr, cooled to 37°C (operational conditions) and back-filled with Ar to ensure removal of oxygen and moisture. The vessels were purged with Ar another 3-times by filling to 10 bar before being vented (< 1 bar pressure). The H2:CO2 gas ballast vessel was prepared by pressurising the reactor with first CO2 and then H2 at 40 bar total pressure maintaining the fixed pressure ratio of ca. 1:1 at 37°C and 500 rpm. The gas composition was confirmed by Agilent GC-TCD (thermal conductivity detector).
The production vessel was prepared as follows. After anaerobic fermentative growth, cultures were harvested by centrifugation and the cells washed twice in either 20 mmol.L-1 MOPS pH 7.4 or 200 mmol.L-1 Tris.HCl pH 8.0. The cell pellet was suspended in the same buffer at a final amount of 50 g.L-1 (wet weight), unless otherwise stated. Next, 500 mL of washed whole-cells was transferred into the production vessel and purged with argon for 30 min at 37°C and 500 rpm. Finally, the reaction was initiated by pressurising the transfer line and the production vessel with the H2:CO2 mixture at 2, 4, 6 or 10 bar pressure. The production vessel pressure was maintained constant over the time course of the reaction (∼23 hr) at the desired pressure by a back pressure regulator connected to the transfer line. Samples of the liquid phase in the production vessel are collected at different time points, filtered (0.2 μm PES filters) and analyzed without further dilution by HPLC (equipped with UV and RI detectors).
Quantification and Statistical Analysis
Excel (Microsoft) and SigmaPlot was used for processing data and for drawing graphs. Line plots and bar graphs show the mean ± standard deviation (n = 3) for the relative data points.
Product Analysis
Total cell protein was estimated based on the OD600 of the culture and the assumption that 1 L culture with an OD600 of 1 contains 0.25 g of dry cell of which half is assumed to be protein. Organic acid analysis and quantification was determined by HPLC using either a Dionex UltiMate 3000 system equipped with an Aminex HPX-87H column (BioRad) or a Shimadzu Prominence HPLC equipped with a Rezex ROA-Organic Acid H+ (8%) LC Column 300 × 7.8 mm and Synergi 4 μm Hydro-RP 80Å, LC-column 150 × 4.6 mm (Phenomenex). Samples of 10 or 100 μL that were previously clarified through 0.2 μm filters were applied to the columns equilibrated in 5 mmol.L-1 H2SO4 with a flow of 0.5 mL.min-1 at either 50°C/30 min/UV (210 nm) detection (Dionex system) or 40°C/30 min/RI detection (Shimadzu system). The formate eluted at either 16.2 min or 19.5 min, respectively. The composition of the gas mixture was confirmed by Agilent GC-TCD (thermal conductivity detector) and a standard curve of formic acid (1-500 mmol.L-1) was prepared.
Substrate calculations
For the small scale experiments conducted at ambient pressure, the substrate calculations were made as in Pinske et al. [25]. For the larger scale experiments conducted using high-pressure reactors, the concentration of gases in the liquid phase was calculated by considering Henry’s law using gas constants at 298 K/25°C to be 1282.1 L.atm.mol-1 and 29.4 L.atm.mol-1 for H2 and CO2, respectively, and calculating values at 310K/37C using the equation:
giving derived gas constants at 310 K/37°C of 1373.4 L.atm.mol-1 and 39.9 L.atm.mol-1 for H2 and CO2, respectively. A H2:CO2 gas mixture of composition (44:56 ratio determined experimentally in this work) at 2, 4, 6 or 10 bar pressure corresponds to 27.52, 55.05, 82.58 and 137.63 mmol.L-1 CO2 in the aqueous phase, respectively. The efficiency of CO2 conversion was calculated by determining the moles of CO2 consumed in the H2:CO2 ballast vessel during the reaction and comparing to the amount of formic acid produced. The moles of CO2 consumed were determined according to the ideal gas law considering (i) the H2:CO2 mixture is an ideal gas with a compressibility factor (Z) of 1.00000288; (ii) the gas mixture is composed of ∼44% H2 and ∼56% CO2 as determined by TCD analysis.
Acknowledgments
This was an early-stage academic research project. We thank Bob Toose (Sasol UK), Reuben Carr (Ingenza), and Liz Sockett (Nottingham) for useful comments and advice. This work was funded in the United Kingdom by the Biotechnology and Biological Sciences Research Council (BBSRC) C1net Network in Industrial Biotechnology & Bioenergy (award BB/L013800/1).
Author Contributions
Conceptualization, F.S., W.G., and F.B.; Methodology, M.R., W.G., F.B., and F.S.; Validation, M.R. and W.G.; Formal Analysis, M.R., W.G., F.B., and F.S.; Investigation, M.R. and W.G.; Resources, W.G. and F.S.; Writing, M.R., W.G., F.B., and F.S.; Visualization, M.R.; Supervision, W.G. and F.S.; Project Administration, F.S.; Funding Acquisition, W.G., F.B., and F.S.
Published: December 28, 2017
Footnotes
Supplemental Information includes three figures and can be found with this article online at https://doi.org/10.1016/j.cub.2017.11.050.
Supplemental Information
References
- 1.Kamm B., Gruber P.R., Kamm M. Wiley; 2007. Biorefineries—Industrial Processes and Products. [Google Scholar]
- 2.Appel A.M., Bercaw J.E., Bocarsly A.B., Dobbek H., DuBois D.L., Dupuis M., Ferry J.G., Fujita E., Hille R., Kenis P.J. Frontiers, opportunities, and challenges in biochemical and chemical catalysis of CO2 fixation. Chem. Rev. 2013;113:6621–6658. doi: 10.1021/cr300463y. [DOI] [PMC free article] [PubMed] [Google Scholar]
- 3.Schuchmann K., Müller V. Direct and reversible hydrogenation of CO2 to formate by a bacterial carbon dioxide reductase. Science. 2013;342:1382–1385. doi: 10.1126/science.1244758. [DOI] [PubMed] [Google Scholar]
- 4.Alissandratos A., Kim H.K., Easton C.J. Formate production through carbon dioxide hydrogenation with recombinant whole cell biocatalysts. Bioresour. Technol. 2014;164:7–11. doi: 10.1016/j.biortech.2014.04.064. [DOI] [PubMed] [Google Scholar]
- 5.Ceccaldi P., Schuchmann K., Muller V., Elliott S.J. The hydrogen dependent CO2 reductase: the first completely CO tolerant FeFe-hydrogenase. Energy Environ. Sci. 2017;10:503–508. [Google Scholar]
- 6.McDowall J.S., Murphy B.J., Haumann M., Palmer T., Armstrong F.A., Sargent F. Bacterial formate hydrogenlyase complex. Proc. Natl. Acad. Sci. USA. 2014;111:E3948–E3956. doi: 10.1073/pnas.1407927111. [DOI] [PMC free article] [PubMed] [Google Scholar]
- 7.Thauer R.K., Jungermann K., Decker K. Energy conservation in chemotrophic anaerobic bacteria. Bacteriol. Rev. 1977;41:100–180. doi: 10.1128/br.41.1.100-180.1977. [DOI] [PMC free article] [PubMed] [Google Scholar]
- 8.Yu X., Niks D., Mulchandani A., Hille R. Efficient reduction of CO2 by the molybdenum-containing formate dehydrogenase from Cupriavidus necator (Ralstonia eutropha) J. Biol. Chem. 2017;292:16872–16879. doi: 10.1074/jbc.M117.785576. [DOI] [PMC free article] [PubMed] [Google Scholar]
- 9.Niks D., Duvvuru J., Escalona M., Hille R. Spectroscopic and kinetic properties of the molybdenum-containing, NAD+-dependent formate dehydrogenase from Ralstonia eutropha. J. Biol. Chem. 2016;291:1162–1174. doi: 10.1074/jbc.M115.688457. [DOI] [PMC free article] [PubMed] [Google Scholar]
- 10.Maia L.B., Fonseca L., Moura I., Moura J.J. Reduction of carbon dioxide by a molybdenum-containing formate dehydrogenase: a kinetic and mechanistic study. J. Am. Chem. Soc. 2016;138:8834–8846. doi: 10.1021/jacs.6b03941. [DOI] [PubMed] [Google Scholar]
- 11.Carroll J.J., Slupsky J.D., Mather A.E. The solubility of carbon dioxide in water at low pressure. J. Phys. Chem. Ref. Data. 1991;20:1201–1209. [Google Scholar]
- 12.Lopes M., Belo I., Mota M. Over-pressurized bioreactors: application to microbial cell cultures. Biotechnol. Prog. 2014;30:767–775. doi: 10.1002/btpr.1917. [DOI] [PubMed] [Google Scholar]
- 13.Renon H., Prausnitz J.M. Local compositions in thermodynamic excess functions for liquid mixtures. AIChE J. 1968;14:135–144. [Google Scholar]
- 14.Sawers G. The hydrogenases and formate dehydrogenases of Escherichia coli. Antonie van Leeuwenhoek. 1994;66:57–88. doi: 10.1007/BF00871633. [DOI] [PubMed] [Google Scholar]
- 15.Zelcbuch L., Lindner S.N., Zegman Y., Vainberg Slutskin I., Antonovsky N., Gleizer S., Milo R., Bar-Even A. Pyruvate formate-lyase enables efficient growth of Escherichia coli on acetate and formate. Biochemistry. 2016;55:2423–2426. doi: 10.1021/acs.biochem.6b00184. [DOI] [PubMed] [Google Scholar]
- 16.Schlindwein C., Giordano G., Santini C.L., Mandrand M.A. Identification and expression of the Escherichia coli fdhD and fdhE genes, which are involved in the formation of respiratory formate dehydrogenase. J. Bacteriol. 1990;172:6112–6121. doi: 10.1128/jb.172.10.6112-6121.1990. [DOI] [PMC free article] [PubMed] [Google Scholar]
- 17.Lüke I., Butland G., Moore K., Buchanan G., Lyall V., Fairhurst S.A., Greenblatt J.F., Emili A., Palmer T., Sargent F. Biosynthesis of the respiratory formate dehydrogenases from Escherichia coli: characterization of the FdhE protein. Arch. Microbiol. 2008;190:685–696. doi: 10.1007/s00203-008-0420-4. [DOI] [PubMed] [Google Scholar]
- 18.Sawers G., Watson G. A glycyl radical solution: oxygen-dependent interconversion of pyruvate formate-lyase. Mol. Microbiol. 1998;29:945–954. doi: 10.1046/j.1365-2958.1998.00941.x. [DOI] [PubMed] [Google Scholar]
- 19.Reeve H.A., Ash P.A., Park H., Huang A., Posidias M., Tomlinson C., Lenz O., Vincent K.A. Enzymes as modular catalysts for redox half-reactions in H2-powered chemical synthesis: from biology to technology. Biochem. J. 2017;474:215–230. doi: 10.1042/BCJ20160513. [DOI] [PMC free article] [PubMed] [Google Scholar]
- 20.Sawers R.G., Ballantine S.P., Boxer D.H. Differential expression of hydrogenase isoenzymes in Escherichia coli K-12: evidence for a third isoenzyme. J. Bacteriol. 1985;164:1324–1331. doi: 10.1128/jb.164.3.1324-1331.1985. [DOI] [PMC free article] [PubMed] [Google Scholar]
- 21.Maeda T., Sanchez-Torres V., Wood T.K. Escherichia coli hydrogenase 3 is a reversible enzyme possessing hydrogen uptake and synthesis activities. Appl. Microbiol. Biotechnol. 2007;76:1035–1042. doi: 10.1007/s00253-007-1086-6. [DOI] [PubMed] [Google Scholar]
- 22.Bassegoda A., Madden C., Wakerley D.W., Reisner E., Hirst J. Reversible interconversion of CO2 and formate by a molybdenum-containing formate dehydrogenase. J. Am. Chem. Soc. 2014;136:15473–15476. doi: 10.1021/ja508647u. [DOI] [PubMed] [Google Scholar]
- 23.Woods D.D. Hydrogenlyases: the synthesis of formic acid by bacteria. Biochem. J. 1936;30:515–527. doi: 10.1042/bj0300515. [DOI] [PMC free article] [PubMed] [Google Scholar]
- 24.Nitschke W., Russell M.J. Hydrothermal focusing of chemical and chemiosmotic energy, supported by delivery of catalytic Fe, Ni, Mo/W, Co, S and Se, forced life to emerge. J. Mol. Evol. 2009;69:481–496. doi: 10.1007/s00239-009-9289-3. [DOI] [PubMed] [Google Scholar]
- 25.Pinske C., Sargent F. Exploring the directionality of Escherichia coli formate hydrogenlyase: a membrane-bound enzyme capable of fixing carbon dioxide to organic acid. MicrobiologyOpen. 2016;5:721–737. doi: 10.1002/mbo3.365. [DOI] [PMC free article] [PubMed] [Google Scholar]
- 26.Waight A.B., Love J., Wang D.N. Structure and mechanism of a pentameric formate channel. Nat. Struct. Mol. Biol. 2010;17:31–37. doi: 10.1038/nsmb.1740. [DOI] [PMC free article] [PubMed] [Google Scholar]
- 27.Wang Y., Huang Y., Wang J., Cheng C., Huang W., Lu P., Xu Y.N., Wang P., Yan N., Shi Y. Structure of the formate transporter FocA reveals a pentameric aquaporin-like channel. Nature. 2009;462:467–472. doi: 10.1038/nature08610. [DOI] [PubMed] [Google Scholar]
- 28.Lv X., Liu H., Ke M., Gong H. Exploring the pH-dependent substrate transport mechanism of FocA using molecular dynamics simulation. Biophys. J. 2013;105:2714–2723. doi: 10.1016/j.bpj.2013.11.006. [DOI] [PMC free article] [PubMed] [Google Scholar]
- 29.Lü W., Du J., Wacker T., Gerbig-Smentek E., Andrade S.L., Einsle O. pH-dependent gating in a FocA formate channel. Science. 2011;332:352–354. doi: 10.1126/science.1199098. [DOI] [PubMed] [Google Scholar]
- 30.Wiechert M., Beitz E. Mechanism of formate-nitrite transporters by dielectric shift of substrate acidity. EMBO J. 2017;36:949–958. doi: 10.15252/embj.201695776. [DOI] [PMC free article] [PubMed] [Google Scholar]
- 31.Padan E., Bibi E., Ito M., Krulwich T.A. Alkaline pH homeostasis in bacteria: new insights. Biochim. Biophys. Acta. 2005;1717:67–88. doi: 10.1016/j.bbamem.2005.09.010. [DOI] [PMC free article] [PubMed] [Google Scholar]
- 32.Nicholls D.G., Ferguson S.J. Academic Press; 2013. Bioenergetics 4. [Google Scholar]
- 33.Gregg C.M., Goetzl S., Jeoung J.H., Dobbek H. AcsF catalyzes the ATP-dependent insertion of nickel into the Ni,Ni-[4Fe4S] cluster of acetyl-CoA synthase. J. Biol. Chem. 2016;291:18129–18138. doi: 10.1074/jbc.M116.731638. [DOI] [PMC free article] [PubMed] [Google Scholar]
- 34.Choi E.S., Min K., Kim G.J., Kwon I., Kim Y.H. Expression and characterization of Pantoea CO dehydrogenase to utilize CO-containing industrial waste gas for expanding the versatility of CO dehydrogenase. Sci. Rep. 2017;7:44323. doi: 10.1038/srep44323. [DOI] [PMC free article] [PubMed] [Google Scholar]
- 35.Jens C.M., Nowakowski K., Scheffczyk J., Leonhard K., Bardow A. CO from CO2 and fluctuating renewable energy via formic-acid derivatives. Green Chem. 2016;18:5621–5629. [Google Scholar]
- 36.Yishai O., Lindner S.N., Gonzalez de la Cruz J., Tenenboim H., Bar-Even A. The formate bio-economy. Curr. Opin. Chem. Biol. 2016;35:1–9. doi: 10.1016/j.cbpa.2016.07.005. [DOI] [PubMed] [Google Scholar]
- 37.Aresta M., Dibenedetto A. Utilisation of CO2 as a chemical feedstock: opportunities and challenges. Dalton Trans. 2007;(28):2975–2992. doi: 10.1039/b700658f. [DOI] [PubMed] [Google Scholar]
- 38.Yishai O., Goldbach L., Tenenboim H., Lindner S.N., Bar-Even A. Engineered assimilation of exogenous and endogenous formate in Escherichia coli. ACS Synth. Biol. 2017;6:1722–1731. doi: 10.1021/acssynbio.7b00086. [DOI] [PubMed] [Google Scholar]
- 39.Sargent F., Stanley N.R., Berks B.C., Palmer T. Sec-independent protein translocation in Escherichia coli. A distinct and pivotal role for the TatB protein. J. Biol. Chem. 1999;274:36073–36082. doi: 10.1074/jbc.274.51.36073. [DOI] [PubMed] [Google Scholar]
- 40.Casadaban M.J., Cohen S.N. Lactose genes fused to exogenous promoters in one step using a Mu-lac bacteriophage: in vivo probe for transcriptional control sequences. Proc. Natl. Acad. Sci. USA. 1979;76:4530–4533. doi: 10.1073/pnas.76.9.4530. [DOI] [PMC free article] [PubMed] [Google Scholar]
- 41.Peters J.E., Thate T.E., Craig N.L. Definition of the Escherichia coli MC4100 genome by use of a DNA array. J. Bacteriol. 2003;185:2017–2021. doi: 10.1128/JB.185.6.2017-2021.2003. [DOI] [PMC free article] [PubMed] [Google Scholar]
- 42.Begg Y.A., Whyte J.N., Haddock B.A. Identification of mutants of Escherichia coli deficient in formate dehydrogenase and nitrate reductase activities using dye indicator plates. FEMS Microbiol. Lett. 1977;2:47–50. [Google Scholar]
Associated Data
This section collects any data citations, data availability statements, or supplementary materials included in this article.