Abstract
A method for performing noninvasive blood glucose measurements was developed. The method is based on mid-infrared absorption spectroscopy and uses only a few wavenumbers to measure blood glucose levels in vivo unconditionally. We found that the regression of blood glucose levels using only three wavenumbers, which were selected using a series cross-validation technique, realized accuracies comparable to those of cases in which a greater number of wavenumbers are used. In addition, we demonstrated the performance of this model through correlations among different types of data.
OCIS codes: (120.3890) Medical optics instrumentation; (300.6340) Spectroscopy, infrared; (060.2390) Fiber optics, infrared; (300.6300) Spectroscopy, Fourier transforms
1. Introduction
In recent years, the number of patients diagnosed with diabetes has increased worldwide. Methods that allow noninvasive blood glucose measurement, and which can measure blood glucose levels without the need for blood collection, are becoming increasingly desirable. In this regard, various methods were proposed [1] including technologies that use radiation in the near-infrared [2] or mid-infrared [3] regions, Raman spectroscopy [4], and photoacoustics [5,6]. The methods using radiation in the mid-infrared region where glucose exhibits strong absorption are advantageous for improving the sensitivity of the measurement, when compared to methods using radiation in the near-infrared regions. However, a major problem with the practical application of these noninvasive blood glucose measurement techniques is the low measurement accuracy [7]; therefore, measurement performance under various conditions is particularly important, especially during actual use.
In this paper, we focus on two problems. The first involves finding a combination of a few wavenumbers that are suitable for noninvasive blood glucose measurements in the mid-infrared region. As spectrometers for measuring mid-infrared radiation are usually expensive, bulky, and need external cooling, in consideration of practical device configuration, it is preferable to use a laser light source such as a quantum cascade laser (QCL). However, because the number of laser light sources is determined by the number of wavenumbers used, it is necessary to reduce the number of wavenumbers used to less than five wavenumbers, for practical use. Although a method that uses a wavenumber-tunable external-cavity QCL, instead of a fixed-wavenumber QCL, has been proposed, wavenumber-tunable QCLs are expensive and have limitations with respect to stability. In the case of near-infrared radiation, several reports on wavenumber selection related to noninvasive blood glucose measurement have been published [8,9]; however, similar studies have not yet been extended to mid-infrared radiation satisfactorily. Further, reports of methods using near-infrared radiation mentioned that more than five wavenumbers were required. The second point involves obtaining a predictive model capable of good performance under various conditions. Many variable factors affect the accuracy of noninvasive blood glucose measurement, such as the difference in meal content, physical differences between individual patients, and temperature during measurement. It is difficult to apply these factors in practical situations without unconditional predictive models. Although the accuracy could be improved by performing calibrations according to the conditions, frequent calibrations would be required. In this study, instead of the leave-one-out cross validation (LOOCV), which is generally used as a verification method for the prediction model, wavenumber selection is performed by using the more stringent series cross validation, in which different series of data groups are used simultaneously for model estimation and accuracy verification. With series cross validation, the possibility of dependence on a specific environment or specific data can be reduced, and an unconditional wavenumber selection and prediction model can be constructed.
2. Experiment
A method using the spectral characteristics of oral mucosa for monitoring blood glucose noninvasively was proposed previously [10]. In this work, we propose a method for measuring the absorbance of an object, using an attenuated total reflection (ATR) prism and hollow fibers [11], which can efficiently transmit mid-infrared radiation to the object [12]. Moreover, we report the results of the noninvasive measurement of blood glucose levels, obtained using this method [13,14]. Figure 1 shows the outline of the measurement system used in this study. By using a hollow fiber as a transmission line, the absorbance of the oral mucosa is measured by propagating radiation to an ATR prism sandwiched inside the mouth, between the upper and lower lips. ZnS is chosen as the material for the ATR prism, because of its nontoxicity. Two Fourier transform infrared spectroscopy (FTIR) devices (Bruker Tensor 27 and Bruker Vertex 70) are used as mid-infrared spectrometers. Measurements are obtained by using ATR prisms (prism1 and prism2) of different thicknesses. The number of reflections of radiation in the ATR is larger and the sensitivity is higher in the thinner prism1 (t = 1.6 mm), compared to prism2 (t = 2.4 mm).
Fig. 1.
Experimental setup and dimensions of ATR prism.
We used two types of self-measuring devices (Terumo, Medisafe Mini; and Johnson and Johnson, One Touch UltraView) that measure blood glucose concentrations, as references. For the same blood sample, as there was a difference in the levels of blood glucose measured by the two reference devices, the values measured by the Medisafe Mini were corrected using a linear equation to match those of the OneTouch Ultra View. The measurement began after a meal and was continued until the blood sugar level settled, approximately 3 h after the meal. During the measurement, we measured the blood glucose levels by collecting blood samples, and recorded the spectrum of the oral mucosa. Each series of data groups were obtained from a series of measurements taken on a single day.
In this work, two data sets, of which the characteristics are listed in Table 1, were prepared from the measured data. Data set 1, which contains 131 data points from 13 series of measurements performed over five months on one healthy adult, was constructed by requiring the examinee to take a variety of meals before the measurements. Data set 2 contains 414 data points from 18 series, obtained from five healthy adults over 15 months. For this data set, the measurements were performed after taking various meals or having a glucose drink that contained 75 g of glucose dissolved in 150 ml of water. Data set 2 also includes the data acquired from different ATR prisms and different FTIR devices. The numbers in parentheses in the table indicate the number of the corresponding series of conditions. First, using series cross validation for data set 1, we narrow down the correlated wavenumbers and construct a prediction model. Next, using the model obtained in data set 1, we confirm if the prediction results for the data of data set 2 are correlated with the blood glucose levels. The data of data set 2 differ from those of data set 1 in terms of the season in which they were acquired, the person, meal, and measuring apparatus. Therefore, if correlations are found with data set 2, using the prediction model constructed using only data set 1, it can be concluded that blood glucose measurements suitable for use under various conditions have been achieved, regardless of the conditions in the prediction model. Our protocol was approved by the ethical committee on the Use of Humans as Experimental Subjects of Tohoku University, and informed consent was obtained from the examinees.
Table 1. Data set properties.
| Data set 1 | Data set 2 | |
|---|---|---|
| Number of samples | 131 | 414 |
| Number of subjects | 1 | 5 |
| Number of series | 13 | 18 |
| Kind of meal | Meal (13) | Meal (16)/Glucose drink (2) |
| FTIR apparatus | Tensor (13) | Vertex (5)/Tensor (13) |
| ATR Prism | Prism1(13) | Prism1(3)/Prism2(15) |
| Blood glucose monitor | OneTouch UltraView (13) | OneTouch UltraView (4)/Medisafe Mini (14) |
| Data acquisition date | From Oct. 2016 to Jan. 2017 |
From Jun. 2015 to Nov. 2016 |
3. Processing
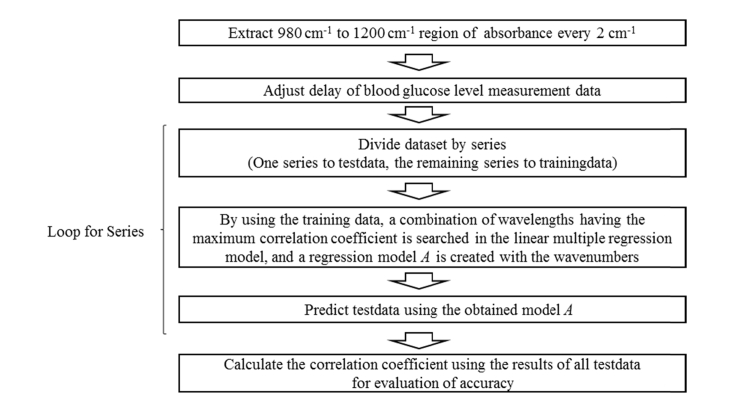
Figure 2 shows the process flowchart for the accuracy evaluation of the wavenumber selection used in this study. The spectral information was obtained by focusing on the region from 980 cm−1 to 1200 cm−1, which fits the absorption band for a glucose solution and from which the absorbance spectrum is extracted every 2 cm−1. When we were creating the data set, we deleted those samples of which the spectra were judged to be abnormal.
Fig. 2.
Process flowchart of accuracy evaluation for wavenumber selection.
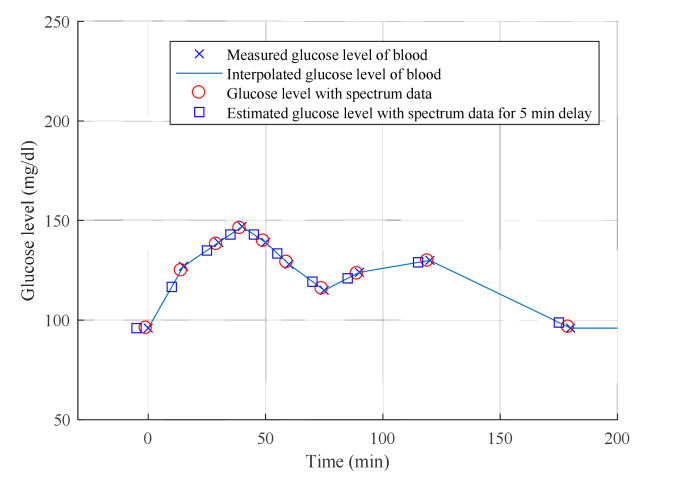
The penetration depth of mid-infrared radiation is limited to a few microns, and therefore, mid-infrared ATR spectroscopy can detect glucose in the ISF (interstitial fluid) that reflects the blood glucose level [15]. It was also reported that the glucose level in the tissue fluid takes more time to reach the value of the level in the blood vessel [16]. Therefore, we had to check the effect of this delay on the regression accuracy. This was achieved by delaying the time of data acquisition of the blood glucose level relative to the data acquisition time of the corresponding spectrum, from 0 min to 40 min in increments of 2 min. The value obtained by linear interpolation is taken as the blood glucose level at that time during spectrum measurement. Blood glucose levels below 0 min are interpolated to the blood glucose level at 0 min, because the blood glucose level during fasting is considered invariant. Figure 3 shows an example of the interpolation results for the blood glucose levels for delays of 0 min and 5 min.
Fig. 3.
Example of interpolation of blood glucose levels for no delay and 5 min delay.
Although partial least-squares (PLS) regression [17], support vector machines [18], and neural networks [19] have been proposed as models that regress spectral data to blood glucose levels, a simple multiple linear regression (MLR) model is used in this work. MLR has a small number of parameters and avoids over-fitting to specific conditions or data. The prediction model is shown in Eq. (1). Here, is the predicted blood glucose concentration, represents the measured absorbance spectrum data, and is a regression model with sparse coefficients.
| (1) |
The problem to be solved to obtain the prediction model is shown in Eq. (2). Here, is the number of wavenumbers to be used. The model optimization problem is to find a sparse regression model that minimizes the least-squares error when the number of wavenumbers is limited.
| (2) |
We consider the number of wavenumbers to vary from 1 to 3, and we search for combinations of all wavenumbers for each value of , such that the correlation coefficients of the test data are maximized for model optimization. We choose to be lower than 3, owing to the limitations of the calculation time required to perform a full search. In addition, we compare the results of the MLR method using a few wavenumbers with those obtained from PLS regression using a larger number of wavenumbers, which is generally used as a spectrum analysis and regression model for blood glucose levels.
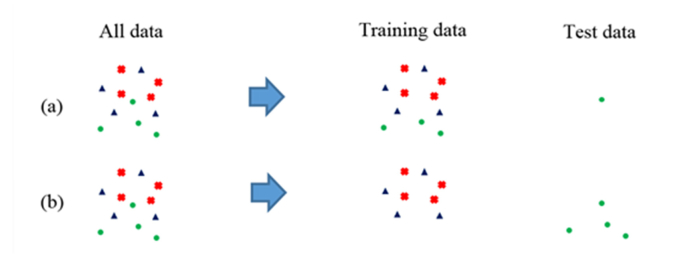
The verification method we use is described below. In the common LOOCV, one point in the data set is set as the test data, and the remaining points are set as the training data. A prediction model is created using the training data, and the precision of the test data is verified. Therefore, if a change in the blood glucose level after a certain meal is taken as one series, the training data and test data will contain the same series of data. It is easy to predict the blood glucose levels in situations where the meal is the same as that used in the training case. Therefore, even if the required accuracy is obtained using LOOCV, the possibility exists that the blood glucose levels for different meals cannot be predicted. Furthermore, if we use LOOCV to select a wavenumber with high correlation, the wavenumber may not be appropriate for a general situation. In contrast, series cross validation is a method in which only one series out of all data is used as the test data, and all the others are set as the training data. Figure 4 compares the principles of LOOCV and series cross validation. The points indicate samples; their colors and shapes indicate the differences between the series. The verification using series cross validation is more stringent than the verification using the LOOCV, and it produces results that are closer to the actual situations. If the accuracy is high in series cross validation, the possibility of over-fitting to the training data is low, and there is a high possibility that prediction accuracy can be ensured even if unknown data are present.
Fig. 4.
Difference between (a) leave-one-out cross validation and (b) series cross validation. The different colors and shapes show different series of data.
By choosing a combination of wavenumbers that can produce good verification results using series cross validation, an unconditional prediction model can be obtained. Moreover, by reducing the number of wavenumbers, prediction is performed with minimal data, and the generalization performance is improved. As a result, the performance of the prediction model under various conditions tends to improve.
4. Results
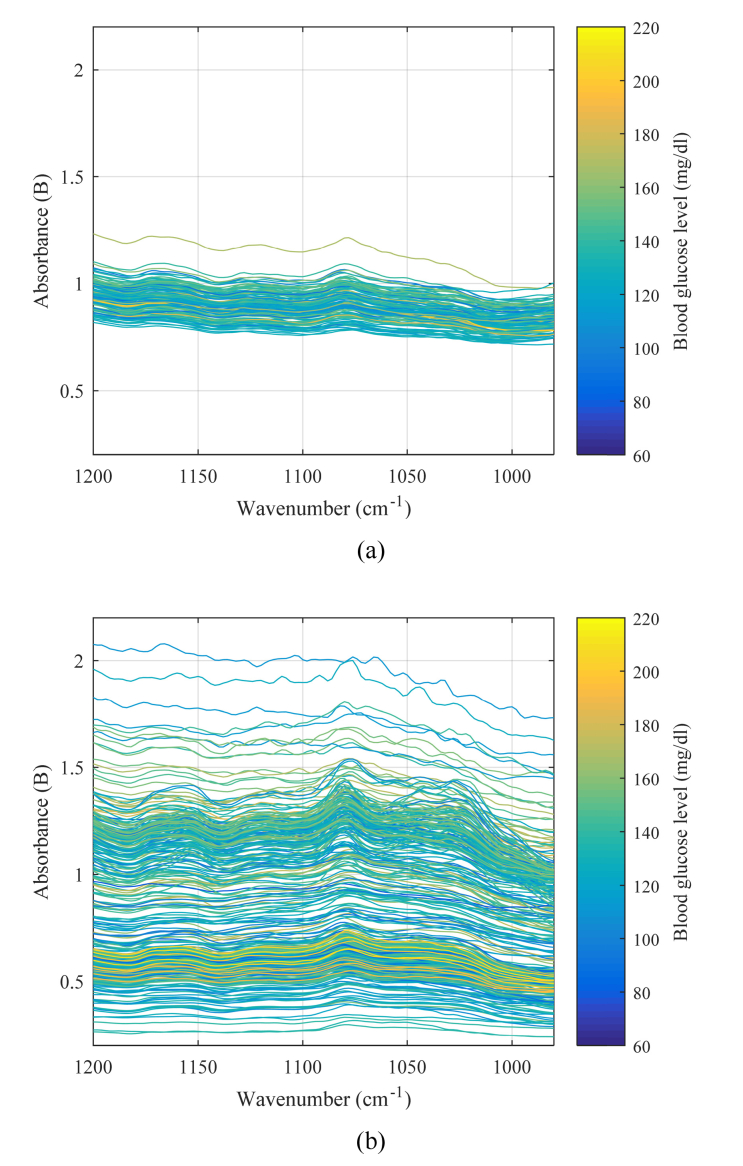
The absorption spectra of data set 1 and 2 are shown in Fig. 5(a) and Fig. 5 (b), respectively. The vertical and horizontal axes represent the absorbance and the wavenumber, respectively. The color bar shows the blood glucose levels when the delay is 0 min. Since data set 2 covers various conditions, fluctuations of the data in data set 2 are larger than those in data set 1.
Fig. 5.
Measured absorption spectra of (a) data set 1 and (b) data set 2.
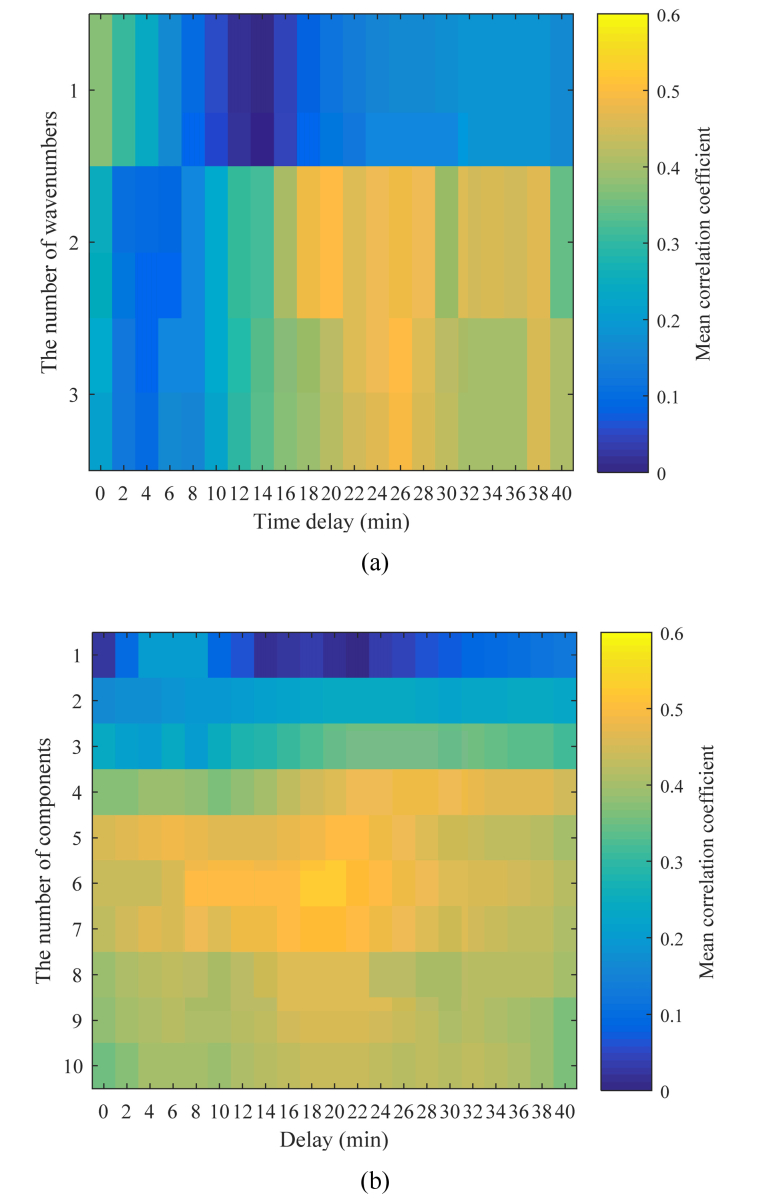
First, we narrow down the correlated wavenumbers using data set 1. Figure 6(a) shows the correlation coefficient map for the delay and the number of wavenumbers in the MLR models with series cross validation. The colors in Fig. 6(a) indicate the means of the correlation coefficients for each series. Correlation coefficient maxima are observed in the case of two and three wavenumbers, with delays of approximately 20 to 30 min. The maximum correlation coefficient is obtained in the case of three wavenumbers with a 26-min delay, and the value of the correlation coefficient is 0.49. The absence of a large correlation at a delay of 0 min indicates that it takes time for the blood glucose level concentration to respond to the changes in the spectrum.
Fig. 6.
(a) Mean correlation coefficient and number of wavenumbers for MLR as a function of delay and (b) mean correlation coefficient and number of components for PLS as a function of delay.
Figure 6(b) shows the correlation coefficient map for the delay and the number of components in the PLS model with series cross validation. High values of correlation coefficients are observed for the cases where the number of components ranges from four to seven, with a delay of approximately 20 min. The maximum correlation coefficient of 0.51 is obtained for the case with six components with a delay of 20 min. Note that because one component in the PLS regression has weights on all wavenumbers it contains information on many wavenumbers rather than a single wavenumber. The correlation coefficient maps indicate that the proposed MLR method using three wavenumbers produces a correlation coefficient that is close to the value obtained by PLS regression using a larger number of components.
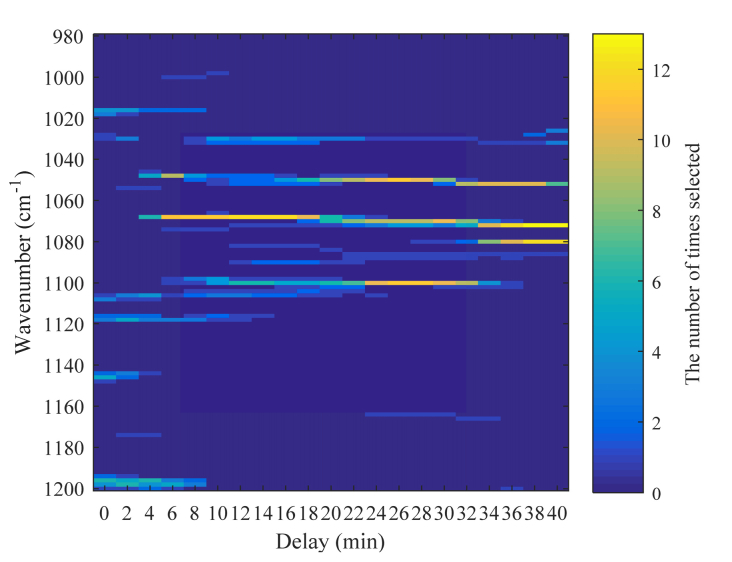
Figure 7 presents a histogram that shows the number of times each wavenumber is selected, and this is plotted for different delays in the case in which the number of wavenumbers is 3. The calculation was performed for data set 1 containing 13 series of data. Therefore, the histogram shows the number of times the wavenumbers were selected in the 13 models created with different combinations of training data and test data. The wavenumbers selected more frequently can be observed clearly, and it is found that 1050 cm−1, 1070 cm−1, and 1100 cm−1 are selected frequently in the case of a delay of approximately 20 min to 30 min, where the correlation is large. In addition, it is suggested that the selected wavenumbers change according to the delay, which may be because the appropriate wavenumber is changed in relation to the metabolism in the body. Although the selected wavenumbers are in the absorption band of glucose, they do not necessarily correspond to the absorption peaks of glucose.
Fig. 7.
Histogram of the number of wavenumbers selected as a function of the wavenumber and delay.
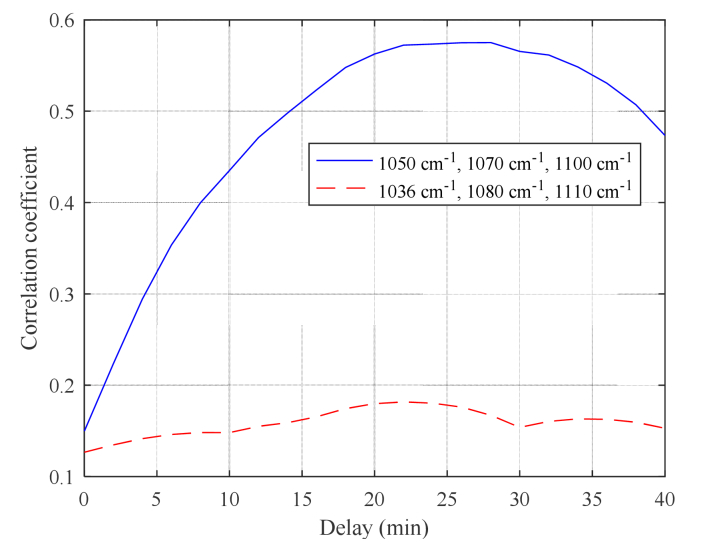
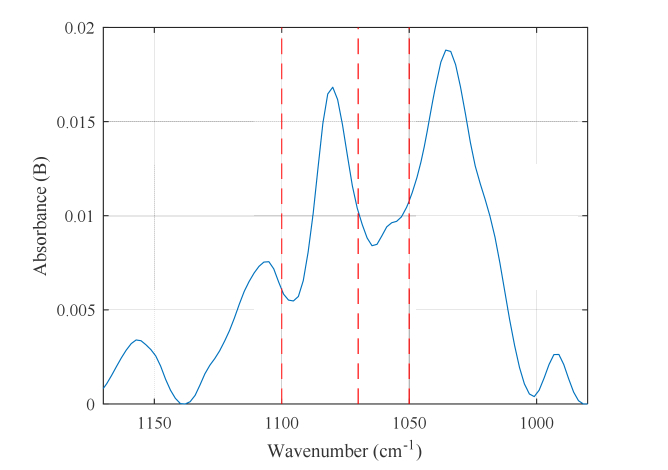
Figure 8 shows the changes in the correlation coefficient, with respect to the delay in series cross validation, when the selected wavenumbers are 1050 cm−1, 1070 cm−1, and 1100 cm−1. The maximum correlation is obtained for a delay of 26 min. For comparison, the results obtained with 1036 cm−1, 1080 cm−1, and 1110 cm−1, which correspond to the absorption peak wavenumbers of the glucose solution, are also shown in Fig. 8 by the red dashed line. Figure 9 shows the measured absorption spectra of a glucose solution with a 1% concentration obtained using an ATR spectroscope. The dashed lines in the figure indicate the selected wavenumbers (1050 cm−1, 1070 cm−1, and 1100 cm−1). For comparison purposes, we selected 1036 cm−1, 1080 cm−1, and 1110 cm−1 according to the absorbance peak of the glucose solution shown in Fig. 9.
Fig. 8.
Correlation coefficient as a function of delay for the MLR model using selected wavenumbers (1050 cm−1, 1070 cm−1, and 1100 cm−1) and glucose absorption peaks (1036 cm−1, 1080 cm−1, and 1110 cm−1).
Fig. 9.
Measured absorption spectra of a 1% glucose solution. The dashed lines indicate the selected wavenumbers (1050 cm−1, 1070 cm−1, and 1100 cm−1).
When using the absorption peak wavenumbers of glucose, only the correlation coefficients that are much lower than those obtained with the selected wavenumbers are shown above. This may be because the absorption spectra measured in vivo overlap with the absorption spectra of many interfering substances. None of the wavenumbers 1050 cm−1, 1070 cm−1, and 1100 cm−1 corresponds to the peaks of the glucose solution shown in Fig. 9. This result indicates that not only is glucose detected directly, but it is also detected including components that are generated at the time of metabolism. Although validation by “spectral assignment” of those components is under way, our current considerations are presented in the following discussion.
Only the coefficient of 1070 cm−1 is positive at the selected wavenumbers 1050 cm−1, 1070 cm−1, and 1100 cm−1 in the MLR model (refer to Eq. (3)). This seems to suggest that a certain substance that absorbs at 1070 cm−1 has an important role in the measurement. Both glucose and its coupled chain glycogen show a strong absorption of the C-O bond at 1080 cm−1 [20]. In addition, it is reported that phosphorus oxide, which is an intermediate product of both, has strong absorption near 1080 cm−1 [21]. Furthermore, the absorption spectra of substances related to the sugar metabolic pathway were measured [22,23] and it has been reported that the intermediate product F6P (fructose 6 phosphate) in the glycolytic system in somatic cells other than the liver absorbs at 1068–1070 cm−1. In the absorption region of glucose (980–1200 cm−1), the metabolites have a similar structure and their absorption spectra are superimposed in a complicated manner. In addition, their concentrations are closely related to each other and change in both directions. Therefore, this time, 1070 cm−1, at which none of the other metabolic products absorb, is chosen and it may follow the change in the concentration of F6P in the cells produced immediately after the uptake of glucose.
The correlation coefficients are small for the combination of 1036 cm−1, 1080 cm−1, and 1110 cm−1, which are the peak wavenumbers of the glucose solution because other interfering substances such as phospholipids and nucleic acids in saliva and mucosa, and carbon hydrate residues attached to collagen also exhibit absorption peaks at the above wavenumbers. This is also supported by the fact that there are differences in the spectral shapes of the glucose solution shown in Fig. 9 and the measured spectrum (Fig. 5) of oral mucosa. We considered the interfering substances to change depending on conditions such as the type of meal. Among them, correlation exists regardless of the condition if 1050 cm−1, 1070 cm−1, and 1100 cm−1 are selected; therefore, obtaining the measurement at these three wavenumbers seems to avoid the influence of other interfering substances.
It was recently reported that the time delay in reflecting the blood glucose concentration on the ISF is less than 10 min, as shown in [24,25]. However, the optimum time delay is more than 20 min in our study because, as described above, the measurements at the selected wavenumbers do not detect only glucose in the interstitial fluid, but also detect the products formed when sugar metabolizes. High correlation after a delay of 20 min shows that glucose and other substances are both measured. We consider the low correlation numbers obtained when the time delay is less than 10 min to be caused by interfering substances that are superimposed upon the absorption spectrum for glucose. Recently, it was reported that the peak in the infrared absorption spectrum of blood after the oral glucose tolerance test in the region of 1050 cm−1 to 1080 cm−1 shows the maximum value within approximately 20 min after the blood glucose level rose [26]. The wavenumber of 1070 cm−1 chosen in this study is within that region, and there is a high possibility that it is related. This result shows that the metabolic products with absorption in this region can be expected to continue to increase until the maximum concentration of glucose is delayed by about 20 min. Therefore, the delay at the wavenumber chosen in this study can be attributed to the time required for glucose to metabolize.
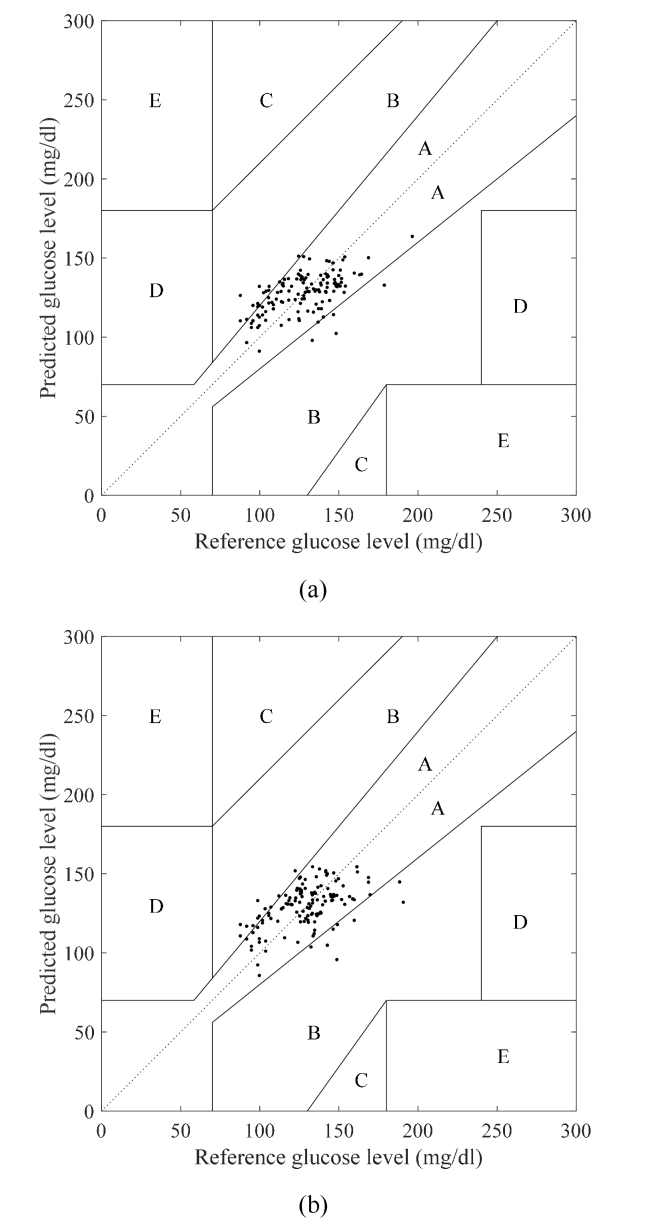
Figure 10(a) shows the Clarke error grid [27] combining all series in the series cross-validation when using the wavenumbers 1050 cm−1, 1070 cm−1, and 1100 cm−1. The delay was set to 26 min, at which the correlation coefficient attained its maximum value, as shown in Fig. 6(a). Region A contains 86.3% of the samples and the correlation coefficient is 0.57, which shows that good accuracy is obtained. This demonstrates that the prediction of blood glucose levels with this degree of accuracy is possible, even when only three wavenumbers are used. Figure 10(b) shows the Clarke error grid that combines all series in the series cross validation for the PLS regression with six components and a delay of 20 min for the highest correlation coefficient shown in Fig. 6(b). In this case, 86.3% of the samples are in region A and the correlation coefficient is 0.51. These results show that the proposed MLR method using three wavenumbers gives results that are comparable to those obtained by PLS regression using a larger number of wavenumbers.
Fig. 10.
Clark error grid of data set 1 for (a) MLR estimation model using 1050 cm−1, 1070 cm−1, and 1100 cm−1 and (b) PLS model.
Next, we evaluated the accuracy of the prediction model obtained on the basis of data set 1 by applying the model to data set 2 for prediction. In data set 2, we eliminated the influence of the difference in the number of reflections between the two prisms by normalizing the spectra with respect to the absorbance at 1000 cm−1. This wavenumber corresponds to a low-intensity area in the spectrum, which is considered to indicate that glucose exhibits low absorption at that point. The prediction MLR model was created using the wavenumbers of 1050 cm−1, 1070 cm−1, and 1100 cm−1, using all the data of data set 1 normalized to 1000 cm−1, similar to the approach that was followed to process data set 2. The MLR model obtained is shown in Eq. (3). Here, is the predicted blood glucose level and is the measured absorbance at wavenumber .
| (3) |
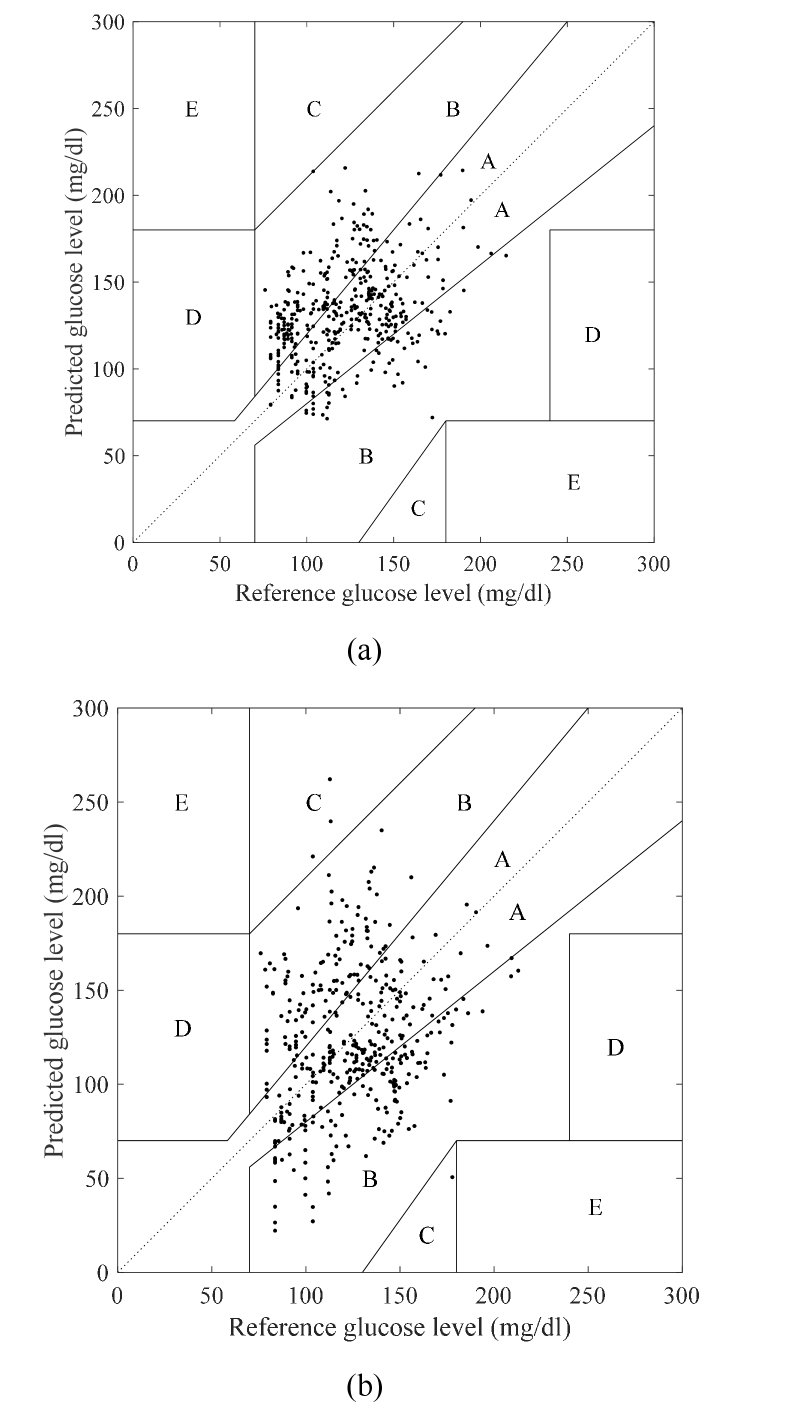
Figure 11(a) shows the Clark error grid for data set 2 in the MLR model, obtained from data set 1. The delay was set to 26 min. Figure 11(b) shows the Clark error plot of data set 2 obtained in a similar manner, but by using the PLS model. The delay was set to 20 min. The correlation coefficient of the three-wavenumber MLR model is 0.36, and 100% of the samples are located in the region A + B. For the PLS model, the correlation coefficient is 0.25, and 98.8% of the samples are in the area A + B. Compared to the PLS regression model, the correlation coefficients obtained for the three-wavenumber MLR model are superior. Significant positive correlation is found in the results of the three-wavenumber MLR model (p <.001). Although the conditions of data set 1 and data set 2 are different, correlation can be obtained for data set 2, without calibration. This shows that a regression model for blood glucose level, which is not limited by any certain condition, is realized. It is observed that the correlation obtained with data set 2 for the three-wavenumber MLR model is superior to that obtained with the PLS model because reducing the number of wavenumbers improves the generalization performance of the estimation model. We recognize that there is a possibility that the performance of our model in terms of accuracy is insufficient for actual medical applications. However, the required precision may possibly be satisfied if the target device is simple healthcare equipment for routine monitoring. Regardless of the application considered, in noninvasive glucose monitoring, we consider the most important aspect to be stable measurement that is independent from external conditions. There have been various reports on noninvasive blood glucose measurement in the past, and there are many good results that are more accurate than this report. It is easy to obtain good accuracy under a specific condition. However, it is very difficult to obtain good accuracy for various conditions using a single model, and we believe that the method proposed in this report, which achieved a certain degree of accuracy for various conditions, is important.
Fig. 11.
Clark error grid of data set 2 for (a) MLR model using 1050 cm−1, 1070 cm−1, and 1100 cm−1 and (b) PLS model.
Because the selection of the wavenumber was unconditional in this study, in the future, we plan to improve the accuracy by employing the following strategy. First, we intend increasing the amount of data, and then, we hope to improve the accuracy by using a model based on a machine-learning algorithm with higher expression capability. If the range of wavenumbers is narrowed down, the dimensions of the features are small, and this is expected to prevent the problem of over-fitting when using a machine-learning algorithm with high expressive ability, thereby resulting in high accuracy. Further, unlike the spectrometer used in this work, we aim to conduct experiments using new measurement systems with three QCLs to improve the signal-to-noise ratio. These results will be reported in the near feature.
5. Conclusion
We developed a method for noninvasive blood glucose level measurements using mid-infrared radiation. The method is based on only a few wavenumbers that enabled unconditional measurements of blood glucose levels to be conducted in vivo. The appropriate wavenumbers selected for the measurements were 1050 cm−1, 1070 cm−1, and 1100 cm−1. Using the prediction model generated from one individual’s data and by utilizing these three wavenumbers, correlations were obtained between data from different seasons, different individuals, different meals, and different acquiring devices, without any calibration. In addition, by using data acquired in various situations, it was shown that the correlation coefficient could improve when only three wavenumbers were used compared to when using more than three wavenumbers. This result indicated that an appropriate combination of wavenumbers for blood glucose measurement was selected, and that the performance of the prediction model at the obtained selected wavenumbers was unconditional for blood sugar level measurements. In the future, we aim to verify the accuracy with which blood glucose levels can be estimated by using lasers at the selected wavenumbers as light sources.
Disclosures
The authors declare that there are no conflicts of interest related to this article.
References and links
- 1.Oliver N. S., Toumazou C., Cass A. E. G., Johnston D. G., “Glucose sensors: a review of current and emerging technology,” Diabet. Med. 26(3), 197–210 (2009). 10.1111/j.1464-5491.2008.02642.x [DOI] [PubMed] [Google Scholar]
- 2.Yadav J., Rani A., Singh V., Murari B. M., “Prospects and limitations of non-invasive blood glucose monitoring using near-infrared spectroscopy,” Biomed. Signal Process. Control 18, 214–227 (2015). 10.1016/j.bspc.2015.01.005 [DOI] [Google Scholar]
- 3.Liakat S., Bors K. A., Xu L., Woods C. M., Doyle J., Gmachl C. F., “Noninvasive in vivo glucose sensing on human subjects using mid-infrared light,” Biomed. Opt. Express 5(7), 2397–2404 (2014). 10.1364/BOE.5.002397 [DOI] [PMC free article] [PubMed] [Google Scholar]
- 4.Enejder A. M. K., Scecina T. G., Oh J., Hunter M., Shih W. C., Sasic S., Horowitz G. L., Feld M. S., “Raman spectroscopy for noninvasive glucose measurements,” J. Biomed. Opt. 10(3), 031114 (2005). 10.1117/1.1920212 [DOI] [PubMed] [Google Scholar]
- 5.von Lilienfeld-Toal H., Weidenmüller M., Xhelaj A., Mäntele W., “A novel approach to non-invasive glucose measurement by mid-infrared spectroscopy: the combination of quantum cascade lasers (QCL) and photoacoustic detection,” Vib. Spectrosc. 38(1–2), 209–215 (2005). 10.1016/j.vibspec.2005.02.025 [DOI] [Google Scholar]
- 6.Pleitez M. A., Lieblein T., Bauer A., Hertzberg O., von Lilienfeld-Toal H., Mäntele W., “In vivo noninvasive monitoring of glucose concentration in human epidermis by mid-infrared pulsed photoacoustic spectroscopy,” Anal. Chem. 85(2), 1013–1020 (2013). 10.1021/ac302841f [DOI] [PubMed] [Google Scholar]
- 7.Vashist S. K., “Non-invasive glucose monitoring technology in diabetes management: a review,” Anal. Chim. Acta 750, 16–27 (2012). 10.1016/j.aca.2012.03.043 [DOI] [PubMed] [Google Scholar]
- 8.McShane M. J., Cameron B. D., Coté G. L., Spiegelman C. H., “Improving complex near-IR calibrations using a new wavelength selection algorithm,” Appl. Spectrosc. 53(12), 1575–1581 (1999). 10.1366/0003702991946037 [DOI] [Google Scholar]
- 9.Goodarzi M., Saeys W., “Selection of the most informative near infrared spectroscopy wavebands for continuous glucose monitoring in human serum,” Talanta 146, 155–165 (2016). 10.1016/j.talanta.2015.08.033 [DOI] [PubMed] [Google Scholar]
- 10.Heise H. M., Marbach R., “Human oral mucosa studies with varying blood glucose concentration by non-invasive ATR-FT-IR-spectroscopy,” Cell. Mol. Biol. 44(6), 899–912 (1998). [PubMed] [Google Scholar]
- 11.Abe Y., Matsuura Y., Shi Y. W., Wang Y., Uyama H., Miyagi M., “Polymer-coated hollow fiber for CO2 laser delivery,” Opt. Lett. 23(2), 89–90 (1998). 10.1364/OL.23.000089 [DOI] [PubMed] [Google Scholar]
- 12.Matsuura Y., Kino S., Katagiri T., “Hollow-fiber-based flexible probe for remote measurement of infrared attenuated total reflection,” Appl. Opt. 48(28), 5396–5400 (2009). 10.1364/AO.48.005396 [DOI] [PubMed] [Google Scholar]
- 13.Kino S., Tanaka Y., Matsuura Y., “Blood glucose measurement by using hollow optical fiber-based attenuated total reflection probe,” J. Biomed. Opt. 19(5), 057010 (2014). 10.1117/1.JBO.19.5.057010 [DOI] [PubMed] [Google Scholar]
- 14.Kino S., Omori S., Katagiri T., Matsuura Y., “Hollow optical-fiber based infrared spectroscopy for measurement of blood glucose level by using multi-reflection prism,” Biomed. Opt. Express 7(2), 701–708 (2016). 10.1364/BOE.7.000701 [DOI] [PMC free article] [PubMed] [Google Scholar]
- 15.Thennadil S. N., Rennert J. L., Wenzel B. J., Hazen K. H., Ruchti T. L., Block M. B., “Comparison of glucose concentration in interstitial fluid, and capillary and venous blood during rapid changes in blood glucose levels,” Diabetes Technol. Ther. 3(3), 357–365 (2001). 10.1089/15209150152607132 [DOI] [PubMed] [Google Scholar]
- 16.Boyne M. S., Silver D. M., Kaplan J., Saudek C. D., “Timing of changes in interstitial and venous blood glucose measured with a continuous subcutaneous glucose sensor,” Diabetes 52(11), 2790–2794 (2003). 10.2337/diabetes.52.11.2790 [DOI] [PubMed] [Google Scholar]
- 17.Robinson M. R., Eaton R. P., Haaland D. M., Koepp G. W., Thomas E. V., Stallard B. R., Robinson P. L., “Noninvasive glucose monitoring in diabetic patients: a preliminary evaluation,” Clin. Chem. 38(9), 1618–1622 (1992). [PubMed] [Google Scholar]
- 18.Barman I., Kong C. R., Dingari N. C., Dasari R. R., Feld M. S., “Development of robust calibration models using support vector machines for spectroscopic monitoring of blood glucose,” Anal. Chem. 82(23), 9719–9726 (2010). 10.1021/ac101754n [DOI] [PMC free article] [PubMed] [Google Scholar]
- 19.Fischbacher C., Jagemann K.-U., Danzer K., Müller U. A., Papenkordt L., Schüler J., “Enhancing calibration models for non-invasive near-infrared spectroscopical blood glucose determination,” Fresenius J. Anal. Chem. 359(1), 78–82 (1997). 10.1007/s002160050539 [DOI] [Google Scholar]
- 20.Hackett M. J., Sylvain N. J., Hou H., Caine S., Alaverdashvili M., Pushie M. J., Kelly M. E., “Concurrent glycogen and lactate imaging with FTIR spectroscopy to spatially localize metabolic parameters of the glial response following brain ischemia,” Anal. Chem. 88(22), 10949–10956 (2016). 10.1021/acs.analchem.6b02588 [DOI] [PubMed] [Google Scholar]
- 21.Wood B. R., “The importance of hydration and DNA conformation in interpreting infrared spectra of cells and tissues,” Chem. Soc. Rev. 45(7), 1980–1998 (2016). 10.1039/C5CS00511F [DOI] [PubMed] [Google Scholar]
- 22.Nakanishi K., Hashimoto A., Pan T., Kanou M., Kameoka T., “Mid-infrared spectroscopic measurement of ionic dissociative materials in the metabolic pathway,” Appl. Spectrosc. 57(12), 1510–1516 (2003). 10.1366/000370203322640152 [DOI] [PubMed] [Google Scholar]
- 23.Hashimoto A., Nakanishi K., Motonaga Y., Kameoka T., “Sugar metabolic analysis of suspensions of plant cells using an FT-IR/ATR method,” Biotechnol. Prog. 17(3), 560–564 (2001). 10.1021/bp010013w [DOI] [PubMed] [Google Scholar]
- 24.Basu A., Dube S., Slama M., Errazuriz I., Amezcua J. C., Kudva Y. C., Peyser T., Carter R. E., Cobelli C., Basu R., “Time lag of glucose from intravascular to interstitial compartment in humans,” Diabetes 62(12), 4083–4087 (2013). 10.2337/db13-1132 [DOI] [PMC free article] [PubMed] [Google Scholar]
- 25.Basu A., Dube S., Veettil S., Slama M., Kudva Y. C., Peyser T., Carter R. E., Cobelli C., Basu R., “Time lag of glucose from intravascular to interstitial compartment in type 1 diabetes,” J. Diabetes Sci. Technol. 9(1), 63–68 (2015). 10.1177/1932296814554797 [DOI] [PMC free article] [PubMed] [Google Scholar]
- 26.Romo-Cárdenas G., Sánchez-López J. D., Luque P. A., Cosío-León M., Nieto-Hipólito J. I., Vázquez-Briseño M., “Insulin overlapping in whole blood FTIR spectroscopy in blood glucose measurements,” Results Phys. 7, 1221–1222 (2017). 10.1016/j.rinp.2017.03.017 [DOI] [Google Scholar]
- 27.Clarke W. L., Cox D., Gonder-Frederick L. A., Carter W., Pohl S. L., “Evaluating clinical accuracy of systems for self-monitoring of blood glucose,” Diabetes Care 10(5), 622–628 (1987). 10.2337/diacare.10.5.622 [DOI] [PubMed] [Google Scholar]


