Abstract
This paper describes a new image reconstruction method for digital breast tomosynthesis (DBT). The new method incorporates detector blur into the forward model. The detector blur in DBT causes correlation in the measurement noise. By making a few approximations that are reasonable for breast imaging, we formulated a regularized quadratic optimization problem with a data-fit term that incorporates models for detector blur and correlated noise (DBCN). We derived a computationally efficient separable quadratic surrogate (SQS) algorithm to solve the optimization problem that has a non-diagonal noise covariance matrix. We evaluated the SQS-DBCN method by reconstructing DBT scans of breast phantoms and human subjects. The contrast-to-noise ratio and sharpness of microcalcifications were analyzed and compared to those by the simultaneous algebraic reconstruction technique (SART). The quality of soft tissue lesions and parenchymal patterns was examined. The results demonstrate the potential to improve the image quality of reconstructed DBT images by incorporating the system physics model. This work is a first step towards model-based iterative reconstruction for DBT.
Index Terms: Digital breast tomosynthesis, detector blur, correlated noise, model-based iterative reconstruction
I. Introduction
Digital breast tomosynthesis (DBT) has been developed to reduce the problem of overlapping tissue in conventional two-dimensional mammography [1]–[3]. In DBT, the commonly used reconstruction method is filtered back projection (FBP) [4]–[9]. Studies have demonstrated the promise of iterative reconstruction (IR) methods in DBT [2], [10]–[15]. Among commercial DBT systems, Hologic and Siemens use FBP and General Electric (GE) uses an adaptive statistical iterative reconstruction (ASIR). Among the IR methods, model-based iterative reconstruction (MBIR) methods incorporate the physics model of the system and the statistical model of signal detection. MBIR methods have been investigated extensively in CT and superior image quality has been observed [16]–[20]. However, existing MBIR methods for CT do not consider noise correlation/aliasing and detector blur because clinical CT systems use individual detector elements. Modeling detector blur and correlated noise was attempted only recently in cone-beam CT (CBCT) using flat-panel detectors [21]–[23]. For DBT, although some studies on MBIR methods have been conducted [24], [25], they considered only limited aspects of the system model, such as modeling the scattered radiation or the statistical model of the measurement noise. To our knowledge, no studies have incorporated the models of image degradation factors of the DBT imaging system, including the crosstalk of the flat-panel detector and the resulting noise correlation. Our goal is to develop MBIR methods with more comprehensive modeling of the system physics and computationally efficient algorithms for DBT reconstruction.
In a DBT system using an indirect detector, light diffusion in the phosphor or the scintillator introduces crosstalk between neighboring pixels. The finite pixel size and light diffusion contribute to blurring of the measured image and correlation in noise. Neglecting detector blur leads to blurring of the reconstructed objects, strongly affecting small features such as microcalcifications (MC). In CT applications, several projectors have been proposed that account for the finite pixel size, such as the distance-driven projector [26] and the separable footprint projector [27]. We have proposed a segmented separable projector (SG projector) for DBT geometries [28]. Current DBT reconstruction algorithms generally treat the measurement at each detector element to be independent random variables, which differs from the physical process in the DBT detector. Tilley et al. and Stayman et al. studied the effect of modeling the detector blur and correlated noise in least-squares reconstruction for CBCT with simulated phantoms and found superior noise-resolution trade-offs with their proposed approach [21]–[23]. Our feasibility study [29] showed similar promise for DBT scans. In this paper, we further refine our implementation of DBT reconstruction accounting for detector blur and the resulting noise correlation, incorporate adaptive regularization strength, analyze the image quality by the contrast and sharpness of the signals and the tissue texture using phantom and human subject DBT scans, and compare the reconstructed image quality with and without modeling detector blur and noise correlation.
DBT is a limited-angle x-ray tomography technique using low-dose high-resolution projections. It is an ill-posed problem with sparse projection view (PV) sampling. As a result, small measurement fluctuation such as noise could cause large perturbations of the reconstructed images in the absence of suitable regularization. On the other hand, the PVs of DBT are noisy by nature since the total x-ray dose of all PVs is kept to be about the same as that of a mammogram. Regularization is therefore crucial for iterative reconstruction algorithms to prevent noise amplification and maintain consistency. Several studies have been conducted on regularization of limited-angle reconstruction. For example, the total variation (TV) method was applied to tomographic reconstruction [11], [30]. Selective diffusion regularization was proposed to enhance MCs while reducing noise [31]. Other regularization methods used the bilateral filter [32], [33]. In this paper, we use a regularization strategy based on a hyperbola potential function, which is convex and edge-preserving. We model detector blur and noise correlation and formulate the reconstruction as a regularized quadratic optimization problem. The problem needs to be solved with an iterative algorithm. Based on the form of the data-fit term and the regularization, we chose to apply a slightly modified separable quadratic surrogate (SQS) [34] method. Although the SQS method requires more iterations to converge than coordinate descent methods, it enforces nonnegativity constraints on the reconstructed image [35], [36].
Section II introduces our detector blur model and the assumptions used for its simplification. We describe the optimization problem and the cost function for regularized reconstruction. Section III introduces the geometry of our DBT system and the figures of merit used for quantitative comparisons of image quality. Results in Section IV demonstrate the usefulness of the method by comparing its reconstructed image quality with that by SART using DBT of both breast phantom and human subjects. We also compare the images reconstructed by modeling both detector blur and noise correlation to those without modeling either component to study their impact on the image quality. Section V discusses the potential of MBIR for improving DBT image quality and future work.
II. Methods
A. Formulation of the Reconstruction Problem
We first mathematically formulate the reconstruction problem using a few assumptions based on the imaging characteristics of DBT. Let Ai denote the N × M projector matrix for the i th projection angle, for i = 1, …, Np, where Np denotes the number of PV angles. Let N denote the number of pixels in a DBT projection image and M the number of object voxels to be reconstructed. Let f denote the length-M vector corresponding to the unknown array of attenuation coefficients in the imaged volume and Yi the length-N vector corresponding to the measured PV image at the i th projection angle. Considering the detector blur and the Lambert-Beer law for attenuation, a reasonable model for the expectation Ȳi is [22]:
| (1) |
where Bi denotes the blurring operation in N × N matrix form and I0 is the constant expected projection value if there is no object present in the imaged volume, assuming there is no non-uniformity due to Heel effect or cone-beam geometry. In this work, we assume that Bi is projection-angle-dependent but linear shift-invariant within a given projection. Focal spot blur is ignored in the current study. If the incident intensity I0 is nonuniform over the PV then one could replace the scale I0 with a diagonal matrix.
One challenge in performing image reconstruction with the model in (1) is that the matrix Bi before the exponential is not diagonal [21]–[23]. To address this challenge for DBT, we assume that the image f consists of two parts (f = fb + fs ), where fb is a low-frequency background whose projections are approximately uniform within the support of the blurring kernel (Bi Ai fb ≈ Ai fb), and fs is a small structure such as MC in DBT whose attenuation contributes only a small amount to the projection values (Ai fs ≪ 1). These assumptions are more reasonable in breast imaging than in CT of body parts that include bone or other high-attenuation objects. Under these assumptions, we use the following approximation:
| (2) |
Then we have the following simplification of (1) for DBT:
| (3) |
The expectation ȳi of the log-transformed projection yi is approximately:
| (4) |
Compared with the reconstruction problem without detector blur, we simply need to include a blurring operation in the forward projection step. The transpose of Bi is also relatively easy to implement in the back-projection step needed for iterative image reconstruction.
The cost function of the reconstruction problem should also account for the covariance matrix of the noise in the measurements yi. DBT systems usually use a flat-panel direct or indirect detector. In our model, we assume an indirect CsI phosphor/a:Si active matrix flat panel detector. The image noise contains two major components: quantum noise from the x-ray photons and electronic noise of the detector. The quantum noise in the imaging process is affected by the detector blur but the detector electronic noise is not.
Accounting for both quantum and electronic noise, we follow [22] and use the following model for the noise covariance Ki of the ith projection view:
| (5) |
where ′ denotes the transpose of a matrix. and denote diagonal matrices with elements corresponding to the variances of quantum noise and readout noise at each detector element, respectively. Section VII of the Supplementary Material shows the detailed derivation of (5).
Assuming yi follows approximately a Gaussian distribution, yi ~ N (ȳi, Ki), we formulate for DBT the following regularized image reconstruction problem with non-diagonal weighting:
| (6) |
where R(f) denotes the regularization term and the inverse matrix square root of the noise covariance is
| (7) |
B. Implementing Si
Since ( ) is non-diagonal, implementing multiplication by Si is usually very challenging, and this is the key difficulty in using the optimization formulation (6). In CT applications, one possible method is to solve another inner optimization problem with a set of conjugate gradient iterations [22]. In DBT, we can dramatically simplify the implementation by making some reasonable assumptions. Unlike body CT where there exist large bones and even perhaps metal objects of significant size that are strongly attenuating, the compressed breast has a fairly consistent thickness mainly composed of soft tissue. As a first-order approximation, we treat quantum noise variance as constant across all detector elements in a given projection angle:
| (8) |
where I denotes the N × N identity matrix. Sections VIII and IX of the Supplementary Material describe the justification of this approximation. In addition, we treat all detector elements in a given projection view as having similar readout noise variance:
| (9) |
Let hi denote the point spread function of the detector. We obtained hi by the inverse Fourier transform of the modulation transfer function (MTF) of the detector for a GE Essential mammography system [37], which also agreed with our own measurement on the prototype DBT system using the edge method [38]. We diagonalize the blurring operation by Bi = Q−1HiQ, where Q denotes the discrete Fourier transform (DFT) matrix, and Hi = Diag(DFT{h}i) denotes the corresponding frequency response. We then implement the operation of multiplying Si by a vector using FFT operations without needing any iterative method for matrix inversion:
| (10) |
where and with lower case superscripts q and r denote noise standard deviations for the PVs after log transform, or equivalently the noise level relative to the recorded x-ray intensity. The corresponding noise standard deviations before log transform are denoted by and with upper case superscripts Q and R. We estimate from dark current images without x-ray exposure by subtracting two dark current images to remove possible structured noise from the detector, then calculating a mean standard deviation from noise patches on the subtracted image and dividing it by . The breast boundary is automatically detected on each PV [39]. We then estimate the mean x-ray intensity Ȳi incident on the detector as the mean pixel value within the breast boundary and calculate as the ratio of over Ȳi.
Estimating is more complicated since it is difficult to remove the heterogeneous tissue background from the projection images. Therefore, we use a DBT scan of a uniform Lucite slab of approximately the thickness of the phantom or a breast to estimate . For each PV of the Lucite slab, we select an array of noise patches and remove the background trend with a 2-D second order polynomial fitting. Then we calculate the standard deviation σi as the mean of the standard deviations estimated from each noise patch. This calculated σi contains the contribution of both and as given by:
| (11) |
We then derive of the Lucite slab from the above relationship using the estimated σi and :
| (12) |
Treating as approximately Poisson noise, is proportional to Ȳi and therefore is inversely proportional to Ȳi. Using the ratio of Ȳi between a DBT scan and the Lucite slab, we estimate for the DBT scan to be reconstructed. In practical implementation, this may be accomplished by predetermining sets of (i = 1, …, Np) for all Np projections from Lucite slabs over a range of thicknesses and x-ray spectra (anode, filter, kilovoltage) combinations and storing them as a library of look up values. For a given DBT scan acquired with a certain exposure technique, one can select an appropriate set that approximates the breast thickness and exposure technique for reconstruction.
C. Regularization
In the implementation of (7), Si acts as a filter that boosts high spatial frequencies. The typical frequency response of Si is shown in Section X of the Supplementary Material. Si would amplify noise in reconstruction if used without regularization. Regularization is important for stable reconstruction. We use a regularization term of the following form:
| (13) |
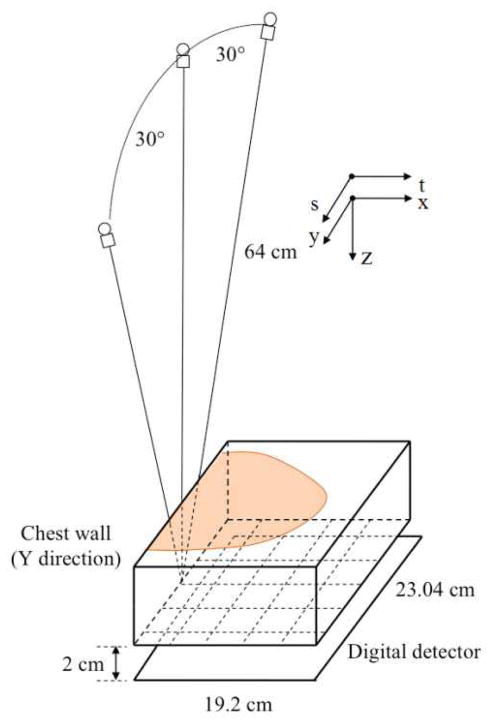
where Cx and Cy denote matrices that calculate differences between neighboring pixels along the x and y-direction, respectively, as defined in Fig. 1. Cx−y and Cx+y compute finite differences along the two diagonal directions. j is the index for all neighboring pixel pairs along one direction. The distance between two neighboring pixels along the diagonal direction is larger, resulting in relatively weaker correlation between their pixel values. We therefore use the parameter γ (γ ≤ 1) to control the weight of regularization in the diagonal directions. We chose γ to be 0.5 for this study following [40]. The parameter β controls the strength of the regularization term. From reconstructing DBT at different noise levels, we observed that the regularization parameter needs to be adapted to keep an appropriate balance between the data-fit term and the regularizer, because the covariance-based weighting of the data-fit term in (6) depends on the noise level. Therefore we include a scaling factor α to adaptively adjust the regularization strength based on the noise level of the projections. We define α as:
| (14) |
Fig. 1.
Geometry of the DBT system used in this study.
For the regularizer (13), we use a hyperbola potential function η(t):
| (15) |
This form of η (t) is edge-preserving. η (t) is also differentiable, making it easy to implement the optimization algorithm of the cost function. The parameters δ and β need to be chosen properly as discussed in Section IV.A. When δ is large relative to t, (15) is approximately η (t) = t2, which is equivalent to a quadratic regularization.
D. The Reconstruction Algorithm
Both the quadratic function of the data-fit term and η (t) are convex and the second-order derivative of η (t) in (15) is
| (16) |
which is less than or equal to 1, enabling the use of the SQS algorithm to solve the optimization problem [35]. To apply the SQS algorithm, we need to find an upper bound on the Hessian of the cost function
| (17) |
where the whole system matrix and whole (prewhitened) data vector are given by:
| (18) |
| (19) |
We first find an upper bound on the Hessian of the regularization term R (f). Since the second-order derivative of the potential function η (t) is less than or equal to 1, we have
| (20) |
where 1 denotes a length-M all-one vector, | · | denotes element-wise absolute value, I denotes the identity matrix and C denotes any one of Cx, Cy, Cx+y and Cx−y. As a result, we have:
| (21) |
By finding (below) a diagonal majorizing matrix D such that D ≥ |Ã′||Ã|, the modified SQS algorithm for minimizing the DBT cost function is (with nonnegativity constraint):
| (22) |
The usual choice of D would be D = {diag |Ã′||Ã|1}. However, implementing |Ã′||Ã|1 is difficult since à has negative values because of the high-frequency boosting feature of Si. Instead, note that the blur frequency response matrix Hi satisfies , then we have from (10):
| (23) |
This inequality leads to the following diagonal majorizer:
| (24) |
where
| (25) |
This diagonal majorizer is as easy to implement as the usual SQS majorizer [34].
In iterative DBT reconstruction, usually only one projection view is used at a time to update the image. We use the ordered subset (OS) approximation [34] to further accelerate the SQS reconstruction:
| (26) |
The OS reconstruction update is given by:
| (27) |
| (28) |
| (29) |
The iteration counter n is incremented by 1 after all measured projections have been used once.
The OS approximation used in the reconstruction makes the method somewhat similar to SART, where also one projection is used in each update, and facilitates their comparison. The OS algorithm was proposed for PET and CT reconstruction [41] where the subsets are better “balanced” than in DBT. For both CT and DBT, the standard OS–SQS algorithm is not guaranteed to converge. The OS algorithm could be made convergent by some relaxation [42], which has not been implemented in this study.
We use SART as a reference algorithm in this paper; although not state-of-the-art, SART has been shown to provide good image quality for reconstructing DBT acquired with our prototype DBT system [10] and has been evaluated by other investigators [9], [43]. We implemented the SQS-DBCN reconstruction with the SG projector [28] and implemented SART with the ray-tracing projector [10], [44]. We previously compared the effects of ray-tracing and SF projectors to SG using SART in a phantom study [28], so here we focus on examining the new DBCN effects. Artifact reduction methods [45], [46] were implemented for all reconstruction methods in this study.
E. Reconstruction Without Detector Blur or Correlated Noise
We investigated the role of each model component in the SQS-DBCN method. The SQS-DBCN method includes the detector blur, the corresponding noise correlation and the regularization. To examine the effects of the detector blur and the noise correlation, we studied the following two reconstruction algorithms:
| (30) |
| (31) |
The no-detector-blur (noDB) reconstruction method neglects the detector blur by setting the point spread function to a Kronecker impulse such that Bi becomes an identity matrix. This is equivalent to a common approach to SQS regularized reconstruction that ignores detector blur and noise correlation. For the no-noise-correlation (noNC) reconstruction, we kept the detector blur in the system model while neglecting the noise correlation caused by the detector blur to evaluate the effect of the correlated noise model in SQS-DBCN. We also studied the reconstruction with penalized weighted least-squares (PWLS) cost function [18], [36], which is equivalent to the SQS-noDB method with location-dependent noise variance. The results are very similar to those obtained with the SQS-noDB method as shown in Section IX of the Supplementary Material. Another case we investigated was keeping both the detector blur and noise correlation while neglecting the regularization. In this case, however, the reconstructed image became extremely noisy after only 2 or 3 SQS iterations, making it difficult even to recognize the reconstructed MCs. As a result, we omit the no-regularization results.
III. Materials
A. DBT System
We used a GE GEN2 prototype DBT system for image acquisition in this study but the proposed method should be applicable to other DBT systems. Fig. 1 shows the imaging geometry. The system uses a CsI phosphor/a:Si active matrix flat panel detector with a pixel size of 0.1mm × 0.1mm and an area of 1920 × 2304 pixels. The detector is stationary during image acquisition. The distance from the x-ray source to the fulcrum at the breast support plate (bottom of the imaged volume) is 64 cm. There is a 2 cm gap between the fulcrum and the image plane of the detector. The reconstructed imaged volumes in this study had a rectangular voxel grid at a voxel size of 0.1mm × 0.1mm × 1 mm.
B. Breast Phantom and Human Subject DBT
MCs are small calcium deposits in the breast of sizes from about 0.1 mm to 0.5 mm. Clustered MCs and subtle masses are important signs of early breast cancer [47]. One of the main challenges in DBT reconstruction is to reduce noise while enhancing MCs and preserving the features of mass margins and the texture of the parenchyma. In this study, we used a breast phantom with embedded simulated MCs for evaluating reconstruction methods and parameter selection on the image quality of MCs. It is difficult to build mass phantoms with realistic spiculated or ill-defined margins that are strong indicators of breast cancer; we therefore used real breast DBT for visual evaluation of the image quality of masses. The human subject DBTs were previously acquired with approval of our Institutional Review Board and informed consent for a lesion detection project.
The breast phantom consists of a stack of five 1-cm-thick slabs of breast tissue mimicking material [48]. Eight clusters of calcium carbonate specks of nominal size range of 0.15–0.18 mm, eight clusters of 0.18–0.25 mm, and five clusters of 0.25–0.30 mm were sandwiched at random locations and depths between the slabs to simulate MCs of different conspicuity levels. For the human subject DBT, we selected cases with spiculated masses that were biopsy-proven to be invasive ductal carcinomas. Both the phantom and human subject DBT were acquired with 60° scan angle, 3° increments and 21 projections. To simulate the DBT acquired with narrow-angle DBT system, we used the 9 central projections for reconstruction, corresponding 24° scan angle with 3° increments, which was close to the 25° scan angle and 3° increments for a GE commercial system. The x-ray exposure for each DBT was therefore reduced to less than half of the original values.
C. Figures of Merit (FOMs)
We use two FOMs for quantitative comparisons of reconstruction quality of MCs: contrast-to-noise ratio (CNR) and full-width at half maximum (FWHM). To calculate the FWHM of an MC on a reconstructed image, we apply a 2-D least-squares Gaussian fitting including a first-order background plane to a 13 × 13-pixel patch centered at the MC. With the fitted standard deviation σMC, the FWHM is given by 2.355σMC. To calculate the CNR, we estimate the local noise level σNP as the root-mean-square noise in a 40 × 40-pixel noise patch near each cluster after subtracting a low-frequency background level estimated by a 2-D fitting with a second order polynomial to the patch. The CNR for an MC is calculated as CNR = AMC/σNP, where AMC is the maximum value around the center of the fitted MC patch.
For MCs of a given nominal size range, a set of individual MCs were manually marked from the clusters at different locations and depths of the phantom, and the mean CNR and mean FWHM were calculated from the set to represent the CNR and FWHM of that MC size range. In total, we marked 30 MCs of 0.15–0.18 mm size, 48 MCs of 0.18–0.25 mm size and 44 MCs of 0.25–0.30 mm size for the analysis. The same set of MCs for each size range was used for the FOM calculation for all reconstruction techniques and parameters.
Although the SQS-DBCN reconstructed DBT is not a linear, shift-invariant system, we calculate an average noise power spectrum (NPS) of the heterogeneous phantom background to provide a comparison of the relative change in the global texture for the various reconstruction techniques and parameters. For each different reconstruction, we calculated the average NPS using sixty 200 × 200-pixel noise patches from 4 reconstructed slices at 4 different depths. We then took the radial average NPS for each reconstruction condition. The locations of the noise patches were chosen such that they did not contain any MC clusters and the same patch locations were used for all conditions. There is no FOM to reliably evaluate the fine details of the margin or spiculations of a cancerous lesion at present so that these features are compared visually on the reconstructed breast images.
IV. Results
A. Effects of Regularization Parameters
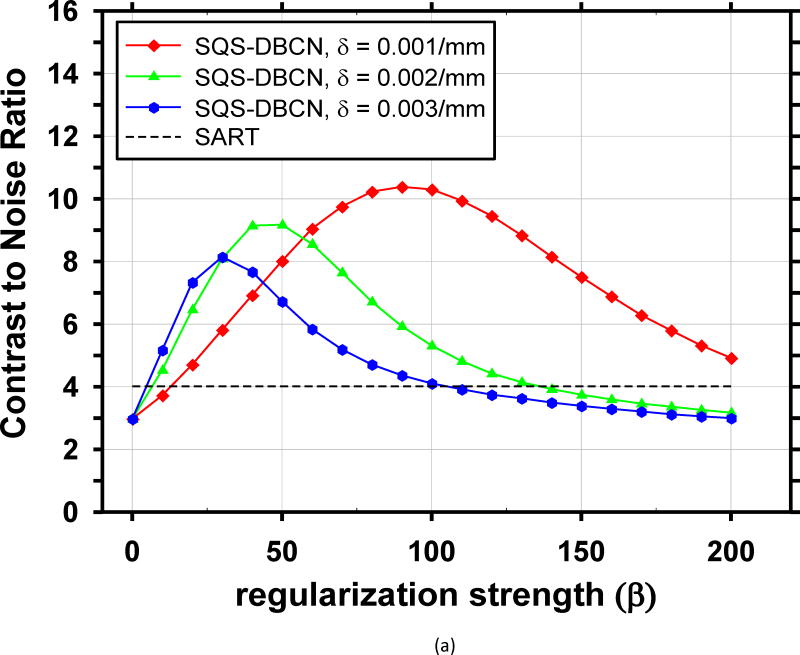
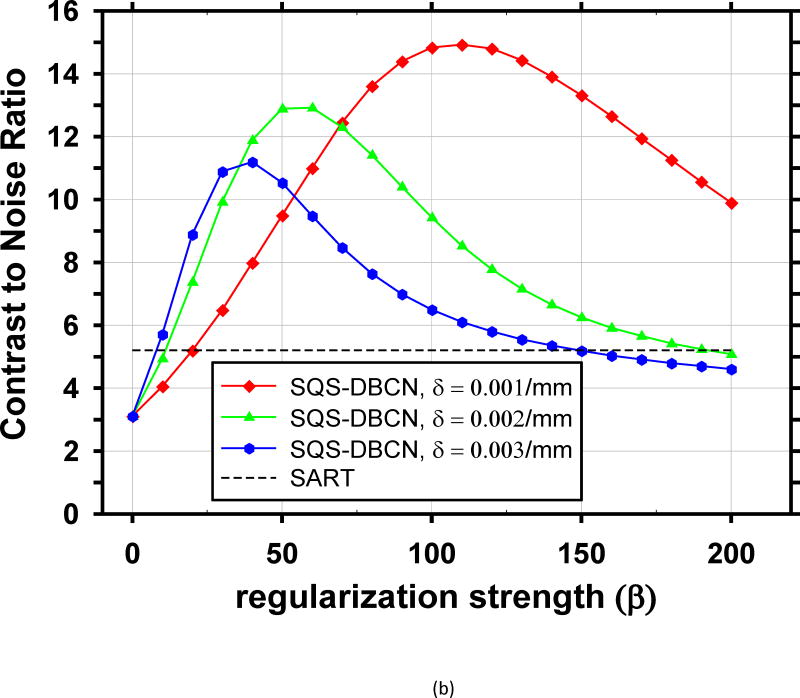
The performance of the SQS-DBCN method depends on the parameters of the regularization term. We reconstructed the phantom DBT with different parameter combinations and plotted the corresponding CNR curves for the small-sized (0.15–0.18mm) and medium-sized (0.18–0.25mm) MCs, as shown in Fig. 2. These CNR curves provide some guidance for parameter selection. The curves for the large-sized (0.25–0.30mm) MCs have similar trends but they are not shown because their CNRs are very high and the parameter settings are not expected to have a strong influence on their visibility. We did not show the FWHM curves either because they monotonically increase as β increases due to the increasing blurring effect of regularization, which is not useful for guiding parameter selection.
Fig. 2.
Dependence of CNR on reconstruction parameters. The CNR is plotted as a function of β for a range of δ. The black dashed lines indicate the CNR level of the SART. (a) MCs of nominal size 0.15–0.18mm, (b) MCs of nominal size 0.18–0.25mm.
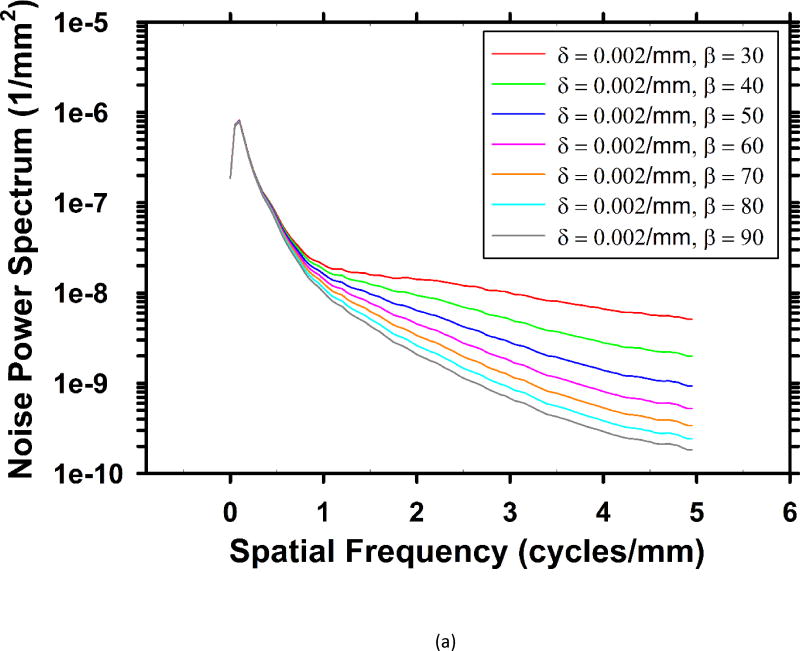
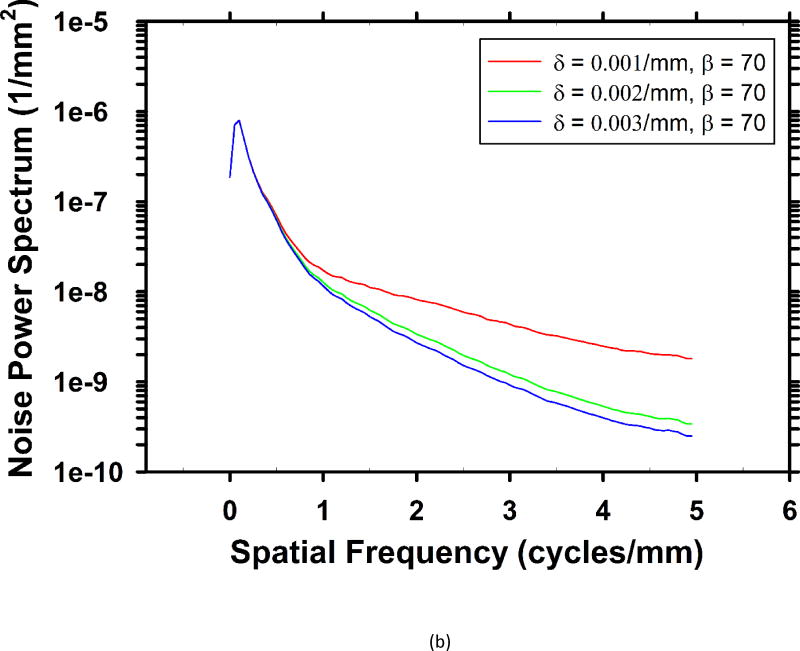
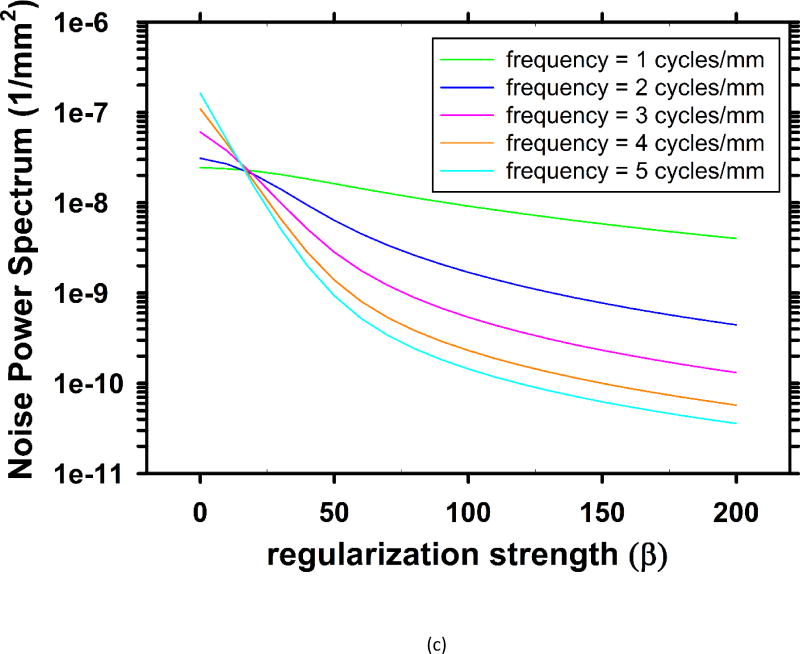
For the breast phantom, Fig. 3 shows the rotational average of the 2-D in-plane NPS for several sets of parameters. The pixel size of the slices is 0.1mm × 0.1mm, yielding a Nyquist frequency of 5 cycles/mm. As the parameters change, the middle and high frequency noise are mainly affected, while the low frequency noise almost stays the same. Fig. 3(c) shows the dependence of the NPS values on β at several frequencies. When weaker regularization is used (β < 18), the high-frequency NPS is higher than low-frequency NPS. On reconstructed images, the high level of high-frequency noise is superimposed with some salt-and-pepper noise, which is a very unfavorable visual feature. As the regularization strength is increased (larger β values), these noisy spikes become less and less noticeable.
Fig. 3.
Dependence of NPS on regularization parameters. (a) NPS with different β values at δ = 0.002/mm. (b) NPS with different δ values at β = 70. (c) Dependence of noise power on β at five different frequencies at δ = 0.002/mm.
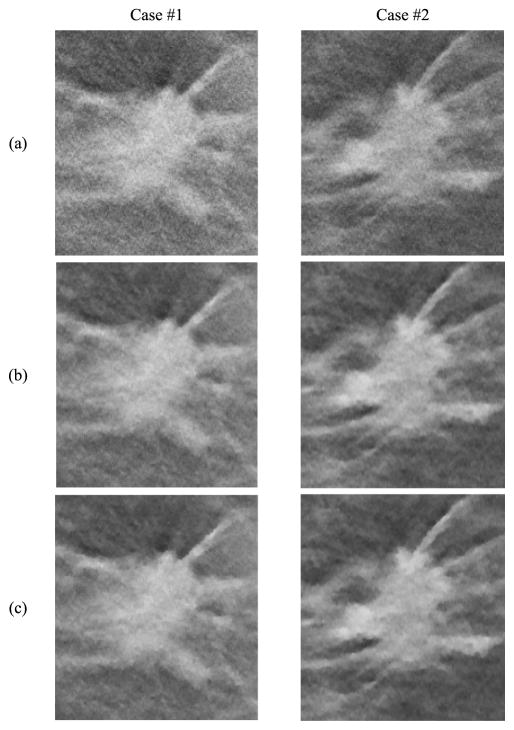
For each MC size, there is a different ‘optimal’ parameter combination that yields maximum CNR. However, the parameter combination that yields the best CNR for MCs may generate artificially appearing texture for soft tissues or spurious noise in the background. Combining curves for both small-sized and medium sized MCs, the optimal parameter selection is about β = 100 and δ = 0.001/mm. Fig. 4 shows image patches from two DBTs containing spiculated invasive ductal carcinoma from a human subject reconstructed using the SART algorithm and SQS-DBCN with two sets of parameters as examples, one of which is β = 100, δ = 0.001/mm. Although this set of parameter provides superior denoising effects compared with SART, it gives the texture a patchy appearance (Fig. 4(c)). After visually comparing the images for a range of δ and β values and considering both the MC enhancement and the appearance of the soft tissue structure, we empirically chose β = 70 and δ = 0.002/mm for the SQS-DBCN algorithm. This parameter pair has a slightly larger β than the “optimal” value for MC enhancement at δ = 0.002/mm, but the soft tissue texture is less patchy as shown in Fig. 4(b). Large β value also reduces spurious salt-and-pepper noise.
Fig. 4.
Comparison of reconstruction methods and parameters using human subject DBTs with invasive ductal carcinomas. Row (a) SART, (b) SQS-DBCN, β = 70, δ = 0.002/mm, (c) SQS-DBCN, β = 100, δ = 0.001/mm. All image patches shown are 180 × 200 pixels in size. The CNR of the MCs increases from (a) to (c). However, the spiculations and the tissue textures become more patchy and artificial in (c). All images are displayed with the same window width setting.
B. Effects of Detector Blur and Correlation Modeling
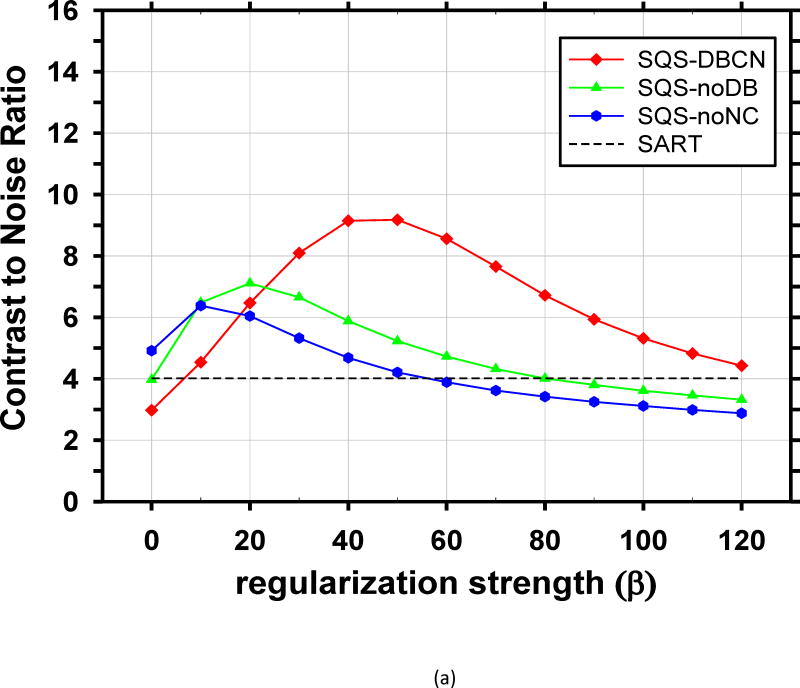
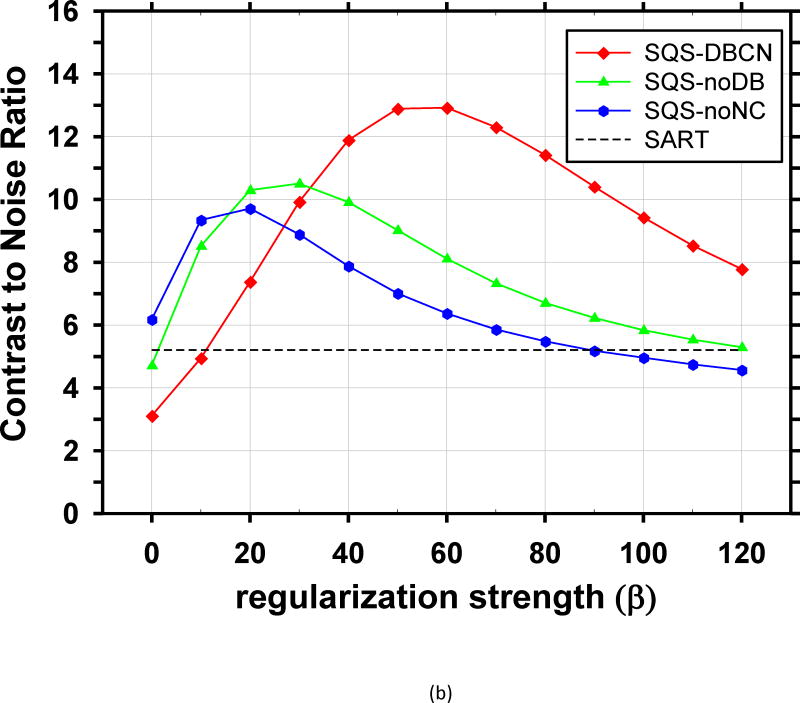
We compared the performance of SQS-DBCN with SQS-noDB and SQS-noNC for MC enhancement. Fig. 5 shows the dependence of CNR on β values at δ = 0.002/mm for these three different methods, together with the CNR level of SART as a reference. When δ is fixed at other values, δ = 0.001/mm or 0.003/mm, the CNR-vs-β curves of the three methods (not shown) have a similar trend as Fig. 5. Fig. 5 indicates that, compared with SQS-noDB and SQS-noNC, SQS-DBCN can achieve a much higher CNR over a wide range of β, providing more flexible choice of β to preserve the texture quality while enhancing the MCs. Compared with SART, the SQS-noDB and SQS-noNC can still provide enhancement for MCs within a small range of β values. Similar to the SQS-DBCN method, by visual evaluation of soft tissue texture we observed that using a slightly larger β than the optimal value yielded better texture quality with a tradeoff in MC enhancement. Therefore we chose to use β = 40 for SQS-noDB and β = 30 for SQS-noNC in the following discussions.
Fig. 5.
Comparison of reconstruction with different model components. CNR is plotted as a function of β at δ = 0.002/mm. (a) MCs of nominal size 0.15–0.18mm, (b) MCs of nominal size 0.18–0.25mm. The SQS-DBCN method yields MCs with higher CNR compared with the SQS-noDB or the SQS-noNC reconstruction over a wide range of β values.
To further investigate the importance of the edge-preserving hyperbola regularization and the detector blur modeling for enhancing the MCs and preserving tissue texture in DBT reconstruction, we compared the SQS-DBCN using quadratic regularization with and without detector blur modeling. Details can be found in Section XI of the Supplementary Material. We found that, with quadratic regularization, a single β cannot provide good image quality for both MCs and tissue texture or mass margin, which is crucial for DBT reconstruction. In addition, the proposed detector blur modeling improves both the image sharpness and the CNR of MCs in comparison to without detector blur modeling. The experiments therefore indicate that detector blur modeling is important for DBT reconstruction regardless of whether edge-preserving regularization is used.
C. Reconstructed MC Clusters Breast Phantom
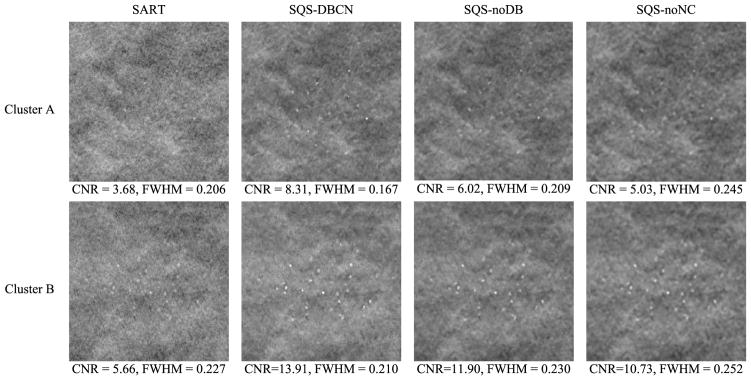
Fig. 6 shows the reconstructed images for two MC clusters with SART, SQS-DBCN, SQS-noDB and SQS-noNC. Because the SART method does not have explicit regularization, we stopped with 3 iterations to avoid noise amplification. The mean FWHMs and the CNRs calculated for these clusters reconstructed with the different methods are also shown. Compared with SART, the MC clusters by the SQS-DBCN method are sharper on a much less noisy background. Benefiting from the denoising effect of the regularization, the SQS-noDB and the SQS-noNC methods are also able to enhance the MCs. All three methods provide higher CNRs than SART. However, the SQS-noDB method generates coarser texture in the background, while the SQS-noNC images are more blurred with “bumpy” background texture. The MCs reconstructed by the SQS-DBCN method have smaller FWHMs than those by the SART method, indicating that the MCs are sharper. On the other hand, the MCs reconstructed by the SQS-noDB and the SQS-noNC methods are more blurred, as indicated by the larger FWHMs. Among the four different methods, the SQS-DBCN method provides the best CNR enhancement and the sharpest MCs along with smoother background texture.
Fig. 6.
Comparison of MC clusters reconstructed by four methods. The size of these image patches is 180 × 180 pixels. Cluster A: nominal size 0.15–0.18 mm, Cluster B: nominal size 0.18–0.25 mm. The SART method used 3 iterations. The CNR and FWHM (mm) are mean values of MCs from the clusters shown here. The parameters used for the SQS-DBCN method were β = 70, δ = 0.002/mm. The last two columns show the reconstructed MC cluster when one of the model components was removed. The parameters used for SQS-noDB were β = 40, δ = 0.002/mm, and for SQS-noNC were β = 30, δ= 0.002/mm. All SQS reconstructions were run for 10 iterations. The images of the same cluster are displayed with the same window width setting.
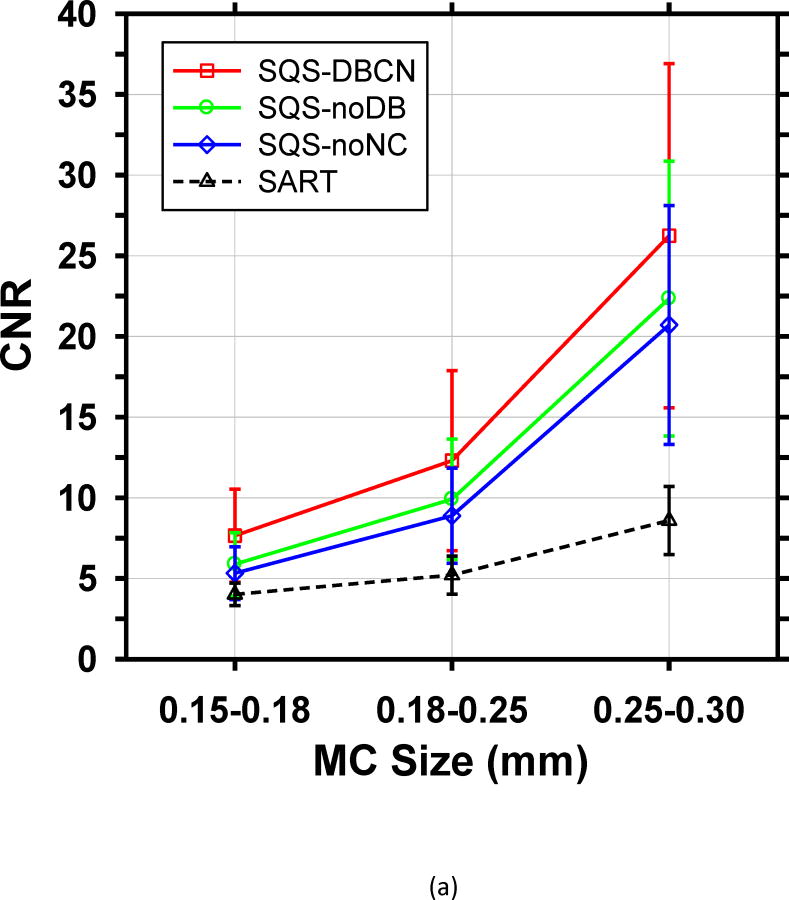
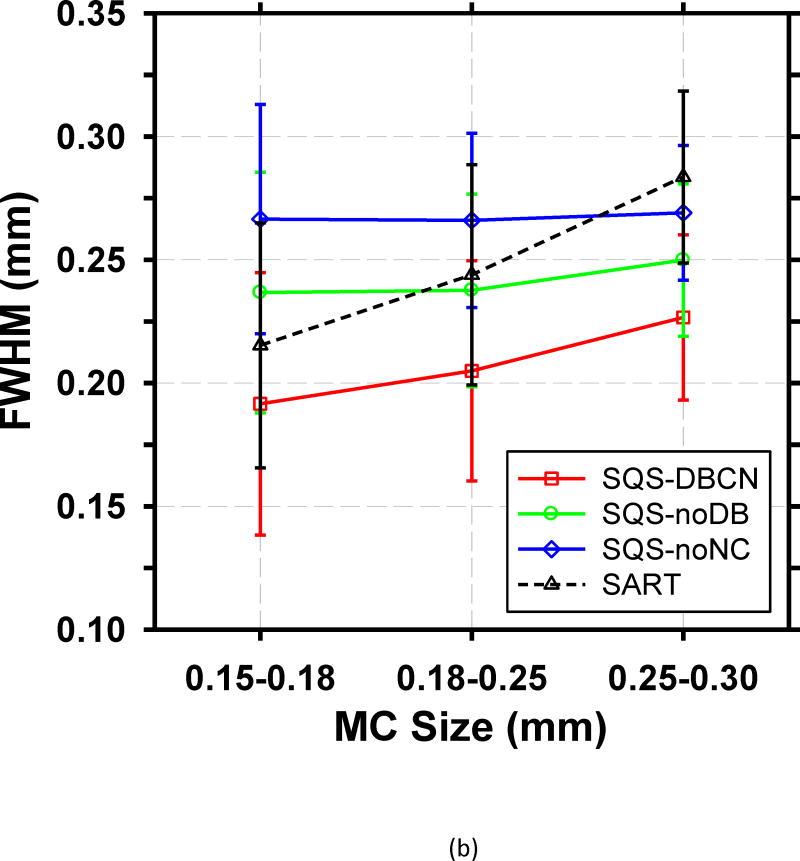
To make a more quantitative comparison, we calculated the mean CNR and mean FWHM of the set of over 30 MCs in each size range. Fig. 7 shows the mean values of both FOMs and their standard deviations for the four reconstructed methods. Compared with SART, SQS-DBCN generates more conspicuous and sharper MCs (see examples in Fig. 6), as indicated by higher CNRs and smaller FWHMs. For the small MCs (0.15–0.18mm), the mean CNR increases by 90.3% from 4.02 to 7.65 when using the SQS-DBCN reconstruction. The mean CNRs increase by 136.0% and 205.5% for the medium and large MCs, respectively. The sharper and more conspicuous MCs in the SQS-DBCN images are expected to be detected more easily by radiologists or by machine vision. The mean CNRs of MCs reconstructed with the SQS-noNC and the SQS-noDB methods are also higher than those with SART, due to the enhancement of the signals with more iterations while the regularization controls the noise in the background. The mean FWHMs of these two methods, on the other hand, become almost homogenized for three different sized MCs, indicating the blurring of the reconstructed images.
Fig. 7.
Comparison of the (a) mean CNR and (b) mean FWHM averaged over MCs sampled from all clusters in the phantom. The error bars represent the standard deviations of CNR or FWHM for all MC samples of a given size.
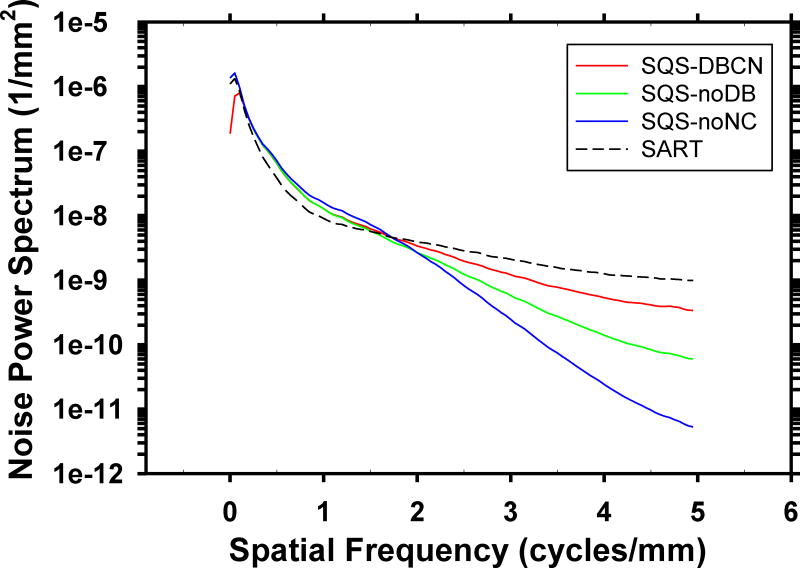
Fig. 8 compares the rotationally averaged NPS of the background of the phantom DBT reconstructed with the four methods. Compared to SART, the SQS-DBCN, SQD-noDB, and SQS-noNC methods reduce the high-frequency noise but increase the lower frequency noise. The SQS-noNC method with β = 30, δ = 0.002/mm causes the largest changes in the NPS, which result in the blurry and bumpy background texture. The SQS-DBCN method with the selected parameters β = 70, δ = 0.002/mm changes the NPS moderately, corresponding to the less patchy texture on the images.
Fig. 8.
Dependence of NPS on reconstruction methods: SQS-DBCN (β = 70, δ = 0.002/mm), SQS-noDB (β = 40, δ = 0.002/mm), SQS-noNC (β = 30, δ = 0.002/mm) and SART. The NPS curves of SQS-DBCN and SQS-noDB overlaps in the low-frequency range.
In addition to the heterogeneous phantom, we also used the ACR phantom and a uniform Lucite phantom to study the difference between SART and SQS-DBCN. The observations for the ACR phantom are similar to that for the heterogeneous phantom, as described in Section XII of the Supplementary Material.
D. Human Subject DBT
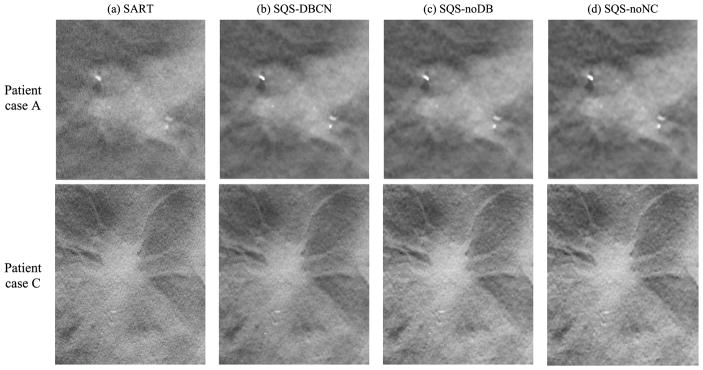
To evaluate the visual quality of the tissue texture, we applied SQS-DBCN to the human subject DBT images. Fig. 9 shows examples of masses reconstructed from the four different methods. The parameters used here are the same as what have been used for the phantom. Similar to the phantom images, the SQS-DBCN method is able to reduce noise compared with SART; the MCs appear to be the sharpest and have the highest contrast among the four methods. When one of the model components is ignored, although the contrasts of the MCs still appear higher than those of the SART, they are more blurry and the tissue texture becomes coarser, affecting the appearance of the mass margin.
Fig. 9.
Comparison of four methods using human subject DBT images with invasive ductal carcinomas. The sizes of the image patches are 150 × 160 pixels (top row) and 300 × 360 pixels (bottom row). The SART method used 3 iterations. The parameters were β = 70, δ = 0.002/mm for the SQS-DBCN method, β = 40, δ = 0.002/mm for the SQS-noDB method, and β = 30, δ = 0.002/mm for the SQS-noNC method. All SQS methods were run for 10 iterations. All images are displayed with the same window width setting.
V. Discussion
In this study, we proposed a new SQS-DBCN reconstruction method for DBT applications. By accounting for the detector blur and the correlated noise model, the SQS-DBCN method is able to improve the reconstruction quality of DBT images both visually and quantitatively.
Parameter selection is a crucial step for achieving good image quality with the SQS-DBCN method. We investigated using the CNR of MCs as an FOM for guiding parameter optimization. We found that this FOM has limitations. First, CNR does not consider the spurious enhancement of noise points that may cause false MCs, which often occurs concurrently with strong enhancement of high frequency signals such as MCs. In this study, the CNR values are measured at known MC locations. If a reconstruction generates false MCs, it will not be penalized by the CNR values. Second, MCs are not the only sign of breast cancer; radiologists also need to recognize important signs such as architectural distortion or subtle spiculations from non-calcified lesions in the breast. Some reconstruction methods or parameter combinations can generate strong artifacts on the tissue texture, as observed in CT [49]. As a result, CNR curves provide only an approximate guide for selecting parameters. As shown in Fig. 2, there is a wide range of β values where the SQS-DBCN method outperforms the SART method for enhancing the CNR of MCs. We used the parameters within this range to reconstruct human subject images and compared the visual quality of the soft tissue texture among these selections. We found that δ = 0.002/mm, β = 70 is a reasonable choice for the SQS-DBCN method that does not cause strong artifacts and only trades off a fraction of the MC enhancement.
One challenge in the parameter selection is that different cases may require different parameter combinations for the best image quality due to the variations in the noise level of images. For the phantom DBT, we can use the CNR of MCs to guide the parameter selection. However, the selected parameters may not work well for some patient cases. It is difficult to define an FOM for a patient case to help parameter selection because the target lesion of a given patient case is usually unknown. For this reason, we implemented the adaptive parameter adjustment as shown in (13) and (14). Only β is adjusted in the procedure while the value of δ is fixed. We will continue to investigate the strategy for adaptively adjusting the parameters to further improve the image quality for patient cases when using the SQS-DBCN method.
One may tend to use quadratic regularization to avoid δ in the potential function and to reduce the number of hyper-parameters by one. However, our experiments (Section XI of the Supplementary Material) indicate that the hyperbola regularization is superior to quadratic regularization for DBT reconstruction because of the dual roles played by the hyper-bola potential function . For reconstructing soft tissue, the difference between neighboring pixels is small such that δ = 0.002/mm is large enough for the potential function to work in the ‘quadratic’ part of the curve. It therefore behaves like quadratic regularization that produces relatively smooth and natural soft tissue texture at large β. For MCs with high gradient between neighboring pixels, the potential function behaves like linear regularization such that MCs are preserved even when relatively strong regularization with large β is used to reduce noise. The property of the hyperbola function thus matches well with the requirements for DBT reconstruction.
The comparison of SQS-DBCN, SQS-noDB and SQS-noNC demonstrates that the effectiveness of the SQS-DBCN method relies on the completeness of all three model components: detector blur, noise correlation and regularization. Although intuitively, the MC enhancement might result from the deblur-ring effect of modeling detector blur, our results with the SQS-noNC method demonstrate that modeling noise correlation is equally important. Our comparison of SQS-DBCN with the PWLS reconstruction algorithm used in CT (see Section IX in Supplementary Material) further indicates that statistical iterative reconstruction methods developed for CT are not sufficient for DBT because they ignore detector blur and noise correlation. Similar to the SQS-DBCN method, parameters of SQS-noDB and SQS-noNC methods were chosen based on both the CNR performance and the soft tissue texture. We found that over the range of β values where the CNR is relatively high (β = 10 to 40 for SQS-noDB and β = 10 to 30 for SQS-noNC), it is more difficult to find a proper β with satisfactory tissue texture. As shown in Fig. 7(a), with the chosen β values for these two methods, the mean CNRs for MCs of all three sizes are lower than those of the SQS-DBCN method. Fig. 7(b) shows that with the SQS-noDB or the SQS-noNC methods, the mean FWHMs become similar for MCs of all three sizes, which is undesirable. The image patches in Fig. 6 also demonstrate that the background texture obtained with the SQS-noDB or the SQS-noNC methods looks blurry and coarse and the MCs are less sharp compared to those with the SQS-DBCN method. The reconstructed images of human subject DBT in Fig. 9 support the same conclusion. Further comparison of SQS-DBCN and SQS-noDB with quadratic regularization also leads to similar observations as discussed in Section XI of the Supplementary Material. These results indicate that both the detector blur and the correlated noise modeling in the SQS-DBCN method are important components in the reconstruction and that its superior CNR performance is not simply a result of the regularization.
Another interesting observation is that the SQS-noDB method generally performs better than the SQS-noNC method. Fig. 6 shows that the SQS-noNC images looks more blurry compared with the SQS-noDB images. Fig. 7 shows that the SQS-noNC method gives lower CNR values and larger FWHM values for all three different-sized MCs. In fact, the SQS-noDB method is equivalent to the SQS-DBCN method if the true point spread function of the detector blur is a Kronecker impulse. For the SQS-noDB method, although the detector blur is ignored, the noise model still matches the forward model in the data-fitting term of (6). On the other hand, the SQS-noNC method incorporates the detector blur in the forward model and ignores the corresponding noise correlation. The results reveal that such a mismatch in the modeling degrades image quality. The comparison between SQS-noDB and SQS-DBCN indicates the importance of the noise correlation model.
There are a number of limitations for this preliminary study of an MBIR method for DBT. The SQS-DBCN method depends on several approximations. We approximate the detector blur as linear shift-invariant for a given projection and as independent of the x-ray incident angle to the detector. The reconstructed object approximately consists of a relatively uniform background, where the fibrous tissue and MCs are treated as high-frequency structures embedded in the background. We also treat the quantum noise to be relatively constant over the field of view for a given projection angle. The model for the SQS-DBCN method only includes the detector blur and the corresponding noise correlation. Other factors such as x-ray focal spot blur, beam hardening and scatter are not considered in our current model. However, even with such a simplified model and approximations, the SQS-DBCN method enhances MCs and suppresses noise compared to SART reconstruction, while preserving tissue texture and mass spiculations for low-dose DBT scans. The SQS-DBCN implementation not only provides a practical DBT reconstruction method, but also indicates the potential value of model-based image reconstruction for DBT. We are currently working on a more detailed model of the system and relaxing the approximations used to simplify the reconstruction algorithm.
VI. Conclusion
We proposed a DBT reconstruction method that incorporates detector blur and a correlated noise model as the first step towards developing an MBIR method for DBT. We have shown quantitatively and qualitatively that the new SQS-DBCN method can better enhance MCs compared with SART while preserving the image quality of mass spiculations and tissue texture. We have also demonstrated the effectiveness of the SQS-DBCN method as a result of incorporating the detector blur, the noise correlation and the regularization at the same time, indicating that a more complete model-based reconstruction may further improve the DBT image quality.
Supplementary Material
Acknowledgments
This work is supported by National Institutes of Health grant number R01 CA151443.
References
- 1.Niklason LT, Christian BT, Niklason LE, Kopans DB, Castleberry DE, Opsahl-Ong BH, Landberg CE, Slanetz PJ, Giardino AA, Moore R, et al. Digital tomosynthesis in breast imaging. Radiology. 1997;205:399–406. doi: 10.1148/radiology.205.2.9356620. [DOI] [PubMed] [Google Scholar]
- 2.Wu T, Stewart A, Stanton M, McCauley T, Phillips W, Kopans DB, Moore RH, Eberhard JW, Opsahl-Ong B, Niklason L, et al. Tomographic mammography using a limited number of low-dose cone-beam projection images. Medical Physics. 2003;30(3):365–380. doi: 10.1118/1.1543934. [DOI] [PubMed] [Google Scholar]
- 3.Kopans DB. Digital tomosynthesis and other applications. Categorical Course in Diagnostic Radiology: Breast Imaging-Digital Mammography RSNA Program Book. 2005;2005:130. [Google Scholar]
- 4.Lauritsch G, Haerer W. A theoretical framework for filtered back-projection in tomosynthesis. Proc SPIE. 1998;3338:1127–1137. [Google Scholar]
- 5.Claus BEH, Eberhard JW, Schmitz A, Carson P, Goodsitt M, Chan HP. Generalized Filtered Back-Projection Reconstruction in Breast Tomosynthesis. Lecture notes in computer science – digital mammography. 2006;4046:167–174. [Google Scholar]
- 6.Mertelmeier T, Orman J, Haerer W, Dudam MK. Optimizing filtered backprojection reconstruction for a breast tomosynthesis prototype device. Proc SPIE. 2006;6142:61420F. [Google Scholar]
- 7.Hu YH, Zhao B, Zhao W. Image artifacts in digital breast tomosynthesis: Investigation of the effects of system geometry and reconstruction parameters using a linear system approach. Medical Physics. 2008;35(12):5242–5252. doi: 10.1118/1.2996110. [DOI] [PMC free article] [PubMed] [Google Scholar]
- 8.Gang GJ, Tward DJ, Lee J, Siewerdsen JH. Anatomical background and generalized detectability in tomosynthesis and cone-beam CT. Medical Physics. 2010;37(5):1948–1965. doi: 10.1118/1.3352586. [DOI] [PMC free article] [PubMed] [Google Scholar]
- 9.Sechopoulos I. A review of breast tomosynthesis. Part II. Image reconstruction, processing and analysis, and advanced applications. Medical Physics. 2013;40(1):014302. doi: 10.1118/1.4770281. [DOI] [PMC free article] [PubMed] [Google Scholar]
- 10.Zhang Y, Chan H-P, Sahiner B, Wei J, Goodsitt MM, Hadjiiski LM, Ge J, Zhou C. A comparative study of limited-angle cone-beam reconstruction methods for breast tomosynthesis. Medical Physics. 2006;33(10):3781–3795. doi: 10.1118/1.223754. [DOI] [PMC free article] [PubMed] [Google Scholar]
- 11.Sidky EY, Pan X, Reiser I, Nishikawa RM, Moore RH, Kopans DB. Enhanced imaging of microcalcifications in digital breast tomosynthesis through improved image-reconstruction algorithms. Medical Physics. 2009;36(11):4920–4932. doi: 10.1118/1.3232211. [DOI] [PMC free article] [PubMed] [Google Scholar]
- 12.Das M, Gifford HC, O’Connor JM, Glick SJ. Penalized maximum likelihood reconstruction for improved microcalcification detection in breast tomosynthesis. IEEE Trans Medical Imaging. 2011;30(4):904–914. doi: 10.1109/TMI.2010.2089694. [DOI] [PMC free article] [PubMed] [Google Scholar]
- 13.Bian JG, Yang K, Boone JM, Han X, Sidky EY, Pan XC. Investigation of iterative image reconstruction in low-dose breast CT. Physics in Medicine and Biology. 2014;59(11):2659–2685. doi: 10.1088/0031-9155/59/11/2659. [DOI] [PMC free article] [PubMed] [Google Scholar]
- 14.Haneda E, Tkaczyk JE, Palma G, Iordache R, Zelakiewicz S, Muller S, De Man B. Toward a dose reduction strategy using model-based reconstruction with limited-angle tomosynthesis. Proc SPIE. 2014;9033:90330V. [Google Scholar]
- 15.Samei E, Thompson J, Richard S, Bowsher J. A Case for Wide-Angle Breast Tomosynthesis. Academic Radiology. 2015;22(7):860–869. doi: 10.1016/j.acra.2015.02.015. [DOI] [PubMed] [Google Scholar]
- 16.Lange K, Fessler JA. Globally convergent algorithms for maximum a posteriori transmission tomography. IEEE Trans Image Processing. 1995;4(10):1430–1438. doi: 10.1109/83.465107. [DOI] [PubMed] [Google Scholar]
- 17.Elbakri IA, Fessler JA. Statistical image reconstruction for poly-eneregetic x-ray computed tomography. IEEE Trans Medical Imaging. 2002;21(2):89–99. doi: 10.1109/42.993128. [DOI] [PubMed] [Google Scholar]
- 18.Thibault JB, Sauer KD, Bouman CA, Hsieh J. A three-dimensional statistical approach to improved image quality for multislice helical CT. Medical Physics. 2007;34(11):4526–4544. doi: 10.1118/1.2789499. [DOI] [PubMed] [Google Scholar]
- 19.De Man B, Fessler JA. Statistical Iterative Reconstruction for X-Ray Computed Tomography. In: Censor Y, Jiang M, Wang G, editors. Biomedical Mathematics: Promising Directions in Imaging, Therapy Planning, and Inverse Problems. WI: Medical Physics Publishing; 2010. pp. 113–140. [Google Scholar]
- 20.Nuyts J, De Man B, Fessler JA, Zbijewski W, Beekman FJ. Modelling the physics in the iterative reconstruction for transmission computed tomography. Physics in Medicine and Biology. 2013;58(12):R63–R96. doi: 10.1088/0031-9155/58/12/R63. [DOI] [PMC free article] [PubMed] [Google Scholar]
- 21.Tilley S, Siewerdsen JH, Stayman JW. Iterative CT Reconstruction using Models of Source and Detector Blur and Correlated Noise. Proc Int Conf Image Form Xray Comput Tomogr. 2014;2014:363–367. [PMC free article] [PubMed] [Google Scholar]
- 22.Tilley S, Siewerdsen JH, Stayman JW. Model-based iterative reconstruction for flat-panel cone-beam CT with focal spot blur, detector blur, and correlated noise. Physics in Medicine and Biology. 2016;61(1):296–319. doi: 10.1088/0031-9155/61/1/296. [DOI] [PMC free article] [PubMed] [Google Scholar]
- 23.Tilley S, Siewerdsen JH, Zbijewski W, Stayman JW. Nonlinear statistical reconstruction for flat-panel cone-beam CT with blur and correlated noise models. Proc SPIE. 2016;9783:97830R. doi: 10.1117/12.2216126. [DOI] [PMC free article] [PubMed] [Google Scholar]
- 24.Kim K, Lee T, Seong Y, Lee J, Jang KE, Choi J, Choi YW, Kim HH, Shin HJ, Cha JH, et al. Fully iterative scatter corrected digital breast tomosynthesis using GPU-based fast Monte Carlo simulation and composition ratio update. Medical Physics. 2015;42(9):5342–5355. doi: 10.1118/1.4928139. [DOI] [PubMed] [Google Scholar]
- 25.Xu S, Lu J, Zhou O, Chen Y. Statistical iterative reconstruction to improve image quality for digital breast tomosynthesis. Medical Physics. 2015;42(9):5377–5390. doi: 10.1118/1.4928603. [DOI] [PMC free article] [PubMed] [Google Scholar]
- 26.De Man B, Basu S. Distance-driven projection and backprojection in three dimensions. Physics in Medicine and Biology. 2004;49(11):2463–2475. doi: 10.1088/0031-9155/49/11/024. [DOI] [PubMed] [Google Scholar]
- 27.Long Y, Fessler JA, Balter JM. 3D Forward and Back-Projection for X-Ray CT Using Separable Footprints. IEEE Trans Medical Imaging. 2010;29(11):1839–1850. doi: 10.1109/TMI.2010.2050898. [DOI] [PMC free article] [PubMed] [Google Scholar]
- 28.Zheng J, Fessler JA, Chan HP. Segmented separable footprint projector for digital breast tomosynthesis and its application for subpixel reconstruction. Medical Physics. 2017;44(3):986–1001. doi: 10.1002/mp.12092. [DOI] [PMC free article] [PubMed] [Google Scholar]
- 29.Zheng J, Fessler JA, Chan H-P. Digital Breast Tomosynthesis Reconstruction with Detector Blur and Correlated Noise. Proc. 4th International Conference on Image Formation in X-Ray Computed Tomography, vol. CT-Meeting; 2016; 2016. pp. 21–24. [Google Scholar]
- 30.Persson M, Bone D, Elmqvist H. Total variation norm for three-dimensional iterative reconstruction in limited view angle tomography. Physics in Medicine and Biology. 2001;46(3):853–866. doi: 10.1088/0031-9155/46/3/318. [DOI] [PubMed] [Google Scholar]
- 31.Lu Y, Chan HP, Wei J, Hadjiiski LM. Selective-diffusion regularization for enhancement of microcalcifications in digital breast tomosynthesis reconstruction. Medical Physics. 2010;37:6003–6014. doi: 10.1118/1.3505851. [DOI] [PMC free article] [PubMed] [Google Scholar]
- 32.Lu Y, Chan H-P, Wei J, Hadjiiski L, Samala R. Multiscale Bilateral Filtering for Improving Image Quality in Digital Breast Tomosynthesis. Medical Physics. 2015;42(1):182–195. doi: 10.1118/1.4903283. [DOI] [PMC free article] [PubMed] [Google Scholar]
- 33.Zheng J, Fessler JA, Chan HP. Digital Breast Tomosynthesis Reconstruction using Spatially Weighted Non-convex Regularization. Proc SPIE. 2016;9783:978369. [Google Scholar]
- 34.Erdogan H, Fessler JA. Ordered subsets algorithms for transmission tomography. Physics in Medicine and Biology. 1999;44:2835–2851. doi: 10.1088/0031-9155/44/11/311. [DOI] [PubMed] [Google Scholar]
- 35.Kim D, Pal D, Thibault JB, Fessler JA. Accelerating Ordered Subsets Image Reconstruction for X-ray CT Using Spatially Nonuniform Optimization Transfer. IEEE Trans Medical Imaging. 2013;32(11):1965–1978. doi: 10.1109/TMI.2013.2266898. [DOI] [PMC free article] [PubMed] [Google Scholar]
- 36.Sauer K, Bouman C. A Local Update Strategy for Iterative Reconstruction from Projections. IEEE Trans Signal Processing. 1993;41(2):534–548. [Google Scholar]
- 37.Garcia-Molla R, Linares R, Ayala R. Study of DQE dependence with beam quality on GE essential mammography flat panel. J Appl Clin Med Phys. 2010;12(1):3176. doi: 10.1120/jacmp.v12i1.3176. [DOI] [PMC free article] [PubMed] [Google Scholar]
- 38.Samei E, Flynn M, Reimann D. A method for measuring the presampled MTF of digital radiographic systems using an edge test device. Medical Physics. 1998;25:102–113. doi: 10.1118/1.598165. [DOI] [PubMed] [Google Scholar]
- 39.Wu YT, Zhou C, Chan H-P, Paramagul C, Hadjiiski LM, Daly CP, Douglas JA, Zhang YH, Sahiner B, Shi JZ, et al. Dynamic multiple thresholding breast boundary detection algorithm for mammograms. Medical Physics. 2010;37(1):391–401. doi: 10.1118/1.3273062. [DOI] [PMC free article] [PubMed] [Google Scholar]
- 40.Shi HR, Fessler JA. Quadratic regularization design for 2D CT. IEEE Trans Medical Imaging. 2009;28(5):645–656. doi: 10.1109/TMI.2008.2007366. [DOI] [PMC free article] [PubMed] [Google Scholar]
- 41.Hudson HM, Larkin RS. Accelerated Image Reconstruction Using Ordered Subsets of Projection Data. IEEE Trans Medical Imaging. 1994;13(4):601–609. doi: 10.1109/42.363108. [DOI] [PubMed] [Google Scholar]
- 42.Andersen MS, Hansen PC. Generalized row-action methods for tomographic imaging. Numerical Algorithms. 2014;67(1):121–144. [Google Scholar]
- 43.Van de Sompel D, Brady SM, Boone J. Task-based performance analysis of FBP, SART and ML for digital breast tomosynthesis using signal CNR and Channelised Hotelling Observers. Medical Image Analysis. 2011;15(1):53–70. doi: 10.1016/j.media.2010.07.004. [DOI] [PubMed] [Google Scholar]
- 44.Siddon RL. Fast calculation of the exact radiological path for a three-dimensional CT array. Medical Physics. 1985;12(2):252–255. doi: 10.1118/1.595715. [DOI] [PubMed] [Google Scholar]
- 45.Zhang Y, Chan H-P, Sahiner B, Wei J, Zhou C, Hadjiiski LM. Artifact reduction methods for truncated projections in iterative breast tomosynthesis reconstruction. Journal of Computer Assisted Tomography. 2009;33:426–435. doi: 10.1097/RCT.0b013e3181838000. [DOI] [PMC free article] [PubMed] [Google Scholar]
- 46.Lu Y, Chan HP, Wei J, Hadjiiski LM. A diffusion-based truncated projection artifact reduction method for iterative digital breast tomosynthesis reconstruction. Physics in Medicine and Biology. 2013;58(3):569–587. doi: 10.1088/0031-9155/58/3/569. [DOI] [PMC free article] [PubMed] [Google Scholar]
- 47.Tabar L, Dean PB. Teaching Atlas of Mammography. New York: Thieme; 1985. [PubMed] [Google Scholar]
- 48.Chan HP, Goodsitt MM, Helvie MA, Zelakiewicz S, Schmitz A, Noroozian M, Paramagul C, Roubidoux MA, Nees AV, Neal CH, et al. Digital Breast Tomosynthesis: Observer Performance of Clustered Microcalcification Detection on Breast Phantom Images Acquired with an Experimental System Using Variable Scan Angles, Angular Increments, and Number of Projection Views. Radiology. 2014;273(3):675–685. doi: 10.1148/radiol.14132722. [DOI] [PMC free article] [PubMed] [Google Scholar]
- 49.Boas FE, Fleischmann D. CT artifacts: causes and reduction techniques. Imaging in Medicine. 2012;4(2):229–240. [Google Scholar]
Associated Data
This section collects any data citations, data availability statements, or supplementary materials included in this article.


