

Abstract
We report on a new approach to the analysis of dynamic NMR lineshapes from polycrystalline (i.e., macroscopically disordered) samples in the presence of Magic Angle Spinning (MAS). This is an application of the Stochastic Liouville Equation developed by Freed and co-workers for treating restricted (i.e., microscopically ordered) motions. The 2H nucleus in an internally-mobile C–CD3 moiety serves as a prototype probe. The acronym is 2H/MOMD/MAS, where MOMD stands for “microscopic-order-macroscopic-disorder.” The key elements describing internal motions – their type, the local spatial restrictions, and related features of local geometry – are treated in MOMD generally, within their rigorous three-dimensional tensorial requirements. Based on this representation a single physically well-defined model of local motion has the capability of reproducing experimental spectra. There exist other methods for analyzing dynamic 2H/MAS spectra which advocate simple motional modes. Yet, to reproduce satisfactorily the experimental lineshapes, one has either to use unusual parameter values, or combine several simple motional modes. The multi-simple-mode reasoning assumes independence of the constituent modes, features ambiguity as different simple modes may be used, renders inter-system comparison difficult as the overall models differ, and makes possible model-improvement only by adding yet another simple mode, i.e., changing the overall model. 2H/MOMD/MAS is free of such limitations and inherently provides a clear physical interpretation. These features are illustrated. The advantage of 2H/MOMD/MAS in dealing with sensitive but hardly investigated slow-motional lineshapes is demonstrated by applying it to actual experimental data. The results differ from those obtained previously with a two-site exchange scheme that yielded unusual parameters.
Keywords: MOMD, MAS, Dynamics, Slow-motional NMR lineshapes, Stochastic Liouville Equation
Graphical Abstract

1. Introduction
NMR is a powerful method for studying structural dynamics in the solid-state [1–15]. Of particular interest is the internal mobility of bio-molecules, notably peptides and proteins. The samples studied are typically macroscopically disordered (i.e., polycrystalline) morphologies. Several methods, applicable to different timescales, have been developed. In this study we focus on stochastic internal motions that modulate anisotropic NMR interactions. The 2H nucleus in an internally-mobile C–CD3 moiety is selected as a prototype probe. A new approach for analyzing the slow-motional lineshapes emerging from the modulation of the 2H quadrupole interaction in the presence of Magic Angle Spinning (MAS) is developed. It represents an extension of the approach we previously utilized for lineshapes obtained in the absence of MAS; the utility and benefit of this approach in the presence of MAS are delineated below.
In the static limit the 2H spectrum from samples placed in conventional sample holders (no MAS) is the typical Pake pattern. In the so-called slow-motional regime, where the motional rates are comparable to the quadrupole interaction, hence are on the order of μs-ms, dynamic lineshapes emerge. This is distinct from the case in which these motional rates are much larger than the quadrupole interaction and the information on structural dynamics is comprised in relaxation parameters (in this case, 2H T1Z and T1Q). The slow-motional regime, which is the focus of this study, is substantially more sensitive than the fast-motional (relaxation) limit.
Methods for analyzing 2H lineshapes from polycrystalline samples exist [1–6,11–15]. Traditionally simple, typically jump-type, dynamic modes have been employed [2,3,5,11,14]. In most cases one simple mode does not reproduce the experimental lineshapes satisfactorily. Hence a collection of several such modes, i.e., multi-simple-mode schemes, have been devised [5,14]. Such an approach (1) assumes that the simple-mode constituents are independent, (2) produces models that are not unique as different simple modes may be used, (3) renders comparison of different systems difficult in view of the intrinsic differences among the overall models, and (4) renders improvement of the model possible only by adding yet another simple motion in order to modify the overall model. In some cases, a single simple motion featuring unusual values of parameters determined by data-fitting is used as alternative to a multi-simple-mode scheme; however, such parameter values are problematic.
We have developed a different approach for the analysis of dynamic 2H lineshapes [12,13]. This approach, based on the Stochastic Liouville Equation (SLE) developed by Freed and co-workers [16–20], is based on the following reasoning. To describe a restricted/internal motion one has to account for three key factors: the type of motion, the spatial (orientational) restrictions at the site of the motion, and related features of local geometry. In the SLE approach these factors are represented by tensors of full three-dimensionality. The motion itself is represented by a second rank diffusion tensor, which can yield jump-type dynamics when appropriate orientational restrictions are included (cf. Ref. [20]). The spatial restrictions are represented by a potential, u (in units of kT), that may be expanded in the full basis set of the generalized spherical harmonics. For practical reasons this expansion is truncated, typically preserving the (lowest) L = 2, and K = 0, 2 terms [17,18]. A second rank ordering tensor may be defined in terms of u. One then includes in the analysis the transformation of the Principal Axes System (PAS) of the local ordering tensor (usually taken for convenience the same as the PAS of the local diffusion tensor) into the PAS of the 2H quadrupolar tensor.
The preceding paragraph describes a general model for the local motion. Let us compare it with a multi-simple-mode model, for example, a scheme comprising exchange between two unequally-populated site-types combined with independent jumps on an arc centered at a nearby chemical bond.11 In fitting the experimental data one varies kexchange and kjump as (unrelated) kinetic parameters, as well as the exchange-related population, p, and the arc-length, l, as (unrelated) structural parameters. The corresponding SLE model is given by a probe executing diffusive local motion in the presence of a rhombic potential. Here one varies in the data-fitting process the diffusion rate constants R|| and R⊥ as the kinetic parameters, and the coefficients and of the local potential, u, as the structural parameters. The potential, u, can be displayed pictorially [21,22]; the corresponding Boltzmann factor, exp(−u), enables one to calculate order parameters, conformational entropy (representing the entire model rather than a given constituent thereof [23]), as well as any other ensemble average [16–21,24–26].
Relevant for present purposes is the extension of this SLE model called the microscopic-order-macroscopic-disorder (MOMD) approach developed initially for ESR applications, where the director (axis of preferential ordering) is randomly oriented over the macroscopic sample [27]. In Ref. [12] we developed MOMD for the analysis of 2H NMR lineshapes for samples in conventional sample holders (no MAS). Reference [13] is devoted to applications of this MOMD model. It is shown that physically well-defined parameter combinations differing in complexity can be devised by monitoring orienting potential magnitude, symmetry and (via the associated ordering tensor) orientation. This enables treating a continuous range of scenarios within the scope of the same general model. The drawbacks associated with the simple-mode rationale are thus mostly overcome. Applying 2H/MOMD and the corresponding multi-simple-mode schemes to the same experimental data yielded substantially different interpretations [12,13].
Magic Angle Spinning technology fundamentally changed the field of solid-state NMR. It also impacted the field of NMR lineshape analysis by increasing sensitivity (and improving additional aspects). Incorporating MAS into theories for treating restricted motions is an intricate and compute-intensive endeavor. Several authors met this challenge, generating and applying theoretical/computational tools based on the multi-simple-mode rationale [14,15,28–33]. Many of the applications reported so far feature motions that are either much slower or much faster that the quadrupole interaction. In relatively few applications was the slow-motional regime entered at least in part [28–30,33].
In this study we extend our 2H/MOMD approach [12,13] to include Magic Angle Spinning. All of the features of 2H/MOMD are preserved in 2H/MOMD/MAS. As pointed out above, the slow-motional regime has hardly been explored; 2H/MOMD/MAS is particularly useful in this highly sensitive parameter range. The option of having at hand two sets of evolving lineshapes – with and without MAS – is an interesting prospect. As shown below, 2H/MOMD/MAS is more sensitive to details of the motion than 2H/MOMD.
Because of the breadth of 1D dynamic 2H lineshapes, selective 2H-labeling has to be used. Recently a pulse-sequence for acquiring 3D 2H–13C–13C MAS spectra, which are obviously much better resolved, was developed [34]. This pulse-sequence was applied to the first immunoglobulin domain of streptococcal protein G, which was labeled uniformly with deuterium and 13C. A single 3D MAS spectrum comprises the 2H lineshapes from all of the aliphatic-carbon-bonded 2H atoms. So far only fast-motional spectra analyzed in terms of partially-averaged quad-rupolar tensors were reported. Further methodological developments are expected to generate 3D 2H–13C–13C MAS spectra amenable to quantitative analysis in the entire dynamic range.
The μs-ms time-window is relevant biologically. Current advances in MAS-based research in this important parameter-range concern mainly relaxation-dispersion [35]. The development of a general method for lineshape analysis in the μs-ms time-window is certainly timely and appropriate.
Vold and co-workers previously developed a SLE-based method for analyzing 2H lineshapes in the presence of MAS. A simple potential, and a motional mode essentially jump-type in nature, were used [36]. SLE-based methods for analyzing 2H lineshapes in DNA fragments, which are specific to ring-puckering, were also developed [37].
This article is structured as follows. The MOMD formalism has been given in previous publications. A summary of its basis and the enhancements implied by the inclusion of MAS are delineated in the Theoretical Background section. The Results and Discussion section comprises calculated 2H/MOMD/MAS spectra and their discussion. The current calculations allow for a rhombic local potential, an axial local diffusion tensor, and non-coincidence of the dynamic-model-related and quadrupolar-tensor-related tensor frames. We demonstrate the sensitivity and generality of this approach. We then illustrate applicability to actual spectra, and compare our interpretation with that of a previous study where the same spectra were analyzed with a simple-mode model that yielded unusual parameters.
2. Theoretical background
For a given molecule the Stochastic Liouville Equation for the density matrix operator, ρ̂ (Ω, t), evolving governed by a time-dependent spin Hamiltonian, ℋ̂, and a Markovian operator, Γ̂, is given by Refs. [16–18]:
| (1) |
where Ω denotes the probe coordinates, ℋ̂χ is the commutator super-operator defined with respect to ℋ̂, and ℒ̂χ ≡ i,ℋ̂χ + Γ̂ is the (stochastic) Liouville superoperator [20].
The formal solution of Eq. (1) may be written as:
| (2) |
The relevant frame (which includes the MAS angle) is shown in Fig. 1. Q is the quadrupolar tensor frame and M is the local ordering/local diffusion tensor frame. Both frames are fixed in the probe. In general, the principal axes of the M and Q tensors are tilted at angle βMQ with respect to each other. C is the uniaxial local director frame fixed in the molecule. For C–CD3 dynamics C is the average orientation of the C–CD3 bond. The M frame is ordered with respect to the C frame, and diffuses with respect to it. The C frame is distributed in space at random with respect to the rotor frame, R, which rotates in the laboratory frame, L, at the fixed angle of 54.7°. The motion of R is deterministic; the motion of M is stochastic.
Fig. 1.

Coordinate frames associated with 2H/MOMD/MAS: Q, PAS of the quadrupolar tensor, fixed in the probe; M, PAS of the local ordering/local diffusion tensor, fixed in the probe; C, local director frame, fixed in the molecule; R, rotor frame; L, space-fixed lab frame.
Let us focus on the deterministic motion of the R frame. The time-dependence of the Liouville superoperator is contained in a single azimuthal angle, ξ(t). In this case ĝ(t) may be expanded as a time-ordered exponential, with the motion of the rotor representing a coherent Markov process (see also Ref. [38]). The corresponding SLE is given by:
| (3) |
where the Markovian operator, Γ̂rot, is given by , with νrot denoting the spinning frequency of the rotor.
Let us now consider the stochastic motion of the M frame in the C frame, which represents the internal motion of the probe. The Markovian operator, Γ̂int (which would appear in Eq. (1) in the absence of MAS), is given by Ref. [20]:
| (4) |
Ĵ is the vector operator that generates an infinitesimal rotation of the probe, R is the time-independent diffusion tensor diagonal in the M frame, and Peq = exp(−u) is the equilibrium probability density of probe orientations, with u representing the local potential in units of kT. For uniaxial C one has ΩCM = (0, θ, φ).
In this study the probe is taken to be an axial rotator which in the absence of the restricting potential, u, is described by three decay rate constants, , where K = 0, 1, 2 (K is the order of the rank 2 diffusion tensor; R|| and R⊥ are the principal values of R). One may also define τ|| = 1/(6R||) and τ⊥ = 1/(6R⊥).
The general form of the local potential, U (ΩCM) is [17]:
| (5) |
are the Wigner rotation matrix elements (also known as the generalized spherical harmonic functions). If only the lowest, L = 2, terms are preserved, one will obtain the (real) rhombic potential [17]:
| (6) |
The coefficient evaluates the strength of u(ΩCM); measures its non-axiality.
Local order parameters are defined as [17]:
| (7) |
For at least three-fold symmetry around C and at least two-fold symmetry around ZM, only the irreducible tensor components (for K = 0) and (for K = 2) survive [17].
Given that the deterministic rotor motion and the stochastic internal motion are independent, the SLE is given by:
| (8) |
where Γ̂ = Γ̂rot + Γ̂int.
To obtain the overall spectrum, the lineshapes from the individual randomly oriented molecules are summed.
3. Results and discussion
3.1. Predictive simulations
All of the 2H spectra shown below were calculated with an effective quadrupolar constant <Q> = 53.06 kHz. The latter was obtained taking the established value of 167 kHz as quadrupole constant for a static C–D bond in a methyl group [39], and 110.4° as tetrahedral angle of the methyl group [40]. Very fast methyl-group rotation yields 167 × P2cos(110.4°) = 53.06 kHz, where P2 is the second-rank Legendre polynomial. An intrinsic linewidth of 1 kHz was used throughout, unless specified otherwise.
For motions that are rather close to the rigid-limit or to the extreme motional narrowing limit, the 2H/MAS spectrum comprises very narrow side-bands [14,28–33,36]. Here the analysis consists of measuring changes in the relative intensities, and in some cases the shapes, of the individual side-bands. To obtain accurate results the calculated spectra have to be very well resolved. This requires accounting for approximately 1000 molecular orientations in the spectrum-summing process [30–33,36]. On the other hand, the analysis of slow-motional lineshapes requires reproducing the overall shapes of spectra that are either smooth, or feature relatively broad side-bands. We found that accurate results can be obtained with less than 100 molecular orientations. When applied to such slow-motional lineshapes extending over a large-enough temperature-range, we find that 2H/MOMD/MAS yields an accurate and useful picture of the structural dynamics.
3.1.1. Axial local potential and isotropic local diffusion
Fig. 2 shows 2H lineshapes for an axial local potential, u, of 3.3 kT as a function of logR, where R is the isotropic diffusion constant in units of s−1. The rotor spinning frequency, νrot, is 6 kHz. Based on previous work (Refs. [12,13], and articles cited therein), the relatively weak potential of 3.3 kT is typical of methyl-moiety dynamics. The parameter logR is varied from 1.6 to 6.0, i.e., R is varied from 39.8 to 106 s−1; the spectra shown in Fig. 2 cover the whole time-window of interest.
Fig. 2.

2H MOMD/MAS spectra calculated for and logR = 1.6 (a), 1.8 (b), 2.0 (c), 3.2 (d), 3.7 (e), 3.9 (f), 4.2 (g), 4.8 (h) and 6.0 (i), where R denotes the isotropic local diffusion constant in units of s−1. The intrinsic linewidth, , is 1 kHz in Fig. 2a–f, and 0.25 kHz in Fig. 2g–i. The partially-averaged (by fast methyl rotation) quadrupolar constant is <Q> = 53.06 kHz; νrot = 6 kHz.
The lineshape shown in Fig. 2d, which corresponds to logR = 3.2, is reminiscent of the coalescence spectrum in the two-site-exchange model. An increase in complexity, associated with the appearance of side-bands, is brought about upon proceeding toward both limits of the MOMD/MAS motional time-window. This is reminiscent of the narrowing of the coalescence spectrum upon proceeding toward both limits of the two-site-exchange time-window, but it is more complex. For example, let us compare the MOMD/MAS spectra for logR = 2.0 (Fig. 2c) and logR = 3.7 (Fig. 2e). logR = 2.0 represents a rate that is slower, whereas logR = 3.7 a rate that is faster, than that corresponding to the coalescence-reminiscent lineshape. It can be seen that in spectrum 2c the second pair of sidebands, whereas in spectrum 2e the first pair of side-bands, has the largest relative intensity. This feature has useful practical implications (see below).
The axial local potential, (first term of Eq. (6)), may be negative or positive. Negative potentials, where , are associated “parallel” ordering, i.e., preferential orientation of ZM along the local director [17,25,26]. Positive potentials, where , are associated with “perpendicular” ordering, i.e., preferential orientation of ZM perpendicular to the local director [17,25,26]. By approximating the tetrahedral angle as 90°, one may envision in this case the C–C bond preceding the C–CD3 bond as main local ordering/local diffusion axis. Fig. 3 illustrates this scenario, using the valine side-chain as an example (cf. part a). The local director – ZC in Fig. 3b – represents the average orientation of the Cβ–Cγ1 (or Cβ–Cγ2) bond. Let us ascribe ZM (the local ordering/local diffusion axis) to the Cα–Cβ bond. For standard tetrahedral geometry ZM is tilted at 110.4° from ZQ (the instantaneous orientation of the Cβ–Cγ1 (or Cβ–Cγ2) bond). In tightly-packed immediate surroundings ZQ orients preferentially along ZC; taking βMQ ~ 90°, ZM will orient preferentially perpendicular to ZC, i.e., exhibit negative ordering.
Fig. 3.
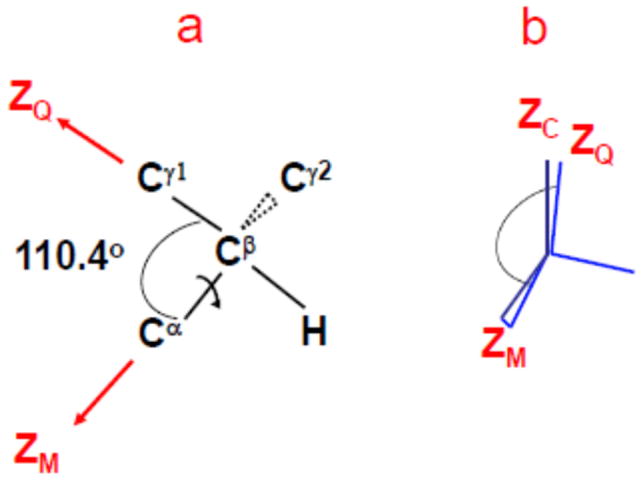
Schematic of valine-methyl side-chain for standard tetrahedral site-symmetry and very fast methyl reorientation (a). Illustration of perpendicular ordering of ZM (the principal axis of the local ordering/local diffusion tensor) in the uniaxial director frame, C (b).
Fig. 4 shows 2H lineshapes obtained for potentials with (left column) and (right column), with logR varied in the range of 3–6. While the spectra in Fig. 4a and e, corresponding to logR = 3, differ to a small extent, the spectra in Fig. 4b and f, corresponding to logR = 4, differ substantially. So do the spectra in Fig. 4c and g, corresponding to logR = 5, and Fig. 4d and h, corresponding to logR = 6.
Fig. 4.

2H MOMD/MAS spectra calculated for (parts a–d) and (parts e–h). logR is 3.0 in parts a and e, 4.0 in parts b and f, 5.0 in parts c and g, and 6.0 in parts d and h. The intrinsic linewidth, , is 1 kHz and <Q> is 53.06 kHz; νrot = 6 kHz.
Fig. 5 shows 2H lineshapes obtained for potentials with (left column) and (right column), with logR varied in the range of 3–6. Like Fig. 4a and e, associated with logR = 3, Fig. 5a and e, also associated with logR = 3, are quite similar. Actually all four spectra are similar, indicating that the logR = 3 region of 2H/MOMD/MAS is rather insensitive for relatively weak axial potentials. Fig. 5b and f, associated with logR = 4, differ substantially. Fig. 5c and g, associated with logR = 5, differ slightly; so do Fig. 5d and h, associated with logR = 6. Thus, “perpendicular” ordering is less sensitive to variations in dynamics than “parallel” ordering. However, on the whole Figs. 2, 4 and 5 demonstrate substantial sensitivity of 2H/MOMD/MAS even within the scope of the simple parameter combination of axial local potential and isotropic local diffusion.
Fig. 5.

2H MOMD/MAS spectra calculated with (parts a–d) and (parts e–h). logR is 3.0 in parts a and e; 4.0 in parts b and f; 5.0 in parts c and g; and 6.0 in parts d and h. , <Q> and νrot are as specified in the captions of Fig. 4.
3.1.2. Axial local diffusion, rhombic local potentials, and tilted ordering/diffusion frame
Previous work based on 2H/MOMD (no MAS) showed that axial diffusion, rhombic potential, and βMQ ≠ 0 is an adequate parameter combination for analyzing typical slow-motional 2H lineshapes [12,13]. This is also relevant to 2H/MOMD/MAS.
We select as an example an axial diffusion tensor with logR⊥ = 4.4 and logR|| = 5 (Fig. 6). logR|| = 5.0 represents faster motion around the C–CD3 bond and logR⊥ = 4.4 represents slower motion of the C–CD3 bond. The rhombic potentials (Eq. (6)) are given by the coefficients and , with values specified in Fig. 6. The parameter measures potential strength; let us take the ratio as measure of potential rhombicity. The mean of the values in Fig. 6 is 2.03; the extreme values of deviate from it by 11%. The mean of is 0.47; the extreme values of deviate from it by 10%. Despite these relatively small differences in and , the 2H lineshapes of Fig. 6a–d shows distinguishing features. Thus, in Fig. 6a and b the first pair of side-bands exhibit the largest intensity; in Fig. 6c the center-band and the first pair of side-bands have comparable intensity; in Fig. 6d the center-band has the highest intensity. The sensitivity of the slow-motional regime to the form of the rhombic local potential is considerable. The rotor spinning frequency used to generate Fig. 6 is νrot = 4 kHz.
Fig. 6.

2H MOMD/MAS spectra calculated for axial local diffusion with logR⊥ = 4.4 and logR|| = 5.0, and rhombic potential with and (part a); and (part b); and (part c); and and (part d). and <Q> are as specified in the captions of Fig. 4; νrot = 4 kHz.
Another important feature is the orientation of ZM (main local ordering/local diffusion axis) with respect to ZQ (principal axis of the quadrupolar tensor), given by the angle βMQ. The sensitivity of 2H/MOMD/MAS to βMQ is illustrated in Fig. 7. The local potential is given by and , and the local diffusion tensor by logR⊥ = 2.2 and logR|| = 4.5. βMQ is ascribed the values of 90, 100, 110, 120 and 130° (the vicinity of the tetrahedral angle). Several spectral changes implied by increasing βMQ from 90° to 130° can be discerned. Some features, such as the intensity of the shoulder located at approximately ±20 kHz, change monotonically. Other features are non-monotonic in nature. Thus, for β MQ equal to 110 and 120° (90 and 130°) the intensity of the center-band is larger (smaller) than the intensity of the first pair of side-bands; for βMQ = 100° the intensities of the center-band and the first pair of sidebands are comparable.
Fig. 7.

2H MOMD/MAS spectra calculated for rhombic local potential with and , and axial local diffusion with logR⊥ = 2.2 and logR|| = 4.5. The angle βMQ is 90° (black), 100° (red), 110° (green), 120° (blue) and 130° (orange). , <Q> and νrot are as specified in the captions of Fig. 4. (For interpretation of the references to colour in this figure legend, the reader is referred to the web version of this article.)
3.1.3. MAS and νMAS
To increase the amount of data at hand for determining the physical parameters one can vary several experimental parameters that affect the 2H lineshapes. MAS itself is one of them. Fig. 8a shows slow-motional 2H/MOMD/MAS spectra for a rotor spinning frequency, νrot, of 6 kHz. The physical parameters used include a rhombic potential with and , a local diffusion tensor with logR⊥ = 2.2 and logR|| = 4.3, and βMQ = 100, 120 or 130°. Fig. 8b shows the 2H/MOMD spectra (no MAS) obtained for the same physical parameters. In all of the cases the line-shapes obtained in the presence of MAS are more structured than their analogues obtained without MAS.
Fig. 8.

2H MOMD/MAS spectra calculated for rhombic local potential with and , axial local diffusion with logR⊥ = 2.2 and logR|| = 4.3, and angle βMQ = 100° (black), 120° (red) or 130° (blue) (part a). 2H MOMD (no MAS) spectra calculated with the same parameters (part b). , <Q> and νrot are as specified in the captions of Fig. 4.
Fig. 9 shows 2H lineshapes obtained for a local potential with and , and local diffusion tensors with 3.9 ≤ logR⊥ ≤ 4.6 and 5.0 ≤ logR|| ≤ 5.5. Fig. 9a was obtained with νrot = 4 kHz; Fig. 9b was obtained with νrot = 6 kHz. Invariably the side-bands of the spectra obtained with νrot = 4 kHz (Fig. 9a) are narrower than the side-bands of the spectra obtained with νrot = 6 kHz (Fig. 9b). This is the case even for pairs of spectra where the νrot = 6 kHz constituent is associated with larger parallel diffusion constant, with all of the other parameter identical (spectra colored red in Fig. 9a and b). Clearly, the spectra shown in Fig. 9a differ qualitatively from the spectra shown in Fig. 9b (in addition to the inherently denser side-bands for smaller νrot).
Fig. 9.

Part a: 2H MOMD/MAS spectra calculated for rhombic local potential with and . Axial local diffusion is used with logR⊥ = 4.0 and logR|| = 5.0 (black); logR⊥ =4.4 and logR|| = 5.0 (red); logR⊥ = 4.6 and logR|| = 5.0 (blue). νrot = 4 kHz was used. Part b: 2H MOMD/MAS spectra calculated for rhombic local potential with and . Axial local diffusion is used with logR⊥ = 4.1 and logR|| = 5.5 (black); logR⊥ = 4.4 and logR|| = 5.4 (red); logR⊥ = 3.9 and logR|| = 5.0 (blue). νrot = 6 kHz was used. and <Q> are as specified in the captions of Fig. 4. (For interpretation of the references to colour in this figure legend, the reader is referred to the web version of this article.)
3.1.4. Analysis of actual experimental data
There are a considerable number of studies reporting on multi-simple-mode analyses of 2H lineshapes in the absence of MAS [11,41,42]. A more limited number of studies report on the analysis of 2H lineshapes from polycrystalline samples in the presence of MAS [28–33,36,43]. The latter category focuses to a large extent on the regions close to the rigid-limit or the extreme-motional-narrowing limit.
Only in a few cases were slow-motional spectra acquired and analyzed. Such lineshapes appear in the work of S. Vega et al. (e.g., Refs. [28,29,33]). These authors developed analysis of dynamics within the scope of Floquet theory. The systems studied are quite intricate, consisting of mesoporous materials that host in their pores aqueous solutions of small 2H-labeled molecules. For example, in Ref. [33] the guest molecules are distributed among three categories: immobile molecules, molecules adsorbed at the inner surface of the host, and molecules reorienting freely in the solution filling the pores. The experimental parameter varied is the extent to which the pores are filled with solution, and/or the temperature. The analysis involves subtracting from the experimental spectrum the immobile component allowing its contribution to vary, and analyzing the remaining lineshape in terms of exchange between a site where the guest is adsorbed uniformly onto the host walls, and a site where it executes isotropic Brownian motion within the pore-filling solution. Such complexity is not suited as a test-case for a new theoretical approach; it will be addressed in future work.
Another study that shows several slow-motional 2H spectra is the work of Hologne and Hirshinger [30]. These authors studied the relatively simple system of the α-p-tert-buthylcalix[4] arene inclusion compound comprising as guest either 2H-labeled-dimethylsulfone, or 2H-labeled-nitrobenzene. Most spectra belong to the very-slow-motion limit. Two lineshapes, pertaining to the 2H-labeled-dimethylsulfone guest which is depicted schematically in Fig. 10, are of the slow-motional type. These spectra, acquired at 355 and 345 K, are shown in Fig. 11a and b. In Ref. [30] they were reproduced with an effective quadrupolar constant, <Q>, of 56 kHz (the established value is 53.06 kHz [39,40]), and a dynamic model consisting of exchange between two equally-populated sites with an angular separation of 106°. The CSC angle, which represents that angular separation, is depicted in Fig. 10. An extensive study on the structure of 87 uncoordinated methyl sulfoxides determined that the median value of this angle is 98°, with minimum of 92.2° and maximum of 103.5° [44]. Correlation times of τ355 = (5.0 × 0.5) × 10−5 s for 355 K (Fig. 11a), and τ345 = (1.00 × 0.05) × 10−4 s for 345 K (Fig. 11b), were determined. Taking R = 1/(6τ) (as in MOMD), one obtains logR = 3.5 and 3.2 for the 355 and 345 K spectra, respectively.
Fig. 10.
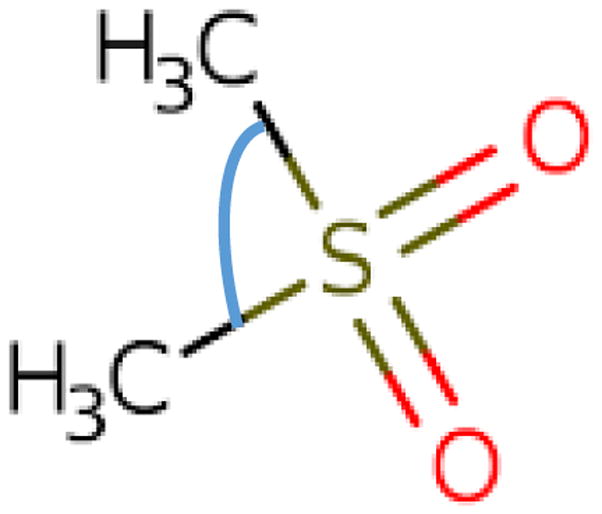
Schematic of dimethylsulfone. The CSC angle serving as angular separation in the two-site exchange model of Ref. [30] is depicted in blue. (For interpretation of the references to colour in this figure legend, the reader is referred to the web version of this article.)
Fig. 11.

Experimental 2H MAS spectra from polycrystalline α-p-tert-buthylcalix[4]arene inclusion compound comprising as guest 2H-labeled-dimethylsulfone. Spectrum a was acquired at 355 K and spectrum b at 345 K [30]. 2H/MOMD/MAS spectra calculated for an axial potential with and logR = 2.0 (part c), logR = 1.8 (part d), and logR = 1.6 (part e). , <Q> and νrot are as specified in the captions of Fig. 4.
Fig. 12 shows 2H/MOMD/MAS simulations obtained with logR = 3.5 and axial local potentials with coefficients ranging from to . The value of logR = 3.5 is the logarithm of R = 1=(6τ355). MOMD uses as the parameter associated with the local spatial restrictions. The two-site-exchange analogue may be taken to be p × (1−p), which for fast motion corresponds to (the square of the axial form of Eq. (7)). For equally-populated sites p × (1−p) = 0.25; corresponds to (e.g., Fig. 2 of Ref. [21]). This estimate lies within the range spanned by in Fig. 12. Thus, if the particular two-site-exchange scheme of Ref. [30] were a good approximation to general 2H/MOMD/MAS, some of the spectra shown in Fig. 12 would have reproduced the experimental lineshapes of Fig. 11a and b reasonably well.
Fig. 12.

2H MOMD/MAS spectra calculated for isotropic local diffusion with logR = 3.5 and axial local potential with (part a); (part b); (part c); (part a); (part d); (part e); and (part f). , <Q> and νrot are as specified in the captions of Fig. 4.
This expectation is not borne out; the key feature of the second pair of side-bands having the largest relative intensity in Fig. 11a and b is not reproduced by any of the lineshapes shown in Fig. 12, notably the line-shapes in Fig. 12d–f, whose overall appearance resembles the lineshapes in Fig. 11a and b. Rather, consistently the first pair of side-bands has the largest relative intensity in Fig. 12d–f.
On the other hand, the dominant feature of the experimental spectra in Fig. 11a and b are reproduced by the MOMD spectra in Fig. 11c–e, which were obtained for , and logR = 2.0, 1.8 and 1.6, respectively. Thus, 2H/MOMD/MAS can reproduce the key features of the experimental spectra shown in Fig. 11a and b with considerably stronger potential, and substantially smaller motional rates, than the formal analogues of these quantities in the model featuring exchange between two sites with angular separation of 106°. Also, we have used the established value of <Q> = 53.06 kHz,39,40 to be compared with <Q> = 56 kHz used in Ref. [30].
The results outlined above are based on the simple MOMD parameter combination of axial local potential and isotropic local diffusion. Utilizing this simple parameter combination was required to render comparison with the model used in Ref. [30] meaningful. On the basis of the sensitivity of the 2H/MOMD/MAS analysis illustrated in Figs. 6 and 7 it is very likely that the agreement with the experiment will be improved by allowing additional parameters to vary. However, to determine an unambiguous picture of structural dynamics, a larger set of experimental temperature-dependent slow-motional spectra is required.
We hope that this article will motivate experimentalists to look for conditions where slow-motional 2H/MAS spectra associated with important internal motions, particularly in peptides, proteins and DNA fragments, can be acquired as a function of temperature. There is ample evidence that conditions where slow-motional 2H spectra in the absence of MAS can be acquired exist [3,5,23,32,37,41,42].
3.1.5. Prospects
Several important problems underlie the current scarcity of experimental slow-motional 2H/MAS spectra. One of them is associated with the requirement for selective deuterium labeling. As noted above, there is substantial progress on this issue [34]. Efforts to alleviate the computational burden by incorporating into the 2H/MOMD/MAS formalism pruning of basis sets [45] are in progress. The method developed in this study for 2H can be extended to the 13CO, 15N–1H and 13C–1H spin systems.
4. Conclusions
A new method for the analysis of slow-motional 2H NMR lineshapes from polycrystalline samples in the presence of MAS has been developed. It is based on the MOMD approach, which represents the SLE developed by Freed et al. for restricted motions applied to macroscopically disordered samples. We have shown that 2H/MOMD/MAS can describe internal mobility over a wide range of features within the scope of a single well-defined model.
2H/MOMD/MAS lineshapes have has been compared to experimental lineshapes. The picture of structural dynamics that emerges from the 2H/MOMD/MAS analysis differs substantially from that obtained using a two-site exchange scheme with unusual parameters. This illustrates the ability of 2H/MOMD/MAS to provide useful insights.
Acknowledgments
We thank Dr. Alex Nevzorov for helpful discussions. This work was supported by the Israel - U.S.A. Binational Science Foundation (Grant No. 2016097 to E.M. and J.H.F.), and the Israel Science Foundation (Grant No. 469/15 to E.M.). This work was also supported by NIH/NIGMS grant P41GM103521 to J.H.F.
References
- 1.Spiess HW. In: Dynamic NMR Spectroscopy. Diehl P, Fluck E, Kosfeld R, editors. Vol. 15. 1978. pp. 55–241. [Google Scholar]
- 2.Huang TH, Skarjune RP, Wittebort RJ, Griffin RG, Oldfield E. Restricted rotational isomerization in polymethylene chains. J Am Chem Soc. 1980;102:7379–7381. [Google Scholar]
- 3.Batchelder LS, Sullivan CE, Jelinski LW, Torchia DA. Characterization of leucine side-chain reorientation in collagen fibrils by solid-state 2H NMR. Proc Natl Acad Sci USA. 1982;79:386–389. doi: 10.1073/pnas.79.2.386. [DOI] [PMC free article] [PubMed] [Google Scholar]
- 4.Vold RR, Vold RL. Deuterium relaxation in molecular solids. Adv Magn Opt Reson. 1991;16:85–171. [Google Scholar]
- 5.Alam TM, Drobny GP. Solid-state NMR studies of DNA structure and dynamics. Chem Rev. 1991;91:1545–1590. [Google Scholar]
- 6.McDermott AE, Polenova T, editors. Solid-State NMR Studies of Biopolymers. John Wiley and Sons; U.K: 2010. [Google Scholar]
- 7.Krushelnitsky A, Reichert D, Saalwachter K. Solid-state NMR approaches to internal dynamics of proteins: from picoseconds to microseconds and seconds. Accounts Chem Res. 2013;46:2028–2036. doi: 10.1021/ar300292p. [DOI] [PubMed] [Google Scholar]
- 8.Lewandowski JR. Advances in solid-state relaxation methodology for probing site-specific protein dynamics. Accounts Chem Res. 2013;46:2018–2027. doi: 10.1021/ar300334g. [DOI] [PubMed] [Google Scholar]
- 9.Watt ED, Rienstra CM. Recent advances in solid-state nuclear magnetic resonance techniques to quantify biomolecular dynamics. Anal Chem Rev. 2013;86:58–64. doi: 10.1021/ac403956k. [DOI] [PMC free article] [PubMed] [Google Scholar]
- 10.Schanda P, Ernst M. Studying dynamics by magic-angle-spinning solid-state NMR spectroscopy: principles and applications to biomolecules. Prog Nucl Magn Reson Spectrosc. 2016;96:1–46. doi: 10.1016/j.pnmrs.2016.02.001. [DOI] [PMC free article] [PubMed] [Google Scholar]
- 11.Vugmeyster L, Ostrovsky D. Static solid-state 2H NMR methods in studies of protein side-chain dynamics. Prog Nucl Magn Reson Spectrosc. 2017;101:1–17. doi: 10.1016/j.pnmrs.2017.02.001. [DOI] [PMC free article] [PubMed] [Google Scholar]
- 12.Meirovitch E, Liang Z, Freed JH. Protein dynamics in the solid state from 2H NMR line shape analysis: a consistent perspective. J Phys Chem B. 2015;119:2857–2868. doi: 10.1021/jp511386b. [DOI] [PMC free article] [PubMed] [Google Scholar]
- 13.Meirovitch E, Liang Z, Freed JH. Protein dynamics in the solid state from 2H NMR line shape analysis. II. MOMD applied to C–D and C–CD3 probes. J Phys Chem B. 2015;119:14022–14032. doi: 10.1021/acs.jpcb.5b07434. [DOI] [PMC free article] [PubMed] [Google Scholar]
- 14.Vold RL, Hoatson GL. Effects of jump dynamics on solid state nuclear magnetic resonance line shapes and spin relaxation times. J Magn Res. 2009;198:57–72. doi: 10.1016/j.jmr.2009.01.008. [DOI] [PubMed] [Google Scholar]
- 15.Echodu D, Goobes G, Shajani Z, Pederson K, Meints G, Varani G, Drobny GP. Furanose dynamics in the HhaI methyltransferase target DNA studied by solution and solid-state NMR relaxation. J Phys Chem B. 2008;112:13934–13944. doi: 10.1021/jp801723x. [DOI] [PMC free article] [PubMed] [Google Scholar]
- 16.Polnaszek CF, Bruno GV, Freed JH. ESR lineshapes in the slow-motional region: anisotropic liquids. J Chem Phys. 1973;58:3185–3199. [Google Scholar]
- 17.Polnaszek CF, Freed JH. Electron spin resonance studies of anisotropic ordering, spin relaxation, and slow tumbling in liquid crystalline solvents. J Phys Chem. 1975;79:2283–2306. [Google Scholar]
- 18.Lin WJ, Freed JH. Electron spin resonance studies of anisotropic ordering, spin relaxation, and slow tumbling in liquid crystalline solvents: 3. Smectics. J Phys Chem. 1979;83:379–401. [Google Scholar]
- 19.Polimeno A, Freed JH. A many-body stochastic approach to rotational motions in liquids. Adv Chem Phys. 1993;83:89–204. [Google Scholar]
- 20.Polimeno A, Freed JH. Slow-motional ESR in complex fluids: the slowly relaxing local structure model of solvent cage effects. J Phys Chem. 1995;99:10995–11006. [Google Scholar]
- 21.Meirovitch E, Shapiro Yu E, Polimeno A, Freed JH. Structural dynamics of bio-macromolecules by NMR: the slowly relaxing local structure approach. Prog Nucl Magn Reson Spectrosc. 2010;56:360–405. doi: 10.1016/j.pnmrs.2010.03.002. [DOI] [PMC free article] [PubMed] [Google Scholar]
- 22.Tchaicheeyan O, Freed JH, Meirovitch E. Local ordering at mobile sites in proteins from nuclear magnetic resonance relaxation: the role of site-symmetry. J Phys Chem B. 2016;120:2886–2898. doi: 10.1021/acs.jpcb.6b00524. [DOI] [PMC free article] [PubMed] [Google Scholar]
- 23.Vugmeyster L, Ostrovsky D, Khadjinova A, Elleden J, Hoatson GL, Vold RL. Slow motions in the hydrophobic core of chicken villin headpiece subdomain and their contributions to configurational entropy and heat capacity from solid-state deuteron NMR measurements. Biochemistry. 2011;50:10637–10646. doi: 10.1021/bi201515b. [DOI] [PMC free article] [PubMed] [Google Scholar]
- 24.Nordio PL, Busolin P. Electron spin resonance line shapes in partially oriented systems. J Chem Phys. 1971;55:5485–5490. [Google Scholar]
- 25.Emsley JW, editor. NMR of Liquid Crystals. Reidel; Dordrecht: 1983. [Google Scholar]
- 26.Luckhurst GR, Veracini CA, editors. The Molecular Dynamics of Liquid Crystals. Kluwer Academic Publishers; The Netherlands: 1994. [Google Scholar]
- 27.Meirovitch E, Nayeem A, Freed JH. Protein-lipid interactions: a single-site interpretation of the ESR spectra. J Phys Chem. 1984;88:3454–3465. [Google Scholar]
- 28.Pizzanelli S, Kababya S, Frydman V, Landau M, Vega S. NMR study of the adsorption-desorption kinetics of dissolved tetraalanine in MCM-41 mesoporous material. J Phys Chem B. 2005;109:8029–8039. doi: 10.1021/jp044389e. [DOI] [PubMed] [Google Scholar]
- 29.Jayanthi S, Kababya S, Schmidt A, Vega S. Deuterium MAS NMR and local molecular dynamic model to study adsorption-desorption kinetics of a dipeptide at the inner surface of SBA-15. J Phys Chem C. 2016;120:2806–2979. [Google Scholar]
- 30.Hologne M, Hirschinger J. Molecular dynamics as studied by static-powder and magic-angle-spinning 2H NMR. Solid State Nucl Magn Reson. 2004;26:1–10. doi: 10.1016/S0926-2040(03)00062-6. [DOI] [PubMed] [Google Scholar]
- 31.Vold RL, Hoatson GL. Deuteron NMR studies of guest motion in alkanoic acid urea inclusion compoun. J Chem Phys. 1998;108:7305–7316. [Google Scholar]
- 32.Breen NF, Li K, Olsen GL, Drobny GP. Deuterium magic angle spinning NMR used to study the dynamics of peptides adsorbed onto polystyrene and functionalized polystyrene surfaces. J Phys Chem B. 2011;115:9452–9460. doi: 10.1021/jp1101829. [DOI] [PMC free article] [PubMed] [Google Scholar]
- 33.Amitay-Rosen T, Kababya S, Vega S. A dynamic magic angle spinning NMR study of the local mobility of alanine in an aqueous environment at the inner surface of mesoporous materials. J Phys Chem B. 2009;113:6267–6282. doi: 10.1021/jp810572r. [DOI] [PubMed] [Google Scholar]
- 34.Shi X, Rienstra CM. Site-specific internal motions in GB1 protein microcrystals revealed by 3D 2H–13C–13C solid-state NMR spectroscopy. J Am Chem Soc. 2016;138:4105–4119. doi: 10.1021/jacs.5b12974. [DOI] [PMC free article] [PubMed] [Google Scholar]
- 35.Kuranskas V, Izmailov SA, Rogacheva ON, Hessel A, Ayala I, Woodhouse J, Shilova A, Xue Y, Yuwen T, Coquelle N, Colletier J-P, Skrynnikov NR, Schanda P. Slow conformational exchange and overall rocking motion in ubiquitin protein crystals. Nat Commun. 2017;8:145. doi: 10.1038/s41467-017-00165-8. https://doi.org/10.1038/s41467-017-00165-8. [DOI] [PMC free article] [PubMed] [Google Scholar]
- 36.Kristiensen JH, Hoatson GL, Vold RL. Investigation of multiaxial molecular dynamics by 2H MAS NMR spectroscopy. Solid State Nucl Magn Reson. 1998;13:1–37. doi: 10.1016/s0926-2040(98)00074-5. [DOI] [PubMed] [Google Scholar]
- 37.Meints GA, Karlsson T, Drobny GP. Modeling furanose ring dynamics in DNA. J Am Chem Soc. 2001;123:10030–10038. doi: 10.1021/ja010721d. [DOI] [PubMed] [Google Scholar]
- 38.Nevzorov AA. Coherent and stochastic averaging in solid-state NMR. J Magn Res. 2014;249:9–15. doi: 10.1016/j.jmr.2014.09.023. [DOI] [PubMed] [Google Scholar]
- 39.Mittermaier A, Kay LE. Measurement of methyl 2H quadrupolar couplings in oriented proteins. how uniform is the quadrupolar coupling constant? J Am Chem Soc. 1999;121:10608–10613. [Google Scholar]
- 40.Tugarinov V, Kay LE. 1H, 13C–1H, 1H dipolar cross-correlated spin relaxation. J Biomol NMR. 2004;29:369–376. doi: 10.1023/B:JNMR.0000032562.07475.7f. [DOI] [PubMed] [Google Scholar]
- 41.Vugmeyster L, Clark MA, Falconer IB, Ostrovsky D, Gantz D, Qiang W, Hoatson GL. Flexibility and solvation of amyloid-β hydrophobic core. J Biol Chem. 2016;291:18484–18495. doi: 10.1074/jbc.M116.740530. [DOI] [PMC free article] [PubMed] [Google Scholar]
- 42.Ferreria HE, Drobny GP. Solid state deuterium NMR study of LKα14 peptide aggregation in biosilica. Biointerphases. 2017;12:02D418–211. doi: 10.1116/1.4986907. [DOI] [PMC free article] [PubMed] [Google Scholar]
- 43.Li K, Emani PS, Ash J, Groves M, Drobny GP. A study of phenylalanine side-chain dynamics in surface-adsorbed peptides using solid-state deuterium NMR and rotamer library statistics. J Am Chem Soc. 2014;136:11402–11411. doi: 10.1021/ja504677d. [DOI] [PubMed] [Google Scholar]
- 44.Calligaris M. Structure and bonding in metal sulfoxide complexes: an update. Coord Chem. 2004;248:351–375. [Google Scholar]
- 45.Vasadava KV, Schneider DJ, Freed JH. Calculation of ESR spectra and related fokker-planck forms by the use of the lanczos algorithm: II. Criteria for truncation of the basis sets and recursive steps utilizing conjugate gradients. J Chem Phys. 1987;86:647–661. [Google Scholar]