

Summary
The development of CD1d-restricted invariant NKT (iNKT) cells, a population that is critical for both innate and adaptive immunity, is regulated by multiple transcription factors, but the molecular mechanisms underlying how the transcriptional activation of these factors are regulated during iNKT development remain largely unknown. We found that the histone acetyltransferase GCN5 is essential for iNKT cell development during the maturation stage. GCN5 deficiency blocked iNKT cell development in a cell-intrinsic manner. At the molecular level, GCN5 is a specific lysine acetyltransferase of EGR2, a transcription factor required for iNKT cell development. GCN5-mediated acetylation positively regulated EGR2 transcriptional activity, and both genetic and pharmacological GCN5 suppression specifically inhibited the transcription of EGR2 target genes in iNKT cells, including Runx1, PLZF, IL-2Rb, and T-bet. Therefore, our study revealed GCN5-mediated EGR2 acetylation as a molecular mechanism that regulates iNKT development.
Keywords: GCN5/EGR2/Acetylation/iNKT
Graphical abstract
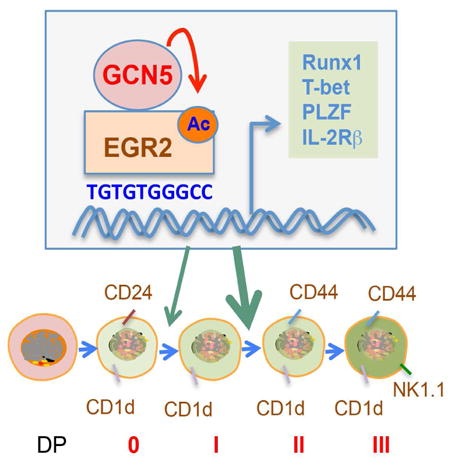
Invariant natural killer T (iNKT) cells form a distinct lymphocyte lineage that regulates a broad range of immune responses. iNKT cells are a specialized subset of αβ T cells that express a CD1d-restricted T cell receptor (TCR) composed of an invariant Vα14-Jα18 TCR-α chain in combination with limited TCR-β chains. Upon activation, iNKT cells rapidly differentiate into NKT1, NKT2 and NKT17, and secrete a broad range of cytokines, such as IFN-γ, IL-4 and IL-17, thus contributing to the efficient differentiation of other immune cell types. Therefore, iNKT cells are key players in the immune response, acting as a bridge between innate and adaptive immunity (Engel et al., 2012; Kadowaki et al., 2001; Lee et al., 2013). The multifunctional properties of iNKT cells are established during the process of iNKT cell development (Das et al., 2010). iNKT cells arise from CD4+CD8+ double-positive thymocytes and diverge from mainstream T cell development upon expression of the invariant TCRα chain followed by the selection of CD1d-expressing thymocytes. iNKT cell development has been classified into four distinctive stages based on the expression of CD24, CD44, and NK1.1 (Benlagha et al., 2005; Bezbradica et al., 2005; Egawa et al., 2005). Many transcription factors, signaling molecules, and cytokines have been shown to be crucial at multiple stages of iNKT cell development (Kim et al., 2015). For example, the transcription factor ROR-γt is required for the productive rearrangement of the TCRα gene segment Vα14 to the distal Jα18 (Benlagha et al., 2005; Bezbradica et al., 2005; Egawa et al., 2005), while transcription factors NFAT, EGR2, T-bet, and vitamin D receptor (VDR) control the later stages of iNKT cell terminal maturation (Cantorna, 2010; Godfrey et al., 2009; Lazarevic et al., 2009). These transcription factors mediate the expression of a cascade of genes that initiate iNKT cell development and maturation in the thymus; however, the molecular switches that activate these various transcription factors remain unidentified.
The lysine acetyltransferases GCN5 was identified as the first transcription-related histone acetyltransferase in 1996 (Brownell et al., 1996), which is a critical component in the transcription co-activator complexes of SAGA and ADA in yeast, or ATAC in metazoans in promoting gene transcription (Koutelou et al., 2010). GCN5 has been shown to play critical roles in a variety of important biological functions including metabolic regulation, cell growth and survival, DNA damage repair, and embryonic development (Phan et al., 2005). Recent studies have implied possible important functions of GCN5 in immune regulation. GCN5 regulates CD4+ helper T (Th) cell differentiation toward IL-9–producing Th9 cells by activating the transcription factor PU.1 (Goswami and Kaplan, 2012). Jin et al reported that GCN5, together with its family member PCAF, negatively regulate interferon production through HAT-independent suppression of TBK1 activation (Jin et al., 2014). However, the physiological functions of GCN5 in immune regulation remain largely undefined.
In the current study, we generated a strain of mice with a T cell-specific Gcn5 gene deletion and discovered that GCN5 is essential for iNKT development. Loss of GCN5 function impaired the transition of iNKT cells from stage 0 to 1 and diminished the stage 1 to 2 transition during iNKT development. GCN5 regulates iNKT cell development through the direct modification and activation of EGR2, a transcription factor that is required for early stages of iNKT development. Our studies define a previously unappreciated molecular mechanism that drives iNKT cell development.
Results
GCN5 is required for iNKT cell development in a cell-intrinsic manner
To investigate the role of GCN5 in T cell immunity, we generated a strain of T cell-specific Gcn5 knockout (GCN5 KO) mice by breeding Lck-Cre transgenic mice with Gcn5 floxed mice. In these mice, Cre recombinase expression driven by the Lck promoter mediates Gcn5 deletion from the CD4/CD8 double-negative stage (Hennet et al., 1995). Immunoblot analysis demonstrated that GCN5 was efficiently deleted from thymic T cells (Fig. 1A). The percentages of cells at CD4/CD8 double-positive and single-positive stages were not altered in the thymus of GCN5 KO mice (Fig. 1B). However, GCN5 gene deletion resulted in an about 20% reduction in the total thymocyte numbers in mice. As a consequence, a similar level reduction in the absolute numbers of CD4/CD8 double-positive and single-positive cells. While a slight but statistically significant increase in the percentage of double-negative cells was observed upon Gcn5 gene deletion, their absolute number was not altered due to the reduction in total thymocytes in GCN5 KO mice (Fig. 1B-D). These results indicate that GCN5 loss led to a modest impairment in T cell development. Interestingly, the generation of iNKT cells, identified by TCRβ antibody and NK1.1 or CD1d-αGalCer tetramer (Fig. 1E & F), was largely diminished in the thymus of GCN5 KO mice (Fig. 1E & F). This block could not be compensated in the periphery, as indicated by a profound decrease in iNKT cell frequencies and numbers in the spleen and liver of GCN5 KO mice (Fig. 1E & F). Impaired iNKT cell development was unlikely due to elevated cell death, as annexin V-positive populations of iNKT cells in the thymus, spleen, and liver were indistinguishable between WT and GCN5 KO mice (Fig. 1G). Therefore, these results indicated that GCN5 is required for the development of iNKT cells in mice.
Fig. 1. Impaired NKT cell development in GCN5 KO mice.
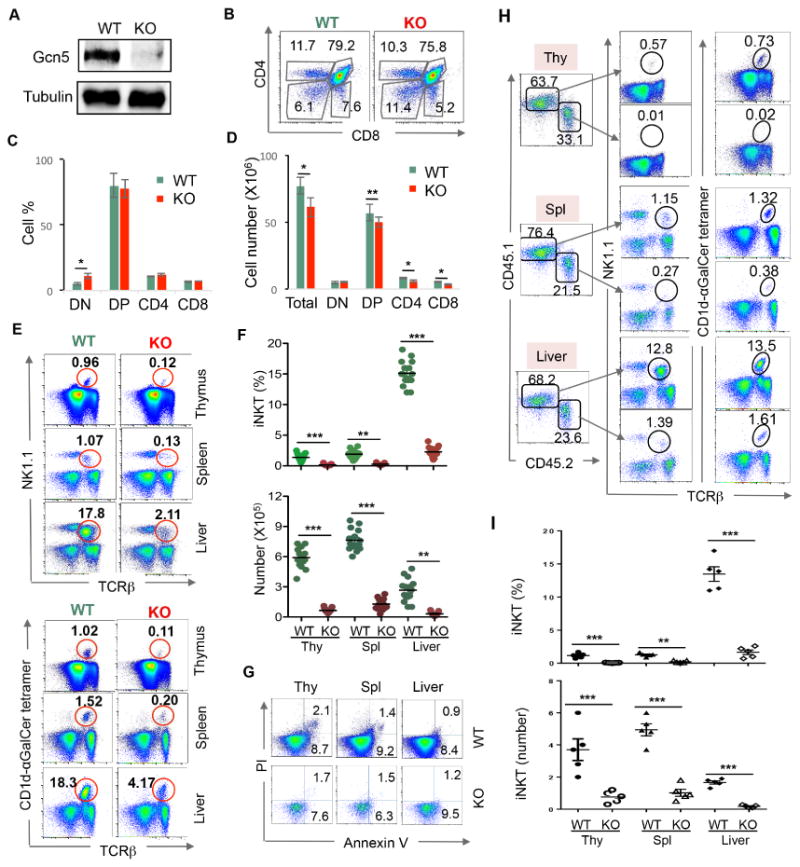
(A) Immunoblot analysis of GCN5 protein expression (top panel) in thymocytes isolated from WT and GCN5 KO mice using Tubulin as a loading control (bottom panel). (B-D) Single-cell suspensions of thymus were analyzed for the expression of CD4 and CD8. Representative images from one pair of mice are shown (B). The percentages (C) and absolute numbers (D) of 7 pairs of mice are indicated. (E-G) Single-cell suspensions of thymus and spleen, as well as purified lymphocytes from liver tissue, were collected from WT and GCN5 KO mice. Cells were labeled with anti-TCRβ and NK1.1 (E, top panels) or with CD1d-αGalCer tetramer (E, bottom panels). The percentages (top panel) and absolute numbers (bottom panel) of iNKT cells from 15 pairs of mice as analyzed by CD1d-αGalCer tetramer and TCRβ are shown (F). Gated iNKT cells were labeled with annexin V and PI, and representative images from 10 pairs of mice are shown (G). (H-J) Bone marrow cells from GCN5 KO mice and CD45.1-congenic B6/SJL mice were mixed in a 2:1 ratio and adoptively transferred into the lethally irradiated B6/SJL mice. Eight weeks after transfer, recipients were euthanized. iNKT cells in the gated CD45.1 (WT) and CD45.2 (GCN5 KO) populations from thymus (Thy), spleen (Spl), and liver were analyzed by NK1.1, CD1d-αGalCer tetramer and TCRβ (H). The percentages (I) and absolute numbers (J) of iNKT cells from five recipient mice are shown. Thy, thymus; Spl, spleen. Student's t test was used for statistical analysis. * p<0.05, ** p<0.01, and *** p<0.001.
To determine whether GCN5 regulates iNKT cell development in a cell-intrinsic manner, we generated bone marrow chimeras by reconstituting lethally irradiated CD45.1+ congenic WT recipients with a 1:1 mixture of CD45.1+ congenic WT and CD45.2+ GCN5 KO bone marrow cells. Analysis of these chimeras revealed that GCN5 KO donor bone marrow cells poorly reconstituted the iNKT cell compartment in thymus, spleen, and liver (Fig. 1H), both in frequency and absolute numbers (Fig. 1I & 1J), even in the presence of two-fold WT cells, which confirmed a cell-intrinsic defect of iNKT cell development in the absence of GCN5.
GCN5 promotes iNKT development during the maturation stage
iNKT cells originate from CD4+CD8+ double-positive thymocytes and are positively selected by CD1d expression (Chiu et al., 1999; Exley et al., 1997). However, the cell surface CD1d expression levels on the CD4+CD8+ thymocytes were comparable between WT and GCN5 KO mice (Fig. 2A). In addition, Gcn5 gene deletion appeared to have no effect on the survival of CD4+CD8+ T cells because the percentage of annexin V+ CD4+CD8+ cells were not altered by targeted Gcn5 gene deletion even after 24 hours in culture. This observation largely excluded the possibility that GCN5 promotes iNKT cell development by maintaining the survival of iNKT precursors (Fig. 2B).
Fig. 2. iNKT cell development and maturation.
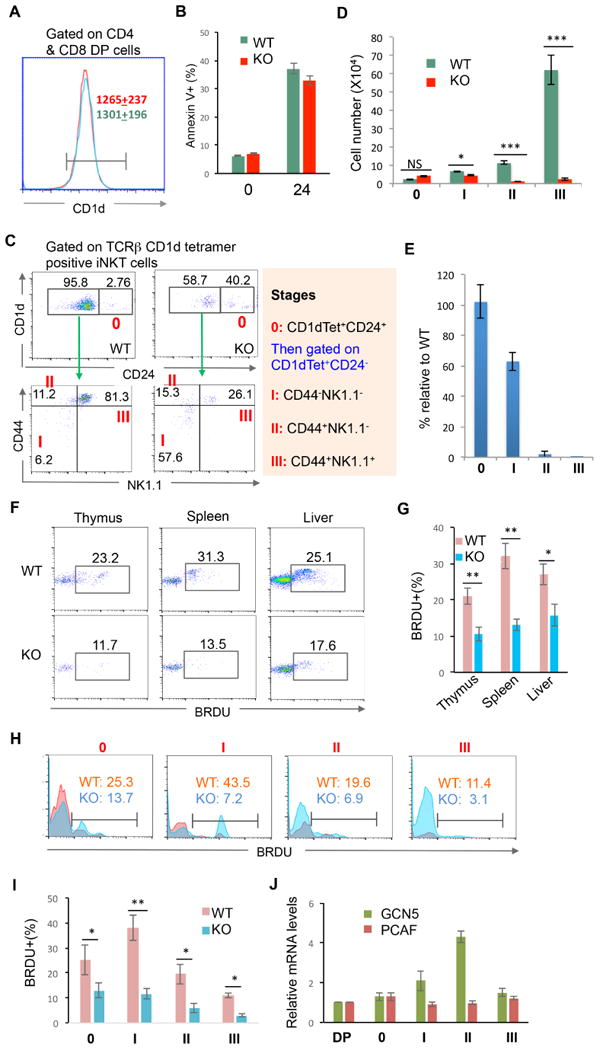
(A) CD4/CD8 double-positive cells in the thymus of WT and GCN5 KO mice were gated and expression of CD1d was analyzed by flow cytometry. The average mean fluorescence intensity (MFI) is indicated. Red, WT; Green: GCN5 KO. (B) Single-cell suspensions from the thymus of WT and GCN5 KO mice were cultured in complete media for 24 hours. Cell apoptosis of CD4/CD8 double-positive cells was analyzed by annexin V staining. The average percentages of annexin V-positive cells from five independent experiments are shown. (C-E) iNKT development in the thymus of WT and GCN5 KO mice was analyzed by their expression of CD24 (C, top panels). CD24−CD1d tetramer+ populations were further analyzed for their expression of NK1.1 and CD44 (C, bottom panels). The absolute numbers of each stage as indicated in (C) were calculated (D), and the percentages in GCN5 KO iNKT relative to WT iNKT cells from seven pairs of mice are indicated (E). (F-I) GCN5 WT and KO mice were injected with 1 mg BRDU (in 200 μl PBS) per mouse into the peritoneal cavity. 12 hour later mice were euthanized, the gated TCRβ and CD1d tetramer double positive iNKT cells were analyzed for the BRDU incorporation. Representative images (F) and data from five pairs of mice are shown (G). BRDU incorporation of iNKT cells at stages 0 to III were analyzed. The representative images (H) and data from five pairs of mice are shown (I). (J) Cells at CD4 CD8 double positive (DP) and iNKT cells at stages of 0-III were sorted, the expression levels of GCN5 and PCAF were analyzed by real-time PCR. Student's t test was used for statistical analysis. * p<0.05, ** p<0.01, and *** p<0.001.
iNKT cells undergo several well-defined developmental stages in the thymus. As shown in Fig. 2C, in contrast to the WT thymus, in which 2.76% of CD1d tetramer-positive iNKT cells were at stage 0, 40% of CD1d tetramer-positive iNKT cells were at stage 0 in the thymus of GCN5 KO mice (Fig. 2C), implying a partial developmental blockade in the transition from stage 0 to the later stages. Staining with the tetramer loading control did not detect iNKT populations from stage 0 to the later stages (Fig. S1). Despite there is a dramatic accumulation of iNKT cells at the stage 0 in thymus of Gcn5 knockout mice, their absolute number was not altered due to a more than 90% reduction in total iNKT cells (Fig. 1 & 3D). Further analysis of CD24−CD1d tetramer-positive thymic iNKT cells revealed that there was an approximate 40% reduction in the number of stage I cells and the ability of cells to enter stage II to III was largely diminished (Fig. 2D & E). These findings indicated that GCN5 function is essential for the transition from stage 0 to I and II during iNKT development.
Fig. 3. The expression levels of genes in GCN5 KO iNKT cells.
(A) TCRβ and CD1d tetramer-positive iNKT cells were sorted from the thymus of WT and GCN5 KO mice. mRNA expression levels of each indicated gene were analyzed by real-time qRT-PCR. Error bars represent the standard error of the mean of three independent experiments. (B & C) The expression of IL-2Rβ, T-bet, PLZF, and EGR2 in iNKT cells at each developmental stages (0-III) and total TCRβ and CD1d tetramer-positive iNKT cells (bottom panels) from thymus were analyzed. Representative images (B) and the average MFI (C) from five pairs of mice are shown. Error bars represent mean ± SD. Student's t test was used for statistical analysis. * p<0.05, ** p<0.01, and *** p<0.001.
To further delineate the cellular mechanisms underlying how GCN5 promotes iNKT cell development, we analyzed the in vivo iNKT cell proliferation. There are about 20-40% BRDU (5-bromo-2′-deoxyuridine)-positive iNKT cells in mice sixteen hours after BRDU injection in WT mice. In contrast, the percentages of BRDU+ proliferating iNKT cells were dramatically reduced in Gcn5 conditional KO mice (Fig. 2F & G). Further analysis indicate that the percentages of BRDU+ cells were reduced at all developmental stages in Gcn5-null iNKT cells (Fig. 2I & J), indicating that GCN5 functions are required for iNKT cell proliferation. To support this conclusion, real-time PCR analysis indicated that Gcn5 is expressed at all stages during iNKT development and its expression levels are upregulated during stages I and II. In contrast, the expression of its family member acetyltransferase Pcaf was unaltered (Fig. 2J).
GCN5 regulates the expression of genes required for iNKT cell development and maturation
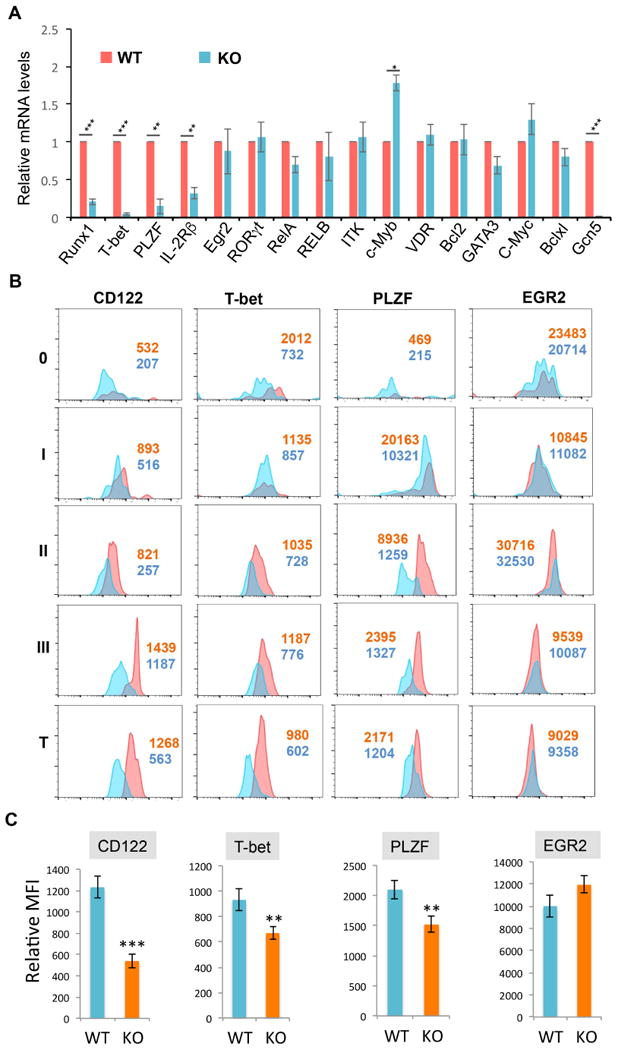
To define the molecular mechanisms GCN5 regulation of iNKT cell development, we analyzed the expression levels of genes that have been shown to be critical for iNKT cell development, maturation, and survival (Godfrey et al., 2010; Gordy et al., 2011). As shown in Fig. 3A, real-time qPCR analysis detected significantly lower expression levels of transcription factors including Runx1, PLZF and T-bet, as well as IL-2Rβ, in GCN5 KO thymic iNKT cells compared to WT iNKT cells. We also detected a modest but statistically significant higher expression level of c-Myb, a transcription factor involved in promoting early stages of iNKT cell development (Hu et al., 2010). The expression of several other transcription factors including EGR2, RORγt, NF-κB family transcription factor RelA and p50, GATA3, VDR and c-Myc, as well the Tec kinase ITK and the anti-apoptotic factors Bcl2 and Bclxl, were not different in WT and GCN5 KO iNKT cells, indicating that GCN5 specifically regulates a limited number of factors critical for iNKT development (Fig. 3A).
We then confirmed the differences in protein expression levels of PLZF, IL-2Rβ, and T-bet in WT and GCN6 KO iNKT cells by flow cytometry. Consistent with our real-time qPCR analysis, the protein expression levels of IL-2Rβ, T-bet, and PLZF, were significantly lower in GCN5 KO iNKT cells at all their developmental stages compared to WT cells. As a control, the expression levels of EGR2 in thymic iNKT cells were not altered by loss of GCN5 (Fig. 3B & C). Since the anti-Runx1 antibody did not consistently detect Runx1 expression in iNKT cells by intracellular staining, and because detection of Runx1 protein by immunoblot in GCN5 KO iNKT is challenging due to the limited number of iNKT cells in GCN5 KO mice, we could not confirm that Runx1 protein expression was lower in GCN5 KO iNKT cells. Nevertheless, our data indicate that the histone acetyltransferase GCN5 may promote iNKT cell development through regulation of the transcription factors Runx1, PLZF, and T-bet, as well as IL-2Rβ.
GCN5 functions are involved in regulating iNKT cell differentiation
Next, we analyzed the impact of GCN5 gene deletion to iNKT cell differentiation. Significant reductions in the percentages of NTK1 (from 78.6% to 42.3%) and NKT17 (from 2.6% to 0.01%) were detected in GCN5-null mice. In contrast, the percentage of NKT2 cells were increased from 16.7% to 39.7%, suggesting that GCN5 is required for NKT1 and NKT17 differentiation but loss of GCN5 functions facilitates iNKT cell differentiation toward NKT2 (Fig. 4A, top panels & 5C). To support this notion, intracellular staining of GATA3, the Th2 lineage-specific transcription factor, detected a significant increase of PLZFhiGATA3+ NKT2 cells in GCN5 KO mice (Fig. 4A, bottom panels & 5C). In addition, intracellular staining confirmed the significant reduction in PLZFlowTbet+ NKT1 cells in GCN5 KO mice (Fig. 4B, top panels & 5C). Analysis ROR-γT expression in the Tbet−PLZFhi population detected about 81% PLZFhiROR-gT− NKT2 and 15% PLZFhiROR-gT+ NKT17 in WT mice. In contrast, more than 99% of PLZFhiT-bet− populations are NKT2 cells in GCN5 KO mice, but the differentiation toward NKT17 was largely diminished (Fig. 4B, bottom panels & 5C). Consistent to the reduced percentages, the absolute numbers of NKT1 and NKT17 were also significantly reduced. Despite with a significant increase in NKT2 percentages, their absolute numbers were also decreased due to a more than 95% reduction in total NKT cell populations in GCN5 KO mice (Fig. 4D). The ratios of NKT1:NKT2:NKT17 are about 1:0.2:0.02 in WT mice (Fig. 4E) and 1:1:0 in GCN5 KO mice (Fig. 4F). These results suggest an important role of GCN5 in reprogramming iNKT cell differentiation.
Fig. 4. Analysis of iNKT differentiation in GCN5 conditional KO mice.
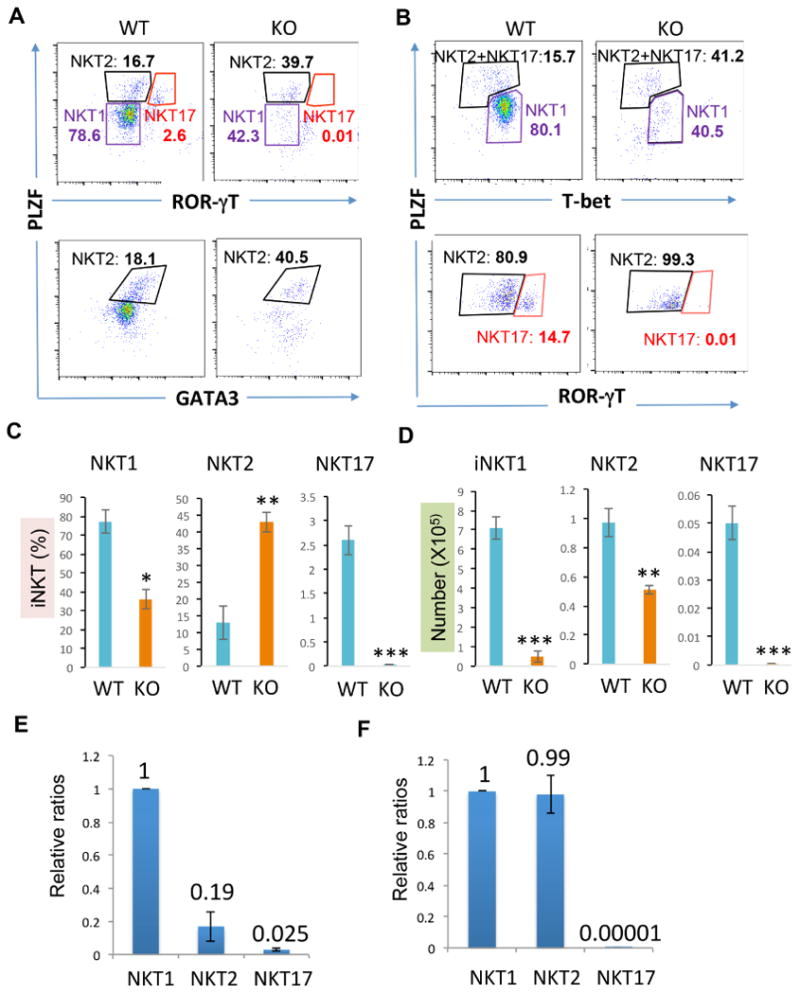
(A) TCRβ and CD1d tetramer positive iNKT cells in WT and GCN5 KO thymocytes were gated and their expression of PLZF, ROR-γT and GATA3 were determined by intracellular staining and flow cytometry. (B) The expression of PLZF, ROR-γT and T-bet in the gated TCRβ and CD1d tetramer positive iNKT cells were analyzed. (C & D) The average percentages from 6 pairs of WT and GCN5 KO mice are shown. Student's t test was used for statistical analysis. * p<0.05, ** p<0.01, and *** p<0.001. (E & F) The relative ratios of NKT2 or NKT17 to NKT1 in WT (E) and GCN5 KO (F) are indicated.
GCN5 is a lysine acetyltransferase of EGR2
Since GCN5 is an acetyltransferase, we therefore determined whether GCN5 modulates acetylation of the transcription factors involved iNKT cell development. The numbers of iNKT cells from GCN5 KO mice are extremely limited, it was technically difficult to obtain sufficient numbers of GCN5 KO iNKT cells for the study. To overcome this, we utilized an shRNA-mediated knockdown approach to suppress GCN5 expression in DN32.D3 cells, a mouse iNKT hybridoma cell line. Immunoblot analysis confirmed that the shRNA efficiently inhibited more than 90% of GCN5 protein expression in DN32.D3 cells (Fig. 5A & B), which was further validated at the mRNA level by real-time RT-qPCR (Fig. 5C). Notably, the acetylation of EGR2, a transcription factor required for the early stages of iNKT development (Lazarevic et al., 2009), but not its total protein expression levels, were dramatically reduced in GCN5 knockdown DN3.D2 cells (Fig. 5A & B), implying that GCN5 catalyzes EGR2 acetylation. In contrast, neither the acetylation nor the total protein expression levels of c-Myc, RelA, p50, or c-Myb, other transcription factors involved in iNKT development, were altered in DN32.D3 cells by GCN5 knockdown (Fig. 5A & B). While Gcn5 shRNA dramatically inhibited the mRNA expression of GCN5, it did not affect the mRNA expression of any transcription factors analyzed (Fig. 5C). These results suggest that the histone acetyltransferase GCN5 may promote iNKT cell development through catalyzing the acetylation of EGR2 to activate its transcriptional activity.
Fig. 5. GCN5 is a lysine acetyltransferase of EGR2.
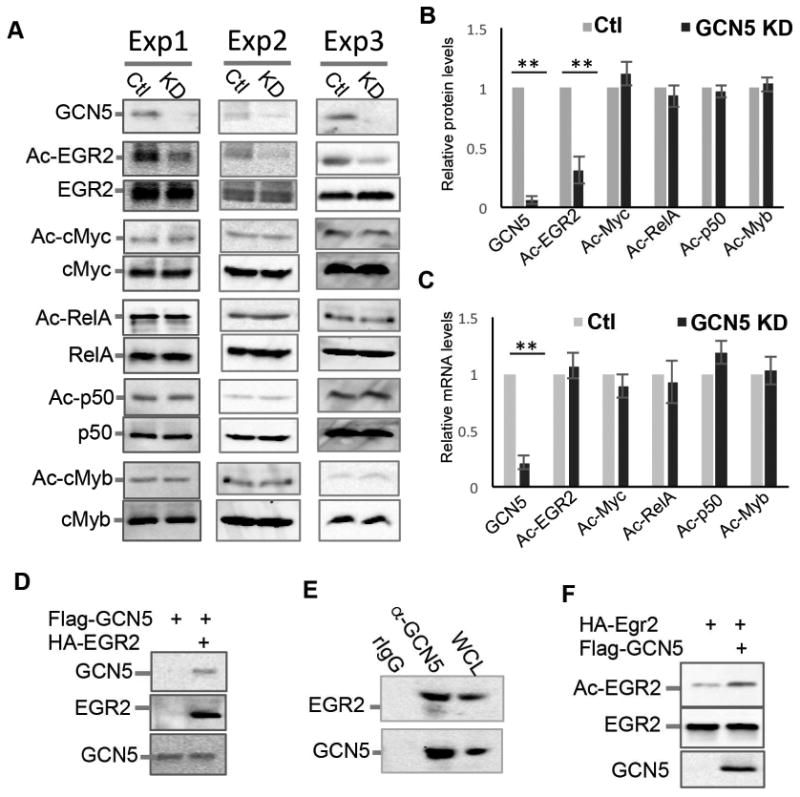
(A & B) The expression levels of GCN5 in the knockdown (KD) and WT control (Ctl) DN32.D3 cells were determined by immunoblotting (top panel). EGR2, c-Myc, RelA, p50, and c-Myb proteins in the lysates of WT and GCN5 KD iNKT cells were immunoprecipitated with the indicated antibodies, followed by immunoblotting with an anti-acetyllysine specific antibody to detect acetylated proteins. Images from three independent experiments are shown (A). The band intensities of the acetylated forms of each protein in (A) were quantified and the acetylated protein levels were normalized to total protein levels (B). (C) mRNA expression levels of each indicated gene in the WT and GCN5 KD iNKT cells were analyzed by real-time qPCR. Error bars represent the standard error of the mean of three independent experiments. Student's t test was used for statistical analysis. ** p<0.01. (D) DN32.D3 cells were transiently transfected with Flag-GCN5 and HA-EGR2 expression plasmids. The interaction of GCN5 with EGR2 was determined by immunoprecipitation and western blotting. (E) Endogenous GCN5 protein in the lysate of DN32.D3 cells was immunoprecipitated with anti-GCN5 antibody but not control normal rabbit IgG (rIgG) and the interaction of EGR2 with GCN5 was determined by immunoblotting with anti-EGR2 (top panel). The same membrane was reprobed with anti-GCN5 (bottom panel). (F) HA-EGR2 was co-transfected with or without Flag-GCN5 into HEK293 cells. EGR2 protein in the transfected cells was immunoprecipitated by anti-HA antibody and the acetylated levels of EGR2 were determined by immunoblotting with anti-acetyl-lysine antibody (top panel). The expression levels of EGR2 and GCN5 were determined as controls.
To further investigate the notion that GCN5 is a lysine acetyltransferase of EGR2, we detected the interaction of Flag-tagged GCN5 with HA-tagged EGR2 in transiently transfected DN32.D3 cells by coimmunoprecipitation and immunoblotting (Fig. 5D). The interaction between endogenous GCN5 and EGR2 in iNKT cells was confirmed with the detection of EGR2 in immunoprecipitates using an anti-GCN5 antibody but not normal rabbit IgG (Fig. 5E). Ectopic GCN5 expression significantly enhanced EGR2 acetylation without affecting total protein expression levels (Fig. 5F). Together with the finding that GCN5 knockdown inhibited EGR2 acetylation, these results indicate that GCN5 is an acetyltransferase for EGR2 in iNKT cells.
GCN5 regulates the expression of genes driving iNKT development through EGR2
Further analysis of the gene expression profiles in the GCN5 knockdown DN32.D3 iNKT cells detected a similar gene expression pattern as that observed in the primary GCN5 KO iNKT cells (Fig. 3A), with a significant reduction in Runx1, T-bet, PLZF, and IL-2Rβ expression (Fig.6A), confirming that GCN5 is a positive regulator of these critical genes in iNKT development in a cell-intrinsic manner. To elucidate whether GCN5 is recruited to the promoters of Runx1, T-bet, PLZF, and IL-2Rβ to regulate their expression, we performed a ChIP analysis with an anti-GCN5 antibody. Indeed, we detected GCN5 binding to the promoters of Runx1, T-bet, PLZF, and IL-2Rβ in DN32.D3 iNKT cells (Fig.6B). As expected, GCN5 knockdown largely diminished its binding to these promoter regions. As a control, GCN5 binding to the Bclxl promoter was not detectable in iNKT cells (Fig.6B), which is consistent to our observation that GCN5 was not involved in regulating Bclxl expression (Figs. 4A & 6A). These results indicate that GCN5 is a transcriptional co-activator for Runx1, T-bet, PLZF, and IL-2Rβ in iNKT cells.
Fig. 6. GCN5 regulates gene expression in iNKT cells through EGR2.
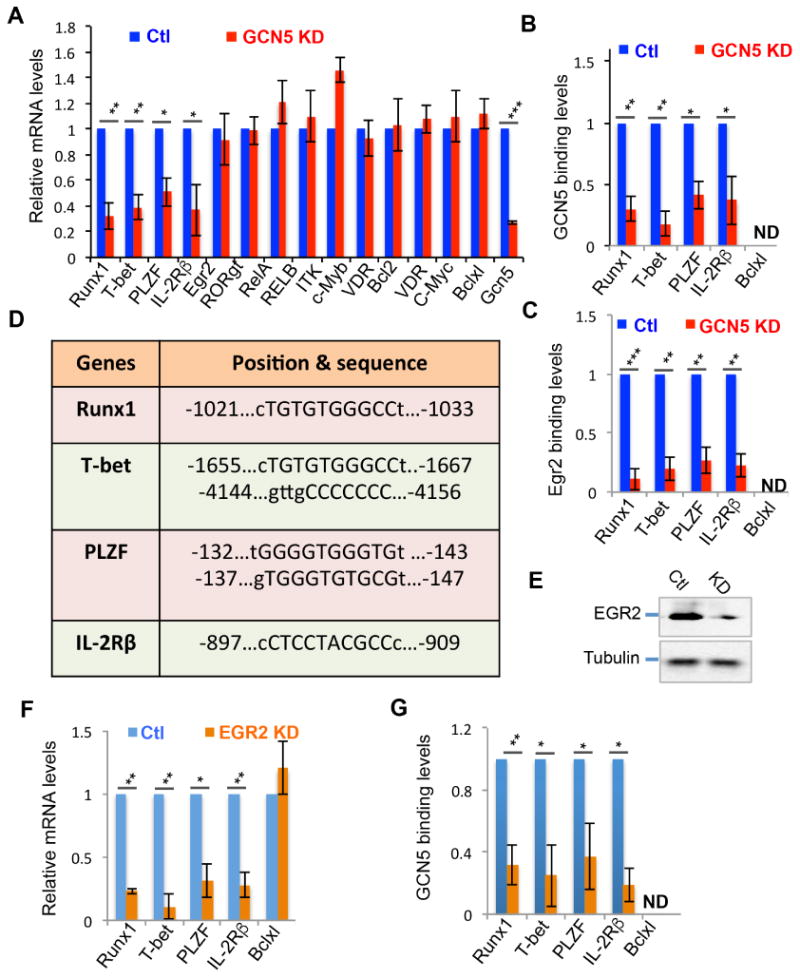
(A) mRNA expression levels in WT (Ctl) and GCN5 KD iNKT cells were determined by real-time qPCR. (B & C) The binding of either GCN5 (B) or EGR2 (C) on the promoter regions of the indicated genes in WT and GCN5 KD cells was analyzed by ChIP. (D) The conserved EGR2 binding sites in the promoter regions of mouse and human Runx1, T-bet, PLZF, and IL-2Rβ. (E) EGR2 KD iNKT cells were generated as described in Fig. 4A. The expression levels of EGR2 were confirmed by immunoblotting. (F) mRNA expression levels of each indicated gene in WT and EGR2 KD DN32.D3 iNKT cells were analyzed by real-time qPCR. (G) GCN5 binding to the promoter of each indicated gene was determined by ChIP with anti-GCN5 antibody. Error bars represent standard error of the mean from five independent experiments. Student's t test was used for statistical analysis. * p<0.05, ** p<0.01, and *** p<0.001.
Because GCN5 catalyzed EGR2 acetylation in iNKT cells (Fig. 5), we speculated whether GCN5 promotes the expression of Runx1, T-bet, PLZF, and IL-2Rβ through EGR2 acetylation. Analysis of the promoter sequences of mouse and human Runx1, T-bet, PLZF, and IL-2Rβ revealed conserved EGR2 binding sites (Fig.6D), suggesting that the transcription factor EGR2 may be involved in regulating expression of these genes in iNKT cells. Indeed, ChIP analysis detected the binding of EGR2 to the promoter regions of Runx1, T-bet, PLZF, and IL-2Rβ, but not Bclxl (Fig.6C). GCN5 knockdown suppressed EGR2 binding to the promoters of Runx1, T-bet, PLZF, and IL-2Rβ, implying that GCN5 promotes the transcriptional activity of EGR2 in regulating the expression of Runx1, T-bet, PLZF, and IL-2Rβ.
To further validate EGR2 as a transcription factor in regulating Runx1, T-bet, PLZF and IL-2Rβ expression in iNKT cells, we asked whether EGR2 knockdown resulted in a similar suppression in the expression of these genes as seen in iNKT cells with GCN5 knockdown. An Egr2-specific shRNA inhibited approximately 90% of EGR2 protein expression in iNKT cells (Fig.6E). Importantly, EGR2 knockdown resulted in a significant reduction in the expression of Runx1, T-bet, PLZF and IL-2Rβ without affecting Bclxl mRNA transcription, clearly demonstrating that EGR2 is a transcription factor involved in the expression of Runx1, T-bet, PLZF, and IL-2Rβ genes (Fig.6F). Of note, EGR2 knockdown largely diminished the recruitment of GCN5 onto the promoter regions of Runx1, T-bet, PLZF, and IL-2Rβ (Fig.6G), indicating that GCN5 is recruited onto the promoters of these genes through EGR2.
Pharmacological suppression inhibits EGR2 acetylation and transcriptional activity in mouse primary iNKT cells
To further investigate the physiological roles of GCN5 in iNKT cells, we first determined the interaction of GCN5 with EGR2 in mouse primary iNKT cells. Similar to our observation in DN32.D3 iNKT cells, GCN5 interaction with EGR2 was detected in mouse primary iNKT cells (Fig. 7A). However, with a more than 95% reduction in the INKT cell numbers in GCN5 conditional KO mice, it is technically challenging to obtain sufficient iNKT cells for the co-IP and western blotting analysis. To overcome this difficulty, we utilized a GCN5-specific inhibitor CPTH2 (Carradori et al., 2014) and demonstrated that pharmacological GCN5 suppression significantly inhibited EGR2 acetylation in mouse primary iNKT cells (Fig.7B & C). It has been shown that GCN5 regulates gene expression through catalyzing acetylation of histones (Jin et al., 2011; Kong et al., 2011). However, treatment of iNKT cells with GCN5 inhibitor CPTH2 did not alter the histone H3 acetylation levels (Fig.7B). Consistent with this observation, flow cytometry analysis did not detect any changes in total histone H3 acetylation in iNKT cells from GCN5 KO mice (Fig.7D & E). These results suggest that GCN5 is a specific acetyltransferase for EGR2 in iNKT cells. To support this notion, pharmacological suppression of GCN5 significantly inhibited EGR2 promoter binding activity and the transcription of its EGR2 target genes (Fig.7F).
Fig. 7. The effects of pharmacological GCN5 suppression on EGR2 transcriptional activity in mouse primary iNKT cells.
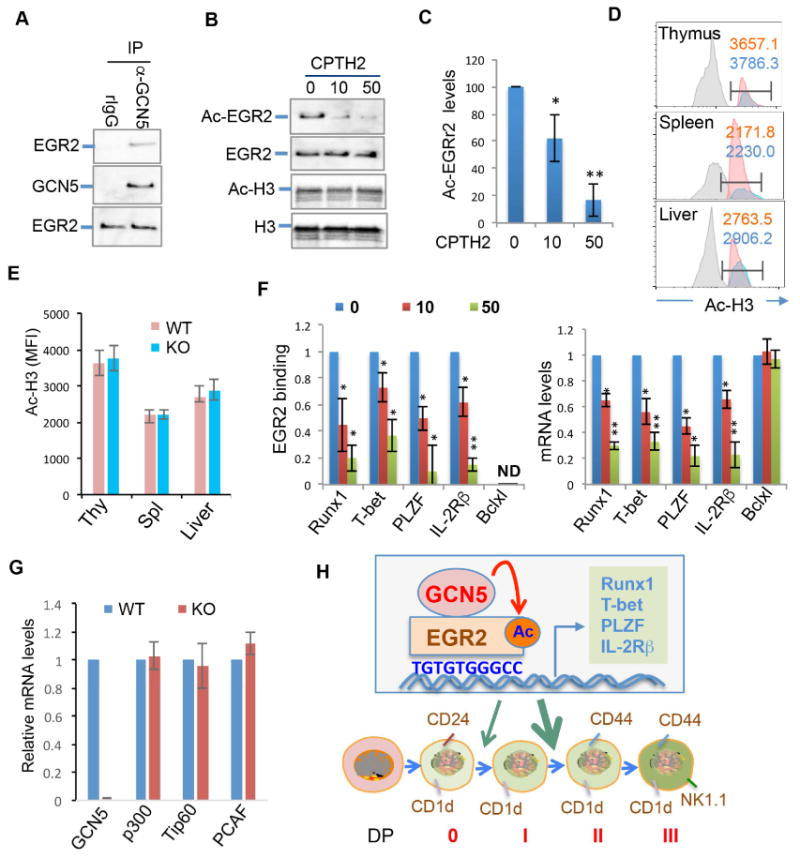
(A) iNKT cells from the thymus and spleens of WT mice were isolated using iNKT purification kit. (A) The interaction of GCN5 with EGR2 was analyzed. (B & C) Purified iNKT cells were treated with CPTH2 at each indicated concentrations (μM) for 12 hours and lysed. The acetylation levels of EGR2 (B, top two panels) and histone H3 (B, bottom two panels) were determined as in indicated in figure 4A. The acetylation levels of EGR2 were normalized to total EGR2 protein levels and data from three independent experiments are shown (C). (D & E) Single cell suspensions from the thymus, spleen and liver of WT and GCN5 KO mice were stained with TCRβ, CD1d tetramer and intra-cellular staining with anti-acetyl-H3 followed by FITC-conjugated anti-rabbit IgG Abs. The levels of acetylated H3 in gated iNKT cells were analyzed by flow cytometry (D) and data from three pairs of mice are shown (E). (F) Purified iNKT cells from wildtype mice were treated with CPTH2 and the EGR2 promoter binding (top panel) and mRNA expression levels of each indicated genes were analyzed. (G) The expression levels of p300, Tip60 and PCAF in purified WT and iNKT cells were determined by real-time RT-PCR. (H) A proposed model for GCN5-mediated EGR2 acetylation to regulate genes critical to iNKT development. Student's t test was used for statistical analysis. * p<0.05, ** p<0.01, and *** p<0.001.
In addition to GCN5, there are several acetyltransferases expressed in T lymphocytes including p300, Tip60 and PCAF. However, GCN5 deletion does not appear to impair iNKT development through altering their expression because the expression levels of p300, Tip60 and PCAF were unaltered in iNKT cells by GCN5 gene deletion (Fig.7G). Collectively, our data indicate that GCN5-mediated EGR2 acetylation regulates iNKT development and maturation through the regulation of Runx1, T-bet, PLZF, and IL-2Rβ transcription (Fig.7H).
Discussion
Our current study defined a previously unappreciated molecular mechanism in regulating iNKT development and maturation. We found that the histone acetyltransferase GCN5 catalyzes EGR2 lysine acetylation to regulate the transcription of genes critical for iNKT cell development including Runx1, Tbet, PLZF, and IL-2Rβ in regulating iNKT cell immunity (Fig.7G). The severe developmental block of the iNKT cell lineage before terminal maturation seen in mice with conditional deletion of the Gcn5 gene resembles the phenotypes of several strains of mice that lack the transcription factors involved in iNKT development, including EGR2 (Lazarevic et al., 2009), T-bet (Townsend et al., 2004; Yokoyama, 2004), Runx1 (Egawa et al., 2005), PLZF (Savage et al., 2008), c-Myb (Hu et al., 2010), and some of the NF-κB proteins (Beraza et al., 2009; Elewaut et al., 2003; Schmidt-Supprian et al., 2004; Sivakumar et al., 2003; Vallabhapurapu et al., 2008; Yue et al., 2005). Our real-time RT-qPCR analysis detected significantly lower mRNA levels of several these transcription factors, as well as the cell surface receptor IL-2Rβ (Torigoe et al., 1992; Voss et al., 1992), in GCN5 KO mice and GCN5 knockdown iNKT cells, indicating that GCN5 regulates iNKT cell development and maturation through promoting expression of the of key transcription factors involved. This critical function of GCN5 appears to be achieved through catalyzing EGR2 acetylation, as EGR2 expression and acetylation were required for Runx1, T-bet, PLZF, and IL-2Rβ gene expression in iNKT cells. Our real-time PCR analysis detected a modest but statistically significant higher level of c-Myb mRNA in GCN5 KO iNKT cells compared to WT cells, but immunoblotting showed no change in c-Myb protein levels. Further studies are needed to study the functional consequences as well as the underlying molecular mechanisms of GCN5-mediated suppression of c-Myb mRNA, but not protein expression.
As a lysine acetyltransferase, GCN5 achieves its physiological functions through directly catalyzing the acetylation of either histones or transcription factors (Wang and Dent, 2014). GCN5 knockdown in iNKT hybridomas revealed that EGR2 acetylation was largely diminished by GCN5 suppression. Notably, a previous study found a similar iNKT developmental defect in mice with EGR2 deficiency, but not with EGR1 or EGR3 deficiency (Lazarevic et al., 2009), further supporting the notion that GCN5 controls iNKT cell development specifically through EGR2 acetylation. Acetylation regulates transcription factors through multiple molecular mechanisms including modifying subcellular localization, protein stability, interaction with transcriptional co-activators or co-inhibitors or DNA-binding affinity (Bannister and Miska, 2000). GCN5 has been shown to function as an E3 ubiquitin ligase that regulates the protein stability and transcriptional activity of NF-κB (Mao et al., 2009). However, we found that suppression of GCN5 did not alter the protein expression levels of EGR2 or NF-κB in iNKT cells, excluding the possibility that GCN5 regulates EGR2 function through its E3 ubiquitin ligase activity. Instead, suppression of GCN5 largely inhibited EGR2 acetylation in iNKT cells. We further demonstrated that GCN5-mediated EGR2 acetylation is likely required for EGR2 binding to the promoter of EGR2 target genes, because GCN5 knockdown inhibited EGR2 binding to the promoters of Runx1, T-bet, PLZF, and IL-2Rβ in iNKT cells.
In summary, our study identified a surprisingly lineage-specific function of the lysine acetyltransferase GCN5, promoting EGR2 transcriptional activity during iNKT development. Specific GCN5 inhibitors have been reported recently (Chimenti et al., 2009; Secci et al., 2014) that may have therapeutic potential in the treatment of iNKT-mediated immune disorders, including autoimmune diseases.
Experimental Procedures
Mice
Gcn5 floxed mice were used as described previously (Chen et al., 2012; Lin et al., 2008). Mice were backcrossed onto the C57/BL6 genetic background for 7 generations. T cell-specific Gcn5-null mice (GCN5 KO) were then generated by breeding Gcn5 floxed mice with Lck-Cre transgenic mice. LCK-Cre transgenic (stick # 003802) mice and CD45.1 congenic B6/SJL mice (stock # 002014) were purchased from Jackson laboratory. Mice at the age of 8 to 12 weeks, both male and females were used for the study. All mice used in this study were housed at the Northwestern University mouse facility under pathogen-free conditions according to institutional guidelines and animal study proposals approved by the Institutional Animal Care and Use Committee. The IACUC protocol number associated to this study is IS00002388.
Cells, antibodies, and plasmids
Mouse iNKT hybridoma DN32.D3 cells were cultivated in RPMI1640 with 10% FBS. Specific antibodies against GCN5, EGR2, Flag, and HA were from Santa Cruz (Santa Cruz, CA), and against acetylated lysine were from Cell Signaling (Cambridge, MA). Fluorescenceconjugated antibodies used for cell surface marker analysis and intracellular staining including CD3, CD4, CD8, NK1.1, CD24, CD45.1, CD45.2, CD44, IL-2Rβ/CD122, T-bet, PLZF, EGR2, and antibodies against each specific isotype of mouse immunoglobulin are listed in Table S1. GCN5 expression plasmid was purchased from Addgene (Cambridge, MA) and EGR2 expression plasmids were used as reported previously (Chen et al., 2009).
Flow cytometry analysis
Single cell suspensions of thymus or spleen were used for the analysis of the cell surface markers including CD3, TCRβ, NK1.1, CD24, and CD44 by labeling with fluorescence-labeled antibodies specific to each cell surface marker, followed by flow cytometry analysis. CD1d/PBS57 tetramers were obtained from the NIH tetramer facility and used for identification of iNKT cells as reported previously (Zhao et al., 2014). For the analysis of transcription factors including T-bet, PLZF, and EGR2 in primary iNKT cells, intracellular staining was performed using a Biolegend intracellular staining kit (San Diego, CA). For the analysis of iNKT cells from liver, mouse iver tissues were homogenized and filtered, and the resident lymphocytes were isolated by Percoll purification as reported (Zhang et al., 2009). All the antibodies used for flow cytometry analysis are listed in the Table S1.
Bone marrow chimera and adoptive transfer
Bone marrow cells from wild type (WT; CD45.1 from SJL mice) and Gcn5 conditional knockout (CD45.2) mice were mixed at a 1:1 ratio. A total of 5 × 10⁶ mixed cells were adoptively transferred into lethally irradiated SJL mice by intravenous injection. Ten weeks after adoptive transfer, recipient mice were euthanized, and the iNKT cells in thymus, spleen, and liver were analyzed as described above.
Real-time quantitative PCR analysis
Total RNA from the sorted mouse primary iNKT cells and DN32.D3 cells were extracted using Trizol (Invitrogen, Carlsbad, CA). mRNAs were reverse-transcribed using a cDNA synthesis kit purchased from Invitrogen (Carlsbad, CA). The expression levels of genes were analyzed by real-time qPCR. All primers used in the study are listed in the Table S2.
iNKT cell isolation, treatment and in vivo proliferation assay
iNKT cells from the spleen of WT mice were purified using the iNKT cell isolation kit purchased from Miltenyi Biotec (130-096-503) following the manufacture's instruction. Purified iNKT cells were treated with GCN5 inhibitor CPTH2 (Sigma, Catalogue #, C9873) for 12 hours at 0-50 μM concentrations. EGR2 and H3 acetylation, EGR2 promoter binding activity and mRNA expression in the CPTH2 treated cells were analyzed.
For the in vivo iNKT proliferation, WT and GCN5 KO mice were injected with 1 mg 5-bromo-2′-deoxyuridine (BRDU, in 200 μl PBS) per mouse into the peritoneal cavity. 12 hour later mice were euthanized, iNKT cell proliferation were analyzed by intracellular staining of BRDU incorporation with FITC-conjugated anti-BRDU Abs.
Co-immunoprecipitation and immunoblot analysis
Experiments were performed as reported previously (Lin et al., 2012). Briefly, transient transfection of DN32.D3 cells was performed using Lipofectamine 2000 (Invitrogen, Carlsbad, CA). Two days after transfection, cells were collected and lysed in Nonidet P-40 lysis buffer (1% Nonidet P-40, 20 mM Tris-HCl, pH 7.5, 150 mM NaCl, 5 mM EDTA, and freshly added protease inhibitor cocktail). The cell lysates were incubated with antibodies (1 μg) for 2 h on ice, followed by the addition of 30 μL of fast-flow protein G-Sepharose beads (GE Healthcare Bioscience, Uppsala, Sweden) overnight at 4°C. Immunoprecipitates were washed and separated by 8% or 10% SDS-PAGE and electro-transferred onto nitrocellulose membranes (0.45 μm; Bio-Rad). Membranes were probed with the indicated primary antibodies, followed by horseradish peroxidase-conjugated secondary antibodies. Membranes were then washed and visualized with an enhanced chemiluminescence detection system (Bio-Rad, Hercules, CA, USA). Antibodies used in the study are listed in the supplemental Table 3.
Chromatin immunoprecipitation (ChIP)
DN32.D3 cells were cross-linked with 10% formalin and subjected to ChIP using the Chromatin Immunoprecipitation Assay Kit (Millipore) as reported previously (Kong et al., 2015). In brief, 2 × 10⁶ cells were lysed in SDS lysis buffer. Cell lysates were sonicated and 3% of each sample was used to determine the total amount of target DNA. The remaining cell lysate was diluted in ChIP dilution buffer. Immunoprecipitation was performed with each of the indicated antibodies (3 μg) at 4°C overnight. Immune complexes were then mixed with a salmon sperm DNA/protein agarose 50% slurry at 4°C for 1 h. After immunoprecipitates were washed sequentially with low salt buffer, high salt buffer, LiCl wash buffer, and Tris EDTA, DNA-protein complexes were eluted with elution buffer and cross-linking was reversed. Genomic DNA was extracted using phenol/chloroform and ethanol-precipitated DNA was resuspended in Tris EDTA. qPCR was then performed with specific primers. All primers and the antibodies used for ChIP are listed in the supplemental Table 2 and 3, respectively.
Statistic analysis
For most ex vivo analysis, both males and females, gender-matched littermate controls were used. In the case of non-littermate controls, age and gender-matched mice were used. At least five mice per group for the FACS analysis were used. Data are shown as means and standard deviations and a p<0.05 is considered as statistical significant. Unpaired student t test was used for the statistical analysis. All analyses was performed with the SPSS 12.0 software package (SPSS Inc., Chicago, IL).
Supplementary Material
Highlights.
GCN5 controls iNKT cell development in a cell-intrinsic manner.
GCN5 is a specific lysine acetyltransferase of EGR2 in iNKT cells.
GCN5-mediated acetylation is required for EGR2 transcriptional activity.
GCN5 inhibition downregulates EGR2 target genes required for iNKT development.
Acknowledgments
We thank Fang lab members for critical reading of the manuscript and constructive suggestions during our research. This work was supported by National Institutes of Health (NIH) R01 grants (AI079056, AI108634 and AR006634) to D.F.
Footnotes
Author contributions: YW, CY, BG, YX, YZ, YW, QK and FZ performed the experiments and analyzed the data. SYRD contributed critical reagent and in experimental design. JW, HBL, XX, CRW and DF designed the study, analyzed the data, and wrote the manuscript.
Disclosure of Conflicts of Interest: The authors declare no competing financial interests
Publisher's Disclaimer: This is a PDF file of an unedited manuscript that has been accepted for publication. As a service to our customers we are providing this early version of the manuscript. The manuscript will undergo copyediting, typesetting, and review of the resulting proof before it is published in its final citable form. Please note that during the production process errors may be discovered which could affect the content, and all legal disclaimers that apply to the journal pertain.
References
- Bannister AJ, Miska EA. Regulation of gene expression by transcription factor acetylation. Cell Mol Life Sci. 2000;57:1184–1192. doi: 10.1007/PL00000758. [DOI] [PMC free article] [PubMed] [Google Scholar]
- Benlagha K, Wei DG, Veiga J, Teyton L, Bendelac A. Characterization of the early stages of thymic NKT cell development. The Journal of experimental medicine. 2005;202:485–492. doi: 10.1084/jem.20050456. [DOI] [PMC free article] [PubMed] [Google Scholar]
- Beraza N, Malato Y, Sander LE, Al-Masaoudi M, Freimuth J, Riethmacher D, Gores GJ, Roskams T, Liedtke C, Trautwein C. Hepatocyte-specific NEMO deletion promotes NK/NKT cell- and TRAIL-dependent liver damage. The Journal of experimental medicine. 2009;206:1727–1737. doi: 10.1084/jem.20082152. [DOI] [PMC free article] [PubMed] [Google Scholar]
- Bezbradica JS, Hill T, Stanic AK, Van Kaer L, Joyce S. Commitment toward the natural T (iNKT) cell lineage occurs at the CD4+8+ stage of thymic ontogeny. Proceedings of the National Academy of Sciences of the United States of America. 2005;102:5114–5119. doi: 10.1073/pnas.0408449102. [DOI] [PMC free article] [PubMed] [Google Scholar]
- Brownell JE, Zhou J, Ranalli T, Kobayashi R, Edmondson DG, Roth SY, Allis CD. Tetrahymena histone acetyltransferase A: a homolog to yeast Gcn5p linking histone acetylation to gene activation. Cell. 1996;84:843–851. doi: 10.1016/s0092-8674(00)81063-6. [DOI] [PubMed] [Google Scholar]
- Cantorna MT. Mechanisms underlying the effect of vitamin D on the immune system. Proc Nutr Soc. 2010;69:286–289. doi: 10.1017/S0029665110001722. [DOI] [PMC free article] [PubMed] [Google Scholar]
- Carradori S, Rotili D, De Monte C, Lenoci A, D'Ascenzio M, Rodriguez V, Filetici P, Miceli M, Nebbioso A, Altucci L, et al. Evaluation of a large library of (thiazol-2-yl)hydrazones and analogues as histone acetyltransferase inhibitors: enzyme and cellular studies. Eur J Med Chem. 2014;80:569–578. doi: 10.1016/j.ejmech.2014.04.042. [DOI] [PubMed] [Google Scholar]
- Chen A, Gao B, Zhang J, McEwen T, Ye SQ, Zhang D, Fang D. The HECT-type E3 ubiquitin ligase AIP2 inhibits activation-induced T-cell death by catalyzing EGR2 ubiquitination. Molecular and cellular biology. 2009;29:5348–5356. doi: 10.1128/MCB.00407-09. [DOI] [PMC free article] [PubMed] [Google Scholar]
- Chen YC, Gatchel JR, Lewis RW, Mao CA, Grant PA, Zoghbi HY, Dent SY. Gcn5 loss-of-function accelerates cerebellar and retinal degeneration in a SCA7 mouse model. Human molecular genetics. 2012;21:394–405. doi: 10.1093/hmg/ddr474. [DOI] [PMC free article] [PubMed] [Google Scholar]
- Chimenti F, Bizzarri B, Maccioni E, Secci D, Bolasco A, Chimenti P, Fioravanti R, Granese A, Carradori S, Tosi F, et al. A novel histone acetyltransferase inhibitor modulating Gcn5 network: cyclopentylidene-[4-(4′-chlorophenyl)thiazol-2-yl)hydrazone. J Med Chem. 2009;52:530–536. doi: 10.1021/jm800885d. [DOI] [PubMed] [Google Scholar]
- Chiu YH, Jayawardena J, Weiss A, Lee D, Park SH, Dautry-Varsat A, Bendelac A. Distinct subsets of CD1d-restricted T cells recognize self-antigens loaded in different cellular compartments. The Journal of experimental medicine. 1999;189:103–110. doi: 10.1084/jem.189.1.103. [DOI] [PMC free article] [PubMed] [Google Scholar]
- Das R, Sant'Angelo DB, Nichols KE. Transcriptional control of invariant NKT cell development. Immunological reviews. 2010;238:195–215. doi: 10.1111/j.1600-065X.2010.00962.x. [DOI] [PMC free article] [PubMed] [Google Scholar]
- Egawa T, Eberl G, Taniuchi I, Benlagha K, Geissmann F, Hennighausen L, Bendelac A, Littman DR. Genetic evidence supporting selection of the Valpha14i NKT cell lineage from double-positive thymocyte precursors. Immunity. 2005;22:705–716. doi: 10.1016/j.immuni.2005.03.011. [DOI] [PubMed] [Google Scholar]
- Elewaut D, Shaikh RB, Hammond KJ, De Winter H, Leishman AJ, Sidobre S, Turovskaya O, Prigozy TI, Ma L, Banks TA, et al. NIK-dependent RelB activation defines a unique signaling pathway for the development of V alpha 14i NKT cells. The Journal of experimental medicine. 2003;197:1623–1633. doi: 10.1084/jem.20030141. [DOI] [PMC free article] [PubMed] [Google Scholar]
- Engel I, Zhao M, Kappes D, Taniuchi I, Kronenberg M. The transcription factor Th-POK negatively regulates Th17 differentiation in Valpha14i NKT cells. Blood. 2012;120:4524–4532. doi: 10.1182/blood-2012-01-406280. [DOI] [PMC free article] [PubMed] [Google Scholar]
- Exley M, Garcia J, Balk SP, Porcelli S. Requirements for CD1d recognition by human invariant Valpha24+ CD4-CD8- T cells. The Journal of experimental medicine. 1997;186:109–120. doi: 10.1084/jem.186.1.109. [DOI] [PMC free article] [PubMed] [Google Scholar]
- Godfrey DI, Stankovic S, Baxter AG. Developing NKT cells need their calcium. Nature immunology. 2009;10:231–233. doi: 10.1038/ni0309-231. [DOI] [PubMed] [Google Scholar]
- Godfrey DI, Stankovic S, Baxter AG. Raising the NKT cell family. Nature immunology. 2010;11:197–206. doi: 10.1038/ni.1841. [DOI] [PubMed] [Google Scholar]
- Gordy LE, Bezbradica JS, Flyak AI, Spencer CT, Dunkle A, Sun J, Stanic AK, Boothby MR, He YW, Zhao Z, et al. IL-15 regulates homeostasis and terminal maturation of NKT cells. Journal of immunology. 2011;187:6335–6345. doi: 10.4049/jimmunol.1003965. [DOI] [PMC free article] [PubMed] [Google Scholar]
- Goswami R, Kaplan MH. Gcn5 is required for PU.1-dependent IL-9 induction in Th9 cells. Journal of immunology. 2012;189:3026–3033. doi: 10.4049/jimmunol.1201496. [DOI] [PMC free article] [PubMed] [Google Scholar]
- Hennet T, Hagen FK, Tabak LA, Marth JD. T-cell-specific deletion of a polypeptide N-acetylgalactosaminyl-transferase gene by site-directed recombination. Proceedings of the National Academy of Sciences of the United States of America. 1995;92:12070–12074. doi: 10.1073/pnas.92.26.12070. [DOI] [PMC free article] [PubMed] [Google Scholar]
- Hu T, Simmons A, Yuan J, Bender TP, Alberola-Ila J. The transcription factor c-Myb primes CD4+CD8+ immature thymocytes for selection into the iNKT lineage. Nature immunology. 2010;11:435–441. doi: 10.1038/ni.1865. [DOI] [PMC free article] [PubMed] [Google Scholar]
- Jin Q, Yu LR, Wang L, Zhang Z, Kasper LH, Lee JE, Wang C, Brindle PK, Dent SY, Ge K. Distinct roles of GCN5/PCAF-mediated H3K9ac and CBP/p300-mediated H3K18/27ac in nuclear receptor transactivation. The EMBO journal. 2011;30:249–262. doi: 10.1038/emboj.2010.318. [DOI] [PMC free article] [PubMed] [Google Scholar]
- Jin Q, Zhuang L, Lai B, Wang C, Li W, Dolan B, Lu Y, Wang Z, Zhao K, Peng W, et al. Gcn5 and PCAF negatively regulate interferon-beta production through HAT-independent inhibition of TBK1. EMBO reports. 2014;15:1192–1201. doi: 10.15252/embr.201438990. [DOI] [PMC free article] [PubMed] [Google Scholar]
- Kadowaki N, Antonenko S, Ho S, Rissoan MC, Soumelis V, Porcelli SA, Lanier LL, Liu YJ. Distinct cytokine profiles of neonatal natural killer T cells after expansion with subsets of dendritic cells. The Journal of experimental medicine. 2001;193:1221–1226. doi: 10.1084/jem.193.10.1221. [DOI] [PMC free article] [PubMed] [Google Scholar]
- Kim EY, Lynch L, Brennan PJ, Cohen NR, Brenner MB. The transcriptional programs of iNKT cells. Semin Immunol. 2015;27:26–32. doi: 10.1016/j.smim.2015.02.005. [DOI] [PMC free article] [PubMed] [Google Scholar]
- Kong S, Dong H, Song J, Thiruppathi M, Prabhakar BS, Qiu Q, Lin Z, Chini E, Zhang B, Fang D. Deleted in Breast Cancer 1 Suppresses B Cell Activation through RelB and Is Regulated by IKKalpha Phosphorylation. Journal of immunology. 2015;195:3685–3693. doi: 10.4049/jimmunol.1500713. [DOI] [PMC free article] [PubMed] [Google Scholar]
- Kong S, Kim SJ, Sandal B, Lee SM, Gao B, Zhang DD, Fang D. The type III histone deacetylase Sirt1 protein suppresses p300-mediated histone H3 lysine 56 acetylation at Bclaf1 promoter to inhibit T cell activation. The Journal of biological chemistry. 2011;286:16967–16975. doi: 10.1074/jbc.M111.218206. [DOI] [PMC free article] [PubMed] [Google Scholar]
- Koutelou E, Hirsch CL, Dent SY. Multiple faces of the SAGA complex. Curr Opin Cell Biol. 2010;22:374–382. doi: 10.1016/j.ceb.2010.03.005. [DOI] [PMC free article] [PubMed] [Google Scholar]
- Lazarevic V, Zullo AJ, Schweitzer MN, Staton TL, Gallo EM, Crabtree GR, Glimcher LH. The gene encoding early growth response 2, a target of the transcription factor NFAT, is required for the development and maturation of natural killer T cells. Nature immunology. 2009;10:306–313. doi: 10.1038/ni.1696. [DOI] [PMC free article] [PubMed] [Google Scholar]
- Lee YJ, Holzapfel KL, Zhu J, Jameson SC, Hogquist KA. Steady-state production of IL-4 modulates immunity in mouse strains and is determined by lineage diversity of iNKT cells. Nature immunology. 2013;14:1146–1154. doi: 10.1038/ni.2731. [DOI] [PMC free article] [PubMed] [Google Scholar]
- Lin W, Zhang Z, Chen CH, Behringer RR, Dent SY. Proper Gcn5 histone acetyltransferase expression is required for normal anteroposterior patterning of the mouse skeleton. Dev Growth Differ. 2008;50:321–330. doi: 10.1111/j.1440-169X.2008.01041.x. [DOI] [PMC free article] [PubMed] [Google Scholar]
- Lin Z, Yang H, Kong Q, Li J, Lee SM, Gao B, Dong H, Wei J, Song J, Zhang DD, et al. USP22 antagonizes p53 transcriptional activation by deubiquitinating Sirt1 to suppress cell apoptosis and is required for mouse embryonic development. Mol Cell. 2012;46:484–494. doi: 10.1016/j.molcel.2012.03.024. [DOI] [PubMed] [Google Scholar]
- Mao X, Gluck N, Li D, Maine GN, Li H, Zaidi IW, Repaka A, Mayo MW, Burstein E. GCN5 is a required cofactor for a ubiquitin ligase that targets NF-kappaB/RelA. Genes & development. 2009;23:849–861. doi: 10.1101/gad.1748409. [DOI] [PMC free article] [PubMed] [Google Scholar]
- Phan HM, Xu AW, Coco C, Srajer G, Wyszomierski S, Evrard YA, Eckner R, Dent SY. GCN5 and p300 share essential functions during early embryogenesis. Dev Dyn. 2005;233:1337–1347. doi: 10.1002/dvdy.20445. [DOI] [PubMed] [Google Scholar]
- Savage AK, Constantinides MG, Han J, Picard D, Martin E, Li B, Lantz O, Bendelac A. The transcription factor PLZF directs the effector program of the NKT cell lineage. Immunity. 2008;29:391–403. doi: 10.1016/j.immuni.2008.07.011. [DOI] [PMC free article] [PubMed] [Google Scholar]
- Schmidt-Supprian M, Tian J, Grant EP, Pasparakis M, Maehr R, Ovaa H, Ploegh HL, Coyle AJ, Rajewsky K. Differential dependence of CD4+CD25+ regulatory and natural killer-like T cells on signals leading to NF-kappaB activation. Proceedings of the National Academy of Sciences of the United States of America. 2004;101:4566–4571. doi: 10.1073/pnas.0400885101. [DOI] [PMC free article] [PubMed] [Google Scholar]
- Secci D, Carradori S, Bizzarri B, Bolasco A, Ballario P, Patramani Z, Fragapane P, Vernarecci S, Canzonetta C, Filetici P. Synthesis of a novel series of thiazole-based histone acetyltransferase inhibitors. Bioorg Med Chem. 2014;22:1680–1689. doi: 10.1016/j.bmc.2014.01.022. [DOI] [PubMed] [Google Scholar]
- Sivakumar V, Hammond KJ, Howells N, Pfeffer K, Weih F. Differential requirement for Rel/nuclear factor kappa B family members in natural killer T cell development. The Journal of experimental medicine. 2003;197:1613–1621. doi: 10.1084/jem.20022234. [DOI] [PMC free article] [PubMed] [Google Scholar]
- Torigoe T, Saragovi HU, Reed JC. Interleukin 2 regulates the activity of the lyn protein-tyrosine kinase in a B-cell line. Proceedings of the National Academy of Sciences of the United States of America. 1992;89:2674–2678. doi: 10.1073/pnas.89.7.2674. [DOI] [PMC free article] [PubMed] [Google Scholar]
- Townsend MJ, Weinmann AS, Matsuda JL, Salomon R, Farnham PJ, Biron CA, Gapin L, Glimcher LH. T-bet regulates the terminal maturation and homeostasis of NK and Valpha14i NKT cells. Immunity. 2004;20:477–494. doi: 10.1016/s1074-7613(04)00076-7. [DOI] [PubMed] [Google Scholar]
- Vallabhapurapu S, Powolny-Budnicka I, Riemann M, Schmid RM, Paxian S, Pfeffer K, Korner H, Weih F. Rel/NF-kappaB family member RelA regulates NK1.1- to NK1.1+ transition as well as IL-15-induced expansion of NKT cells. European journal of immunology. 2008;38:3508–3519. doi: 10.1002/eji.200737830. [DOI] [PubMed] [Google Scholar]
- Voss SD, Sondel PM, Robb RJ. Characterization of the interleukin 2 receptors (IL-2R) expressed on human natural killer cells activated in vivo by IL-2: association of the p64 IL-2R gamma chain with the IL-2R beta chain in functional intermediate-affinity IL-2R. The Journal of experimental medicine. 1992;176:531–541. doi: 10.1084/jem.176.2.531. [DOI] [PMC free article] [PubMed] [Google Scholar]
- Wang L, Dent SY. Functions of SAGA in development and disease. Epigenomics. 2014;6:329–339. doi: 10.2217/epi.14.22. [DOI] [PMC free article] [PubMed] [Google Scholar]
- Yokoyama WM. Betting on NKT and NK cells. Immunity. 2004;20:363–365. doi: 10.1016/s1074-7613(04)00085-8. [DOI] [PubMed] [Google Scholar]
- Yue SC, Shaulov A, Wang R, Balk SP, Exley MA. CD1d ligation on human monocytes directly signals rapid NF-kappaB activation and production of bioactive IL-12. Proceedings of the National Academy of Sciences of the United States of America. 2005;102:11811–11816. doi: 10.1073/pnas.0503366102. [DOI] [PMC free article] [PubMed] [Google Scholar]
- Zhang J, Lee SM, Shannon S, Gao B, Chen W, Chen A, Divekar R, McBurney MW, Braley-Mullen H, Zaghouani H, et al. The type III histone deacetylase Sirt1 is essential for maintenance of T cell tolerance in mice. The Journal of clinical investigation. 2009;119:3048–3058. doi: 10.1172/JCI38902. [DOI] [PMC free article] [PubMed] [Google Scholar]
- Zhao J, Weng X, Bagchi S, Wang CR. Polyclonal type II natural killer T cells require PLZF and SAP for their development and contribute to CpG-mediated antitumor response. Proceedings of the National Academy of Sciences of the United States of America. 2014;111:2674–2679. doi: 10.1073/pnas.1323845111. [DOI] [PMC free article] [PubMed] [Google Scholar]
Associated Data
This section collects any data citations, data availability statements, or supplementary materials included in this article.