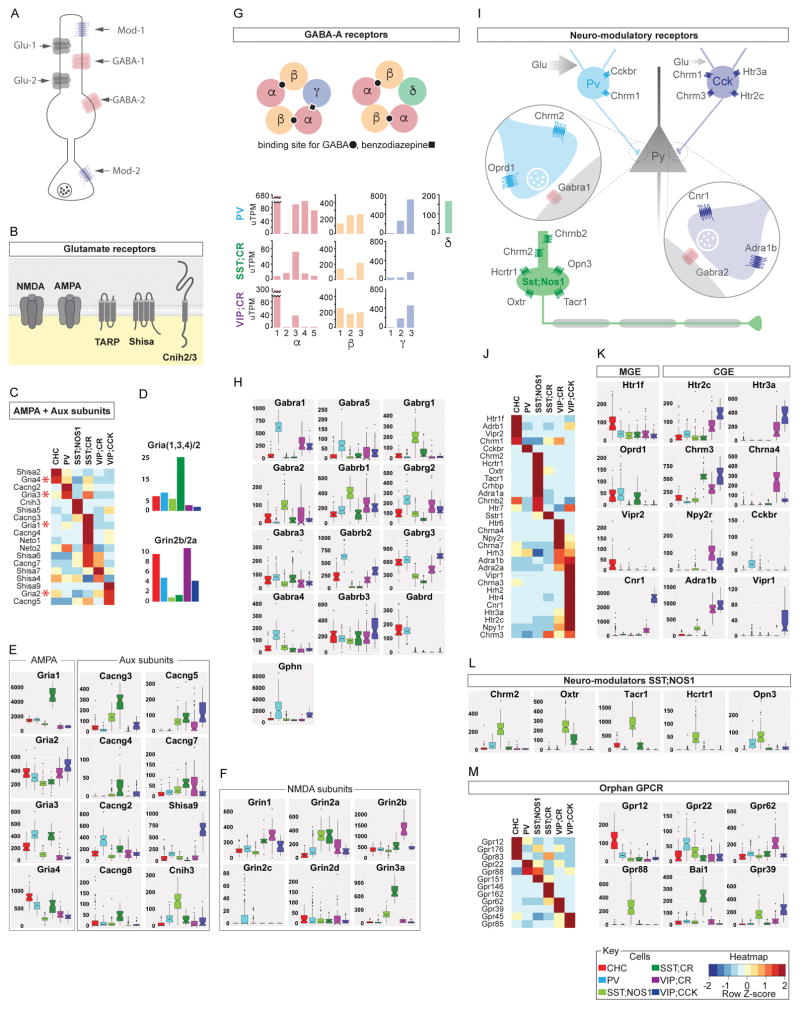
Figure 4. Differential expression of transmitter and modulatory receptors among PCPs.
(A) Schematic of transmitter and modulatory receptors on a generic GABAergic neuron.
(B) Schematic of glutamate receptor core subunits and auxiliary proteins that form native receptors.
(C) DE of AMPAR core subunits and auxiliary proteins across PCPs; SST;CR cells express the greatest diversity of AMPARs.
(D) Top: SST;CR cells show highest Gria1,3,4 (GluA1,A3A4)/Gria2 (GluA2) ratio among PCPs. Bottom: Most GABAergic neurons have more Grin2b (GluN2B) than Grin2a (GluN2A) receptors; the reverse is true in SST neurons.
(E) AMPAR core and auxiliary subunits shows striking differences among PCPs.
(F) DE of NMDAR subunits; glycine-activated Grin3a (GluN3A) is highly expressed in SST;CR cells.
(G) Top: Schematic of GABAAR and ligand binding sites. Bottom: DE of α, β and γ subunits within a PCP; PVBC and SST/CR cells have the most and least diversity, respectively.
(H) GABAAR subunit level differences among PCPs. PVBCs have the highest levels of α1, α4, α5 and also the inhibitory postsynaptic scaffolding protein Gphn (Gephrin).
(I) Schematic comparison of neuromodulatory receptors among PVBC, CCKC and LPCs.
(J) DE of neuromodulatory receptors among PCPs; LPCs and CCKC shows the highest diversity.
(K) CGE-derived interneurons express more neuromodulatory receptors types than MGE-derived interneurons.
(L) Select neuromodulatory receptors specific to or enriched in LPCs.
(M) DE of orphan GPCRs among PCPs shown as heatmap (left) and boxplots (right).
All boxplots y-axis in uTPM. Also see Figure S4.

