Abstract
Asthma is the most prevalent chronic disease among pediatrics, as it is the leading cause of student absenteeism and hospitalization for those under the age of 15. To address the significant need to manage this disease in children, the authors present a mobile health (mHealth) system that determines the risk of an asthma attack through physiological and environmental wireless sensors and representational state transfer application program interfaces (RESTful APIs). The data is sent from wireless sensors to a smartwatch application (app) via a Health Insurance Portability and Accountability Act (HIPAA) compliant cryptography framework, which then sends data to a cloud for real-time analytics. The asthma risk is then sent to the smartwatch and provided to the user via simple graphics for easy interpretation by children. After testing the safety and feasibility of the system in an adult with moderate asthma prior to testing in children, it was found that the analytics model is able to determine the overall asthma risk (high, medium, or low risk) with an accuracy of 80.10±14.13%. Furthermore, the features most important for assessing the risk of an asthma attack were multifaceted, highlighting the importance of continuously monitoring different wireless sensors and RESTful APIs. Future testing this asthma attack risk prediction system in pediatric asthma individuals may lead to an effective self-management asthma program.
I. INTRODUCTION
Pediatric asthma is the most prevalent childhood chronic disease, as it affects nearly 6 million children in the United States [1], and significantly impacts their quality of life and healthcare related costs. Furthermore, recent statistics from the National Health Interview Study indicate that 9% of US children currently suffer from asthma [2], and there is considerably poor asthma control in these individuals. Asthma is the leading cause of hospitalization for those under the age of 15, and 10% of children diagnosed with asthma go to an emergency room each year [3], [4]. It is also a leading cause of student absenteeism, causing upwards of 14 million school days lost per year due to asthmatic symptoms [5], [6]. Finally, the related societal and healthcare costs of asthma in the US are in excess of $50 billion per year [7], with an estimated average yearly cost of care for a child with asthma being $1,039 [7], [8].
It is clear that there is a significant need to alleviate symptoms and manage this disease in children. Mobile health systems provide a potential platform for the management of asthma in children through patient education and adherence to medications. While most previous mobile asthma applications (apps) have focused on these aspects of mobile health [9], much of the information captured is typically through e-diaries and self-reports rather than automated sensor-based data collection. Moreover, a recent review [10] demonstrated that the absence of passive sensing (i.e., sensors that collect observations without involving people in the loop) and reliance on e-diaries led to a reduction in compliance and adherence. These observations suggest that there is a need for better integration of wireless sensing capabilities and communication protocols with asthma apps to reduce the amount of e-diary requests from the patient and thus improve adherence and compliance.
In this study, we describe our preliminary work to determine the overall risk of an asthma attack. Using both wireless sensors as well as representational state transfer application program interfaces (RESTful APIs), data is collected in real-time via a mobile smartwatch app. The data on the smartwatch is then sent via Health Insurance Portability and Accountability Act (HIPAA) compliant encryption to a HIPAA compliant cloud for real-time integration and analytics. The resulting asthma risk is classified through a combination of machine learning approaches and provided to the user via simple graphics on the smartwatch.
II. Motivation and Related Work
With the advancement of low-cost wireless sensors, as well as smart phones and watches, remote monitoring of physiological, physical, environmental, and cognitive health behaviors has become increasingly adopted by healthcare professionals and the general public [11], [12]. In particular, mobile health apps can help asthma patients improve their symptoms through patient education and monitoring. The use of these systems to monitor asthma patients is not new [13]–[16], and previous studies on mobile asthma apps have found a positive impact on patient education and adherence. However, in order to detect and prevent asthma attacks in real-time, future asthma apps require remote sensing of the patient’s physiological state, their environment, cognitive health, physical activity levels, as well as their medication use.
In addition to wireless sensors for real-time physiological, environmental, and medication treatment information, RESTful APIs have also been utilized in previous asthma mobile apps for real-time monitoring. For example, a previous study conducted by Anantharam et al. [15] on the kHealth app incorporated population and public level observations through a series of RESTful APIs. Specifically, the study collected data from WeatherForYou.com, Pollen.com, and AirNow.gov to obtain information about the weather, outdoor air pollution, and outdoor pollen levels based on the individual’s location determined through GPS on the mobile phone. This data was then synchronized and aggregated with wireless sensing data to provide an enriched set of information while minimizing user involvement. By providing RESTful API information, the study was able to assess the risk of an asthma attack without the need for extensive user input through e-diaries.
Similar to Anantharam et al. [15] and the ongoing Asthma Mobile Health study conducted by the Icahn School of Medicine at Mount Sinai [16], our study also focuses on utilizing both wireless sensing and online RESTful API data to understand the level of risk of an asthma attack for an individual. By creating such an enriched data set, we have developed a personalized model that includes a wide range of health signals that influence asthma symptoms. However, current asthma apps such as those presented in Anantharam et al. [15], Tahir and Rice [16], as well as those reviewed in Huckvale et al. [17], do not address security concerns nor comply with HIPAA standards. Thus, in addition to addressing the need for wireless sensing to improve compliance, the asthma app presented here addresses the need to maintain HIPAA compliance through a hybrid cryptographic framework.
III. METHODS
The asthma app collected wireless sensors and online RESTful API data to continuously estimate the level of risk of an asthma attack for an individual. To ensure safety and determine the feasibility of using the app prior to testing it in children, it was first tested in an adult individual with moderate asthma (female, age 29, 5 ft 5″ tall, had asthma since birth) in a real-world setting under the University of California Los Angeles Institutional Review Board (IRB number 15-001402).
A. System Overview
The asthma app consisted of a wireless custom-built dust sensor and a commercially-available spirometer (Section III-B) that sent encrypted data in real time to an Android smart-watch (Samsung Gear Live, Samsung, Seoul, South Korea) via Bluetooth 4.0 Low Energy (BLE) communication. The asthma app then combined this information with heart rate, acceleration, time, and location data from the smartwatch (Section III-C), and sent an encrypted JavaScript Object Notation (JSON) file to the cloud (see Fig. 1). The cloud decrypted this data, and pulled RESTful API data at the nearest location and corresponding timestamp (Section III-E). These data were then used as input features in a real-time analytics model (Section III-F) to estimate the overall asthma risk.
Fig. 1.

System overview of the smartwatch asthma app.
B. Wireless Sensors
In order to maintain a closed HIPAA compliant system design, data was encrypted on the firmware and sent to the smartwatch using the BLE stack. This level of encryption was deemed sufficient, as BLE encrypts data using 128-bit Advanced Encryption Standard (AES) cryptography [18], which meets the HIPAA requirement to have at least 128-bit encryption to protect electronic protected health information [19].
1) Dust Sensor
The wireless dust sensor used a compact optical dust sensor (Sharp Corporation, Osaka, Japan) for dust density measurements, which was validated against a Dylos professional air quality monitor (DC1100 Pro, Dylos Corporation, Riverside, CA) for sensitivity and accuracy under several different air quality conditions. To allow the dust sensor to be portable, it was integrated with a BLE module (ARM Cortex-M0 microcontroller with integrated Bluetooth 4.0 LE, RFDigital Corporation, Hermosa Beach, CA) and power supply board (PowerBoost 500C, Adafruit Industries, New York, NY). A circuit diagram of the wireless dust sensor can be seen in Fig. 2.
Fig. 2.
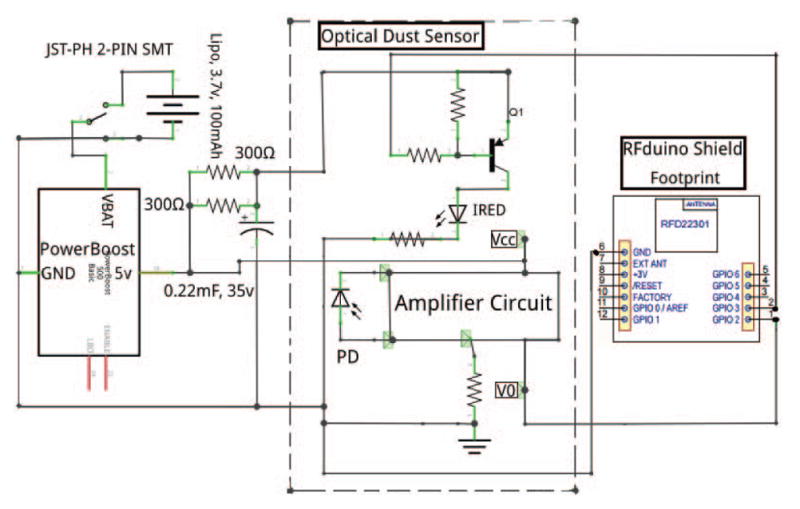
Circuit diagram of the wireless dust sensor.
2) Spirometer
To collect physiological measurements of individuals, a Vitalograph Asthma-1 electronic peak flow meter (Vitalograph Ltd., Buckingham, England) was used to obtain spirometry data. Spirometry information is an important physiological measurement for the treatment of asthma, as it can assess the severity of the individual’s asthma [20]. More specifically, peak expiratory flow (PEF) and forced expiratory volume in one second (FEV1) information are most important for the clinical assessment of asthma, as a reduction in these values from age and height-matched healthy individuals’ averages indicates the overall severity of the asthma at a particular time [20].
Spirometry data was sent to the cloud immediately after the individual took measurements by pressing the “spirometer” button on the watch (see Fig. 3 below). The smartwatch app then parsed and read these data using the information provided in the device’s API developer’s toolkit, and sent this information to the cloud for real-time feedback of the current asthma attack risk.
Fig. 3.
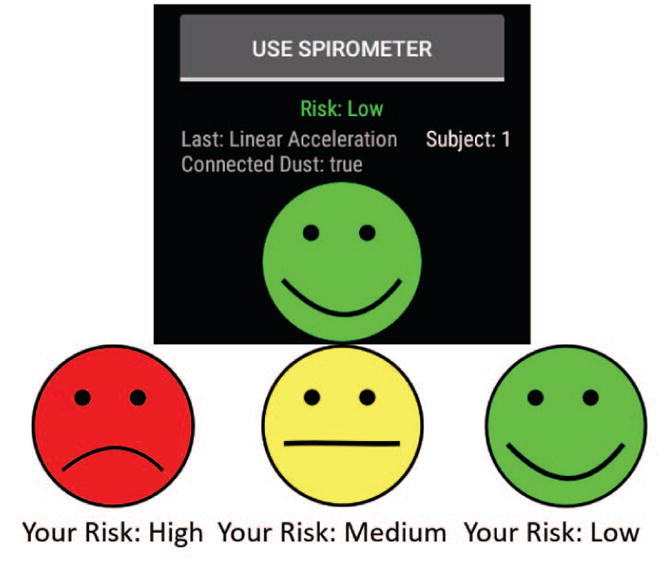
Asthma app risk value user interface, showing the overall asthma risk and button to collect spirometer data on the smartwatch. Green risk level represents a low overall asthma risk, yellow risk level represents a moderate asthma risk, while red represents a high asthma risk.
C. Smartwatch App
The Android smartwatch (Samsung Gear Live, Samsung, Seoul, South Korea) was linked with a Samsung Galaxy S6 smartphone to send and receive data in real-time throughout the day. A smartwatch was chosen over using only a phone, as children with asthma are less likely to carry a phone during play and exercise [21], activities that can exacerbate their symptoms.
The smartwatch app collected dust sensor (number of large particles > 2.5μm) and spirometer (PEF, FEV1) data via encrypted BLE communication. This data was then appended to acceleration, heart rate, and location information pulled from the smartwatch (Fig. 1). The smartwatch encrypted and transmitted the combined data to the cloud through WiFi communication, where it was subsequently decrypted (see Section III-D). Note that a data plan can easily be added to the watch for continuous data transmission even when the individual is not within WiFi range. The decrypted data was then used in the analytics model on the cloud to calculate a risk value. Subsequently, the result was sent with the same secure method from the cloud to the smartwatch and displayed (Fig. 3) as a frown (high risk), neutral (medium risk), or happy face (low risk), graphics that can easily be understood by children.
D. HIPAA Cryptography Framework
The data was encrypted using a 128-bit AES technique. AES is a symmetric encryption method, which means that same key must be used to encrypt and decrypt the data. In order to ensure secure key exchange between the smartwatch and cloud, the Rivest Shamir Adleman (RSA) encryption algorithm was implemented to send the AES symmetric key from the smartwatch to the cloud (Fig. 4). The RSA algorithm generates a pair of public and private keys on both the smartwatch and cloud. The public key is known by both parties, however, the private key is kept secret. The smartwatch uses the cloud’s public key to encrypt the AES symmetric key and then sends it to the cloud.
Fig. 4.
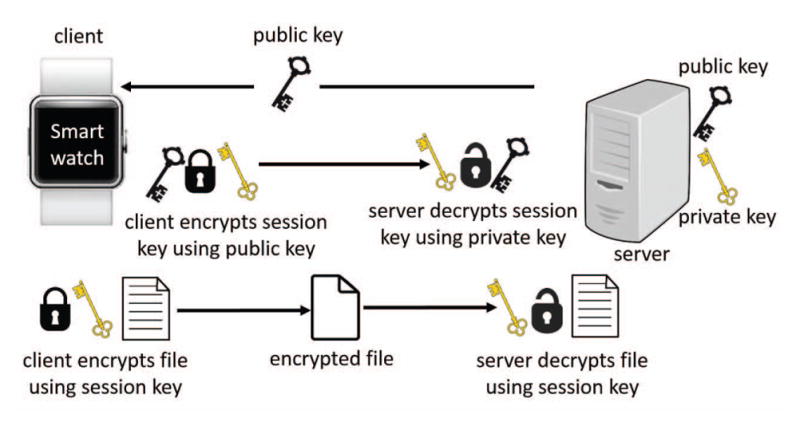
Hybrid cryptography framework implemented to maintain HIPAA compliant security and privacy.
This hybrid encryption method was used in the system’s infrastructure, as Silva et al. [22] found that the technique achieves comparable performance levels as similar apps without encryption, and offers a robust and reliable increase of privacy, confidentiality, integrity, and authenticity of the protected health information required for HIPAA compliance [22]. The results of the study in Silva et al. [22] also showed that the combination of AES and RSA cryptography algorithms had better results in terms of encryption time when the size of the data increased compared to other encryption algorithms, which is important in this application given the large amount of data collected from wireless sensors.
E. Data Collection on the Cloud
The cloud platform (breatheplatform.com) used to store and analyze the data was developed using the Amazon Elastic Compute Cloud (Amazon EC2, Amazon Web Services, Seattle, WA). This platform pulled the encrypted data sent from the smartphone (which was synced with the smart-watch) and decrypted the data using the hybrid cryptography method presented in the previous section. Finally, the pulled timestamp and GPS data was used to combine this data with RESTful API data.
The RESTful API data in this study consisted of different atmospheric, traffic, and pollutant intensity metrics. Data was gathered from three online sources: AirNow. gov, Forecast.io, and MapQuest.com. Each of these websites provided different information (such as pollution level, weather condition, and nearby traffic volume) through RESTful APIs that take geographical coordinates as an HTTP request and returns requested data in a JSON format. Each online source is described below.
1) AirNow.gov
AirNow.gov provides the air quality index (AQI) for different geographical coordinates in the United States. The AQI is designed to allow people to better understand the local air quality in relationship to their health. This number is computed using the density of ozone, particulate matter (PM2.5, PM10), carbon monoxide (CO), nitrogen dioxide (NO2), and sulfur dioxide (SO2).
2) Forecast.io
The Forecast.io RESTful API provides different weather condition parameters for a given coordinate all over the world. Parameters provided by Forecast.io in each HTTP response are as follows: temperature, wind speed, cloud cover, humidity, visibility, pressure, ozone, expected precipitation intensity and probability of precipitation.
3) MapQuest.com
Since the Google Maps RESTful API is too restricted and cannot provide free nearby traffic volumes, the website MapQuest.com was utilized. For each HTTP response, the traffic service API provides nearby construction, incidents, and traffic congestion at a given coordinate in the United States. If the incident was determined to impact the traffic flow and thus cause a delay, the added delay due to the incident was used as a feature to assess the traffic volume of the given coordinate.
F. Real-Time Analytics on the Cloud
All of the prediction and evaluation methods used in this study were performed using the Scikit-learn library for Python (Python Software Foundation, available at python. org). This is an open source library with strong documentation and efficient tools for the machine learning techniques used in this study.
1) Data Manipulation
After retrieving data from the smartwatch and RESTful APIs, initial data manipulation was required to make the data set ready for analysis. A data cleaning step was first performed, as the gathered data contained some missing or out-of-bound values. In this step, the sample was removed from the data set since the number of these samples was negligible compared to the rest of the data set. Then, for the accelerometer data to determine the individual’s physical activity level, the algorithm proposed by Yamada et al. [23] was used as it has a higher correlation with measured metabolic equivalents than the widely accepted Doubly Labeled Water method for estimating total energy expenditure. To this end, the vector norm of the composite acceleration (Km) was first calculated as follows:
| (1) |
where
| (2) |
and
| (3) |
The values x, y, and z are the raw accelerometer values measured over a 5 s time window.
For the dust sensor data to be used in the analytics model, it was preprocessed to output the number of particles > 2.5μm rather than the raw voltage values. This was done by removing all dropped packets, increasing the sensitivity by scaling when the data deviates from its baseline values, and smoothing the data over a moving window of 6 s.
2) Machine Learning Model
After preprocessing the data, it was then fed into a training model. The training model used a random forest classifier to classify samples into three different classes (high, medium, and low risk). A random forest classifier was chosen as it uses averaging to improve the predictive accuracy and control for over-fitting. A training phase was first performed offline and the model was saved on the cloud to allow for real-time predictions. To predict the asthma risk at each moment, a fixed size window of the last reported values was considered. For the dust sensor data, this window was used to avoid sudden changes in dust readings. For acceleration readings, values in one window were used to compute the energy expenditure using Eqns. 1–3. The resulting features that were included in this model were: FEV1 (L/min), PEF (L/min), dust density (number particles > 2.5μm), heart rate, total energy expenditure, temperature, humidity, ozone, pressure, cloud cover, wind speed, precipitation probability, precipitation intensity, traffic density, and AQI.
3) Methods used for Predicting Asthma Risk
The prediction model was tested and optimized through several full day experiments in a real world setting. Specifically, to test the feasibility of the current system, an individual with asthma collected data using the asthma risk system and wireless sensors over the course of five days to simulate a school week in children. The participant also performed spirometry and the Asthma Control Test (http://www.asthmacontroltest.com/) every hour throughout the day on each experiment day. The Asthma Control Test was used because this self-report has been used in previous asthma apps for validation [17]. Also, this test is available for children from 4 – 11 years of age, which will be important in future validation tests with our target population.
4) Evaluation Measures and Validation Methods
To evaluate the modeling results, we plotted the expected risk output from the self-report data against the predicted value for a portion of the test samples to visualize the results. In addition, as almost every method used in this study contained hyper-parameters that required tuning to obtain the best results, we used 10-fold cross-validation while applying grid-search in all methods to obtain optimal results that fit best with the self-report results.
IV. RESULTS
The wireless sensors and RESTful APIs were able to continuously and securely collect data through the asthma app in real world settings to provide real-time asthma risk information to the user. Furthermore, the overall asthma attack risk level was accurately estimated by the analytics model in the individual with moderate asthma during all feasibility tests.
A. Data Collection from Wireless Sensors
The dust and spirometer sensors were able to accurately send particle count, PEF, and FEV1 readings to the cloud. As seen in Fig. 5, when compared to the professional air quality monitor, the dust sensor was able to accurately report the number of large particles (those greater than 2.5μm) when exposed to smoke. Note that the sensors were not equally distant from the origin of the smoke due to their differences in size, so the small dust sensor was exposed to smoke before the professional sensor.
Fig. 5.
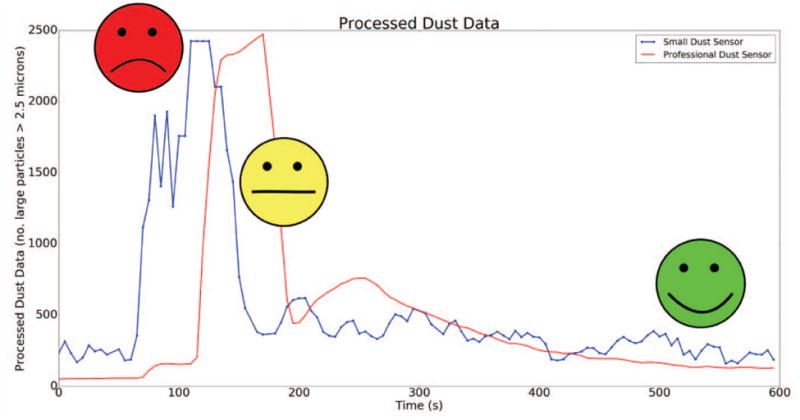
Processed dust data (blue) compared to a professional dust sensor (red) and the corresponding asthma risk labels when the sensors were exposed to smoke.
It can be seen in Fig. 6 that the spirometer PEF and FEV1 readings decreased when the individual with asthma was exposed to a room with smoke. Furthermore, the asthma risk labels generated by the analytics model accurately determined that the individual was at a high risk of an asthma attack when she entered the room. The individual with asthma also reported an average PEF value of 320.6±30.3 L/min during instances of no asthma symptoms and little to no asthma risk. Compared to age and height-matched healthy persons, whose average PEF is approximately 380 L/min, it is evident that individuals who suffer from asthma have a lower PEF value at baseline. Thus, it is important to take several baseline measurements prior to using the app so that the machine learning model can appropriately interpret the individual’s asthma risk.
Fig. 6.
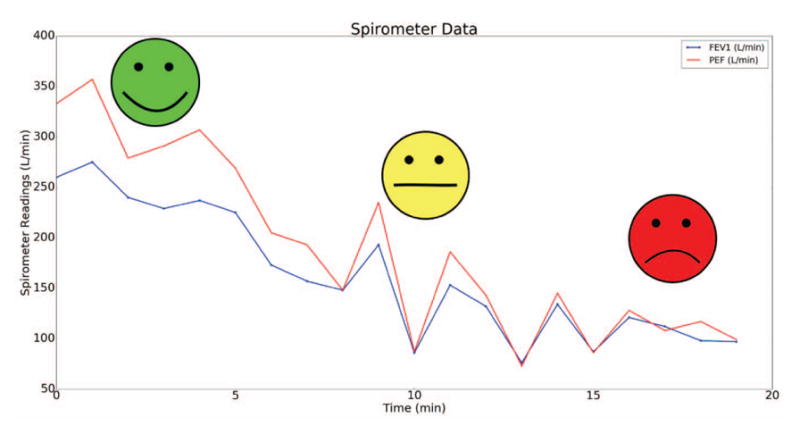
PEF and FEV1 spirometer readings and corresponding asthma risk labels when the individual entered a smoky room.
B. Evaluation of the Analytics Model
The analytics model to determine the overall asthma risk of a three class classifier had an accuracy of 80.10±14.13% (N = 59) after performing 10-fold cross validation (chance level: 33.33%). As seen in Fig. 7, FEV1, PEF, dust density, and heart rate were found to be the most important features to determine the individual’s asthma risk in real-world settings. This plot shows that the wireless sensors were most important in predicting the overall risk of an asthma attack. Note that when compared to a pulse oximeter (Onyx II, Nonin Medical Inc., Plymouth, MN), the heart rate data had a 96.74% accuracy under lying, sitting, standing, walking, and running conditions. Finally, the features presented here show how prediction models for asthma require both physiological as well as environmental data, as triggers for this disease are multifaceted.
Fig. 7.
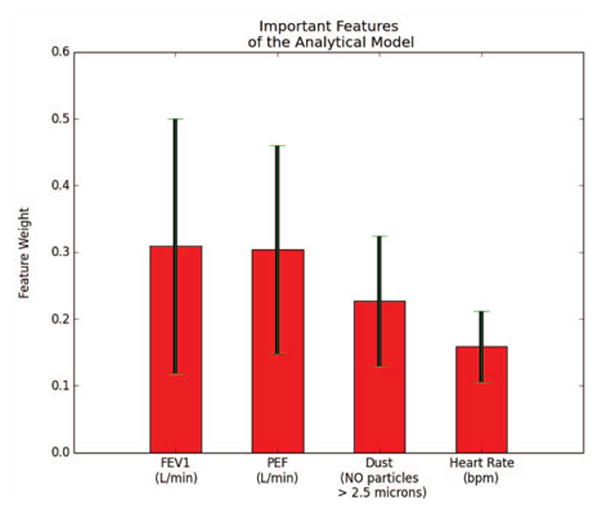
Most important features of the analytics model by weight. Red bars represent the average weight and black lines represent the standard deviation of the weights after 10-fold cross-validation.
V. DISCUSSION
The results of this study describe the feasibility of using wireless sensors and RESTful API data in real world settings to assess the risk of an asthma attack. The dust sensor and spirometry data sent through the HIPAA compliant hybrid cryptography framework were able to accurately detect known asthma triggers, and appropriate risk classifications were sent to the user in real time (see Figs. 5 and 6).
During the feasibility study on the adult individual with asthma, the analytics model was able to accurately assess the overall risk of an asthma attack. Specifically, the model was able to determine the risk of an attack with an 80% accuracy for a three class classifier, which can be improved with future testing in more individuals. The resulting important features found from the analytics model were multifaceted, and included both environmental and physiological features. As seen in Fig. 7, heart rate information was an important feature for determining the risk of an attack. Thus, future asthma apps will require the use of a smartwatch that has photoplethysmography (PPG) sensors to continuously measure heart rate so that the risk can be better predicted.
Although only tested in one adult individual, this smart-watch asthma app provides an ideal infrastructure for future mHealth systems. Particularly, the hybrid cryptographic framework used to send wireless sensor data to the cloud for real-time analytics followed HIPAA data transfer standards and ensured secure key exchange between the smartwatch and cloud. This method allowed our system to achieve robust and reliable privacy, confidentiality, integrity, and authenticity of the data without affecting the system’s performance.
Future research using this smartwatch asthma app will include testing the system on several children who suffer from asthma. These experiments will be a part of future clinical trials through the National Institute of Biomedical Imaging and Bioengineering (NIBIB) Los Angeles (LA) Pediatric Research using Integrated Sensor Monitoring Systems (PRISMS) Center. In addition, as part of the NIBIB LA PRISMS Center, future developments of the app will include synchronization with caregiver’s and parent’s smart phones to display trendlines, provide action plans, and gamified incentives to allow caregivers to monitor and manage their child’s asthma symptoms. The security and data transfer infrastructure developed for this smartwatch app will also be used to standardize asthma apps across different platforms. If successful, this smartwatch asthma app may become an important tool for the management of asthma in children and will provide an appropriate framework for future mHealth systems.
VI. CONCLUSIONS
The work presented here describes an end-to-end asthma attack risk prediction system that informs individuals of their overall risk of an asthma attack through an easy to understand user interface on a smartwatch. The proposed system preserves users’ health related data through a HIPPA compliant cryptographic framework, and minimizes the need for e-diary requests through automated wireless sensing and RESTful APIs. These features of the system are important in future testing with children who suffer from asthma, as it will lead to increased compliance and adherence to the app while maintaining HIPAA compliant data transmission for the self-management care program.
Acknowledgments
This work was supported by the National Institute of the Biomedical Imaging and Bioengineering (NIBIB) Los Angeles Pediatric Research using Integrated Sensor Monitoring Systems (PRISMS) Center: The Biomedical REAl-Time Health Evaluation (BREATHE) Platform, NIH/NIBIB U54 award no. EB022002.
References
- 1.National Heart Lung and Blood Institute description of asthma. 2015 [Online]. Available: http://www.nhlbi.nih.gov/health/health-topics/topics/asthma/atrisk.
- 2.Bloom B, Jones L, FG National center for health statistics (2013) summary health statistics for us children: National health interview survey. Vital Health Stat. 2012;10(258) [PubMed] [Google Scholar]
- 3.Buie V, Owings M, DeFrances C, Golosinskiy A. National center for health statistics national hospital discharge survey: 2006 summary. Vital Health Stat. 2010;13(168) [PubMed] [Google Scholar]
- 4.Moorman J, Akinbami L, Bailey C, et al. National surveillance of asthma: United states, 2001–2010. Vital Health Stat. 2012;3(35) [PubMed] [Google Scholar]
- 5.American Lung Association. Asthma & children fact sheet. [Online] 2014 Available: http://www.lung.org/lungdisease/asthma/resources/facts-and-figures/asthma-children-fact-sheet.html#4.
- 6.Bloom B, Cohen R, Freeman G. National center for health statistics summary health statistics for us children: National health interview survey, 2009. Vital Health Stat. 2010;10(247):1–82. [PubMed] [Google Scholar]
- 7.Barnett S, Nurmagambetov T. Costs of asthma in the United States: 2002–2007. J Allergy Clin Immunol. 2011;127(1):145–152. doi: 10.1016/j.jaci.2010.10.020. [DOI] [PubMed] [Google Scholar]
- 8.Centers for Disease Control. Asthma’s impact on the nation: Data from the CDC national asthma control program. [Online] 2013 Available: http://www.cdc.gov/asthma/impactsnation/asthmafactsheet.pdf.
- 9.Marcano Belisario JS, Huckvale K, Greenfield G, Car J, Gunn LH. Smartphone and tablet self management apps for asthma. Cochrane DB Syst Rev. 2013;11 doi: 10.1002/14651858.CD010013.pub2. [DOI] [PMC free article] [PubMed] [Google Scholar]
- 10.Schneider T, Panzera AD, Couluris M, Lindenberger J, McDermott R, Bryant CA. Engaging teens with asthma in designing a patient-centered mobile app to aid disease self-management. Telemed J E Health. 2015 doi: 10.1089/tmj.2015.0041. [DOI] [PubMed] [Google Scholar]
- 11.Suh MK, Chen CA, Woodbridge J, Tu MK, Kim JI, Nahapetian A, Evangelista LS, Sarrafzadeh M. A remote patient monitoring system for congestive heart failure. Journal of Medical Systems. 2011;35(5):1165–1179. doi: 10.1007/s10916-011-9733-y. [DOI] [PMC free article] [PubMed] [Google Scholar]
- 12.Mosa ASM, Yoo I, Sheets L. A systematic review of healthcare applications for smartphones. BMC Med Inform Decis Mak. 2012;12(1):67. doi: 10.1186/1472-6947-12-67. [DOI] [PMC free article] [PubMed] [Google Scholar]
- 13.Rasmussen LM, Phanareth K, Nolte H, Backer V. Internet-based monitoring of asthma: a long-term, randomized clinical study of 300 asthmatic subjects. J Allergy Clin Immunol. 2005;115(6):1137–1142. doi: 10.1016/j.jaci.2005.03.030. [DOI] [PubMed] [Google Scholar]
- 14.Chan DS, Callahan CW, Hatch-Pigott VB, Lawless A, Proffitt HL, Manning NE, Schweikert M, Malone FJ. Internet-based home monitoring and education of children with asthma is comparable to ideal office-based care: results of a 1-year asthma in-home monitoring trial. Pediatrics. 2007;119(3):569–578. doi: 10.1542/peds.2006-1884. [DOI] [PubMed] [Google Scholar]
- 15.Anantharam P, Banerjee T, Sheth A, Thirunarayan K, Marupudi S, Sridharan V, Forbis SG. Knowledge-driven personalized contextual mhealth service for asthma management in children. IEEE 4th Int Conf Mobile Services; 2015. [Google Scholar]
- 16.Tahir D, Rice S. New app aids mount sinai asthma research. Mod Healthc. 2015;45(12):28. [PubMed] [Google Scholar]
- 17.Huckvale K, Morrison C, Ouyang J, Ghaghda A, Car J. The evolution of mobile apps for asthma: an updated systematic assessment of content and tools. BMC Med. 2015;13(1):58. doi: 10.1186/s12916-015-0303-x. [DOI] [PMC free article] [PubMed] [Google Scholar]
- 18.Bluetooth smart (low energy) security. Bluetooth Developer Portal. 2016 [Online]. Available: https://developer.bluetooth.org/TechnologyOverview/Pages/LE-Security.aspx.
- 19.Luxton DD, Kayl RA, Mishkind MC. mhealth data security: The need for hipaa-compliant standardization. Telemed J E Health. 2012;18(4):284–288. doi: 10.1089/tmj.2011.0180. [DOI] [PubMed] [Google Scholar]
- 20.National Heart Lung and Blood Institute. Expert panel report 3 (epr 3): guidelines for the diagnosis and management of asthma. Bethesda: National Institutes of Health; 2007. [Google Scholar]
- 21.Dunton GF, Liao Y, Intille SS, Spruijt-Metz D, Pentz M. Investigating children’s physical activity and sedentary behavior using ecological momentary assessment with mobile phones. Obesity. 2011;19(6):1205–1212. doi: 10.1038/oby.2010.302. [DOI] [PubMed] [Google Scholar]
- 22.Silva BM, Rodrigues JJ, Canelo F, Lopes IC, Zhou L. A data encryption solution for mobile health apps in cooperation environments. J Med Internet Res. 2013;15(4):e66. doi: 10.2196/jmir.2498. [DOI] [PMC free article] [PubMed] [Google Scholar]
- 23.Yamada Y, Yokoyama K, Noriyasu R, Osaki T, Adachi T, Itoi A, Naito Y, Morimoto T, Kimura M, Oda S. Light-intensity activities are important for estimating physical activity energy expenditure using uniaxial and triaxial accelerometers. Eur J Appl Physiol. 2009;105(1):141–152. doi: 10.1007/s00421-008-0883-7. [DOI] [PubMed] [Google Scholar]


