Letter
The prefrontal cortex is a critical neuroanatomical hub for controlling motivated behaviors across mammalian species1–3. In addition to intra-cortical connectivity, prefrontal projection neurons innervate subcortical structures that contribute to reward seeking behaviors, such as the ventral striatum and midline thalamus4. While connectivity among these structures contributes to appetitive behaviors5–13, how projection-specific prefrontal neurons encode reward-relevant information to guide reward seeking is unknown. Here we use in vivo two-photon calcium imaging to monitor the activity of dorsomedial prefrontal neurons during an appetitive Pavlovian conditioning task. At the population level, these neurons display diverse activity patterns during the presentation of reward-predictive cues. Furthermore, recordings from prefrontal neurons with resolved projection targets reveal that individual corticostriatal neurons show response tuning to reward-predictive cues, such that excitatory cue responses are amplified across learning. In contrast, corticothalamic neurons gradually develop new, primarily inhibitory responses to reward-predictive cues across learning. Finally, bidirectional optogenetic manipulation of these neurons reveals that stimulation of corticostriatal neurons promotes conditioned reward seeking after learning, while activity in corticothalamic neurons suppresses both the acquisition and expression of conditioned reward seeking. These data show how prefrontal circuitry can dynamically control reward-seeking behavior through the opposing activities of projection-specific cell populations.
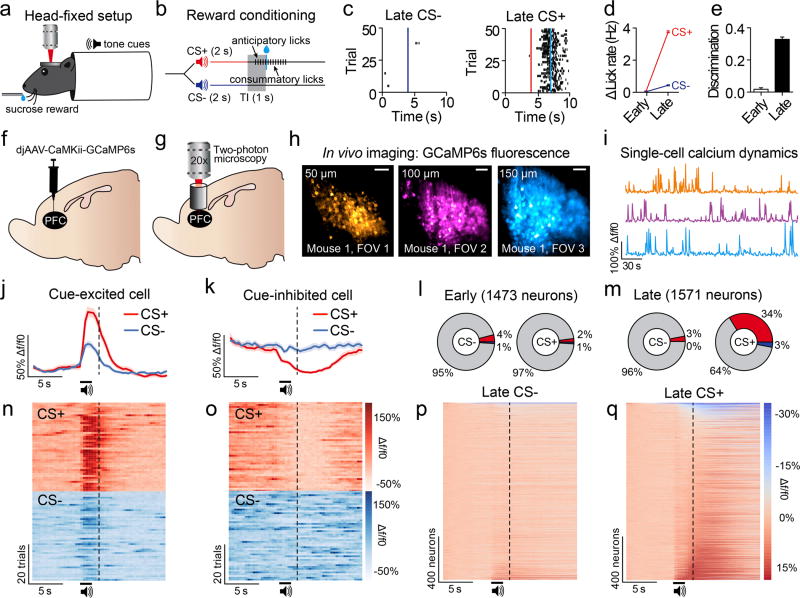
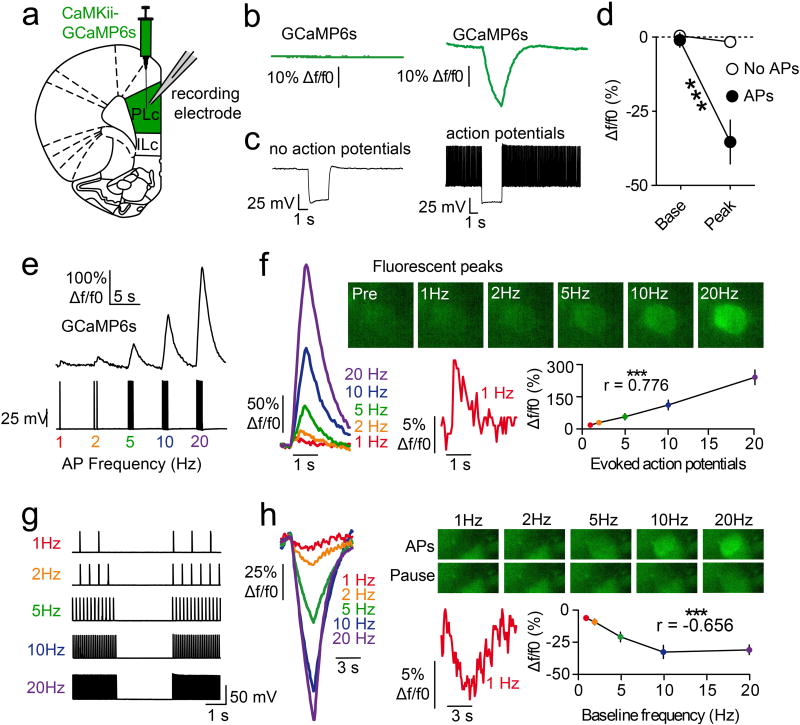
Neurons in the prefrontal cortex (PFC) respond diversely to reward-predictive cues14–17, although how this cue encoding fits into a broader circuitry to guide reward seeking is unknown. To address this, we designed a Pavlovian conditioning task that allows two-photon imaging of deep cortical tissue during behavior. Head-fixed mice were trained to associate one conditioned stimulus (CS+), but not another (CS−), with sucrose (Figure 1a,b). Following multiple training sessions, mice behaviorally discriminated between the cues by displaying anticipatory licks to the CS+ but not CS− (Figure 1c), confirming that the cue-reward contingencies had been established by the late sessions (Figure 1d,e; Extended Data Fig. 1). To monitor neural activity during this task, we injected a virus into dorsomedial PFC for delivery of a calcium indicator18 under the control of the calcium/calmodulin dependent protein kinase II alpha (CAMK2A) promoter (AAVdj-CaMKii-GCaMP6s; Figure 1f), which putatively targets cortical excitatory neurons19. Ex vivo brain slice recordings revealed that fluorescent deflections of GCaMP6s-expressing PFC neurons reliably tracked elevations and reductions in action potential frequency, whereas hyperpolarization from rest alone did not influence GCaMP6s-mediated fluorescence (Extended Data Fig 2). Next, we implanted optical cannulae ~2.2mm beneath the surface of the brain, allowing chronic optical access to hundreds of dorsomedial PFC neurons in each awake, behaving mouse (Figure 1g–i; Supplementary Video 1). Collectively, we recorded from GCaMP6s-expressing PFC neurons before learning (n=1,473) and after learning (n=1,571), and found that while many of these neurons displayed increased activity in response to reward-predictive cues, other neurons exhibited inhibitory cue responses (Figure 1j,k,n,o). These responses were most prevalent during presentation of the CS+, but not the CS−, after learning (Figure 1l,m,p,q; Extended Data Fig. 3a,b; Extended Data Fig. 4a–c). Thus, the responses of many individual PFC neurons could be used to decode whether the CS+ or CS− was presented on any given trial after learning (Extended Data Fig. 4d).
Figure 1. PFC neurons show heterogeneous responses to reward-predictive cues.
a, Head fixation allowed two-photon microscopy in awake, behaving mice. b, Schematic of the Pavlovian conditioning paradigm. c, Example data showing anticipatory licking to the CS+ but not CS− after learning. d, Average change in lick rate during each cue for early and late conditioning sessions. e, Behavioral discrimination (licking during CS+ versus CS−; auROC-0.5) during early and late conditioning sessions wherein separate FOVs were examined (Early, n=30; Late, n=30; t(58)=43.0, p<0.001). f,g, Injections of AAVdj-CaMKii-GCaMP6s into PFC (f) and optical cannula implantation (g) allowed two-photon imaging of PFC neurons throughout conditioning (Early, n=1473 neurons; Late n=1571 neurons; n=8 mice). h,i, GCaMP6s expression across multiple FOVs in dorsomedial PFC (h) allowed recordings from hundreds of prefrontal neurons within individual mice (i). j,k, Perievent data showing example excitatory (j) or inhibitory (k) responses from example neurons during cue delivery after learning. l, Population data of all neurons showing few excitatory (red) or inhibitory (blue) cue responses (p<0.05 after correction; see Methods) to the CS+ and CS− during early sessions (CS+ versus CS−: χ2(2)=9.06, p=0.01). m, Population data of all neurons show many excitatory (red) or inhibitory (blue) cue responses to the CS+, but not CS−, during late sessions (CS+ versus CS−: χ2(2)=523.15, p<0.001). n,o, Heat plots from individual example neurons that showed excitatory (n) or inhibitory (o) responses during cue delivery. p,q, Population heat plots from all mice plots showing averaged cue responses after learning. Bar and line graphs represent the mean±SEM. Vertical dotted lines refer to timing of sucrose delivery. Scale bars=100µm; CS, conditioned stimulus; FOV, field of view; TI, trace interval.
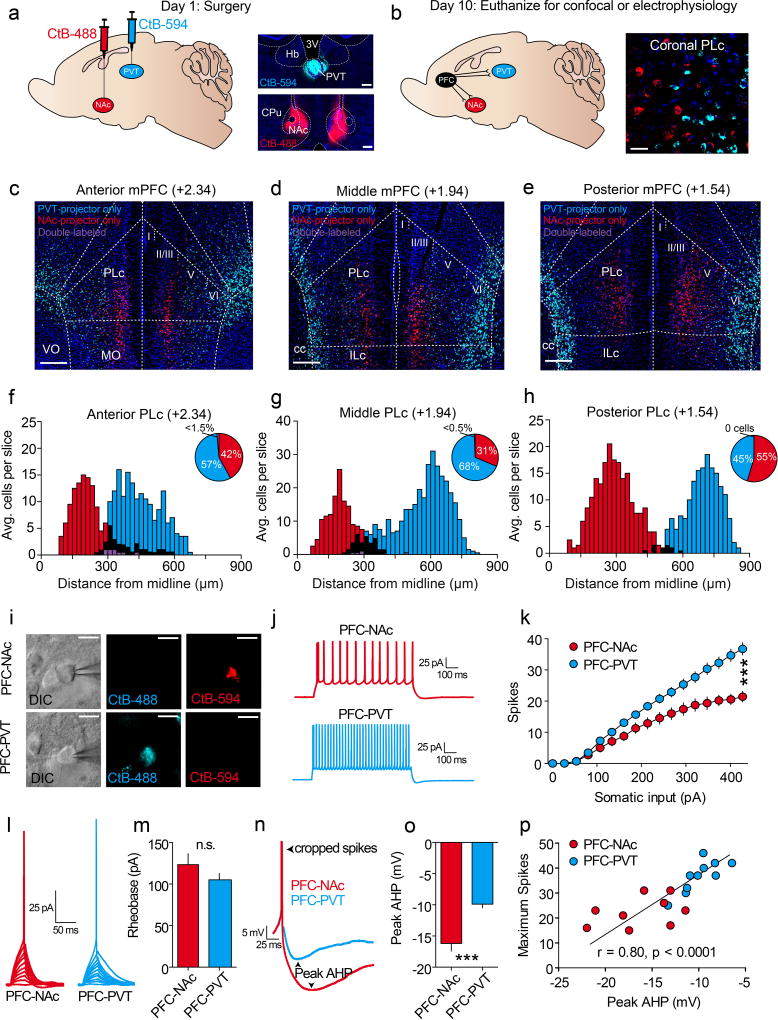
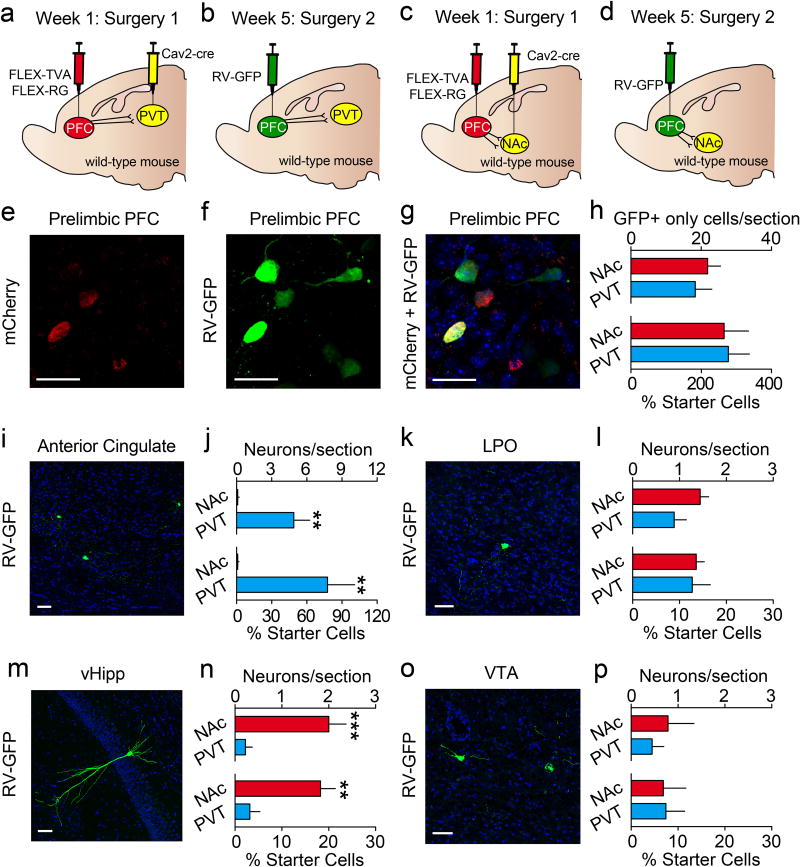
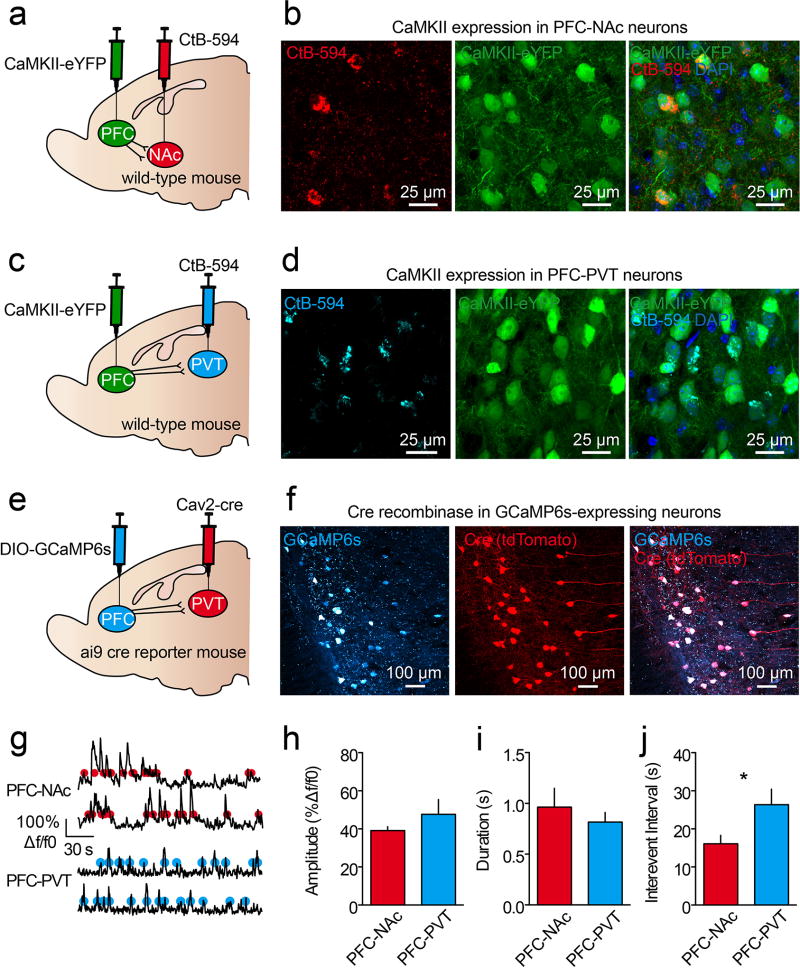
We found that many dorsomedial PFC neurons encoded cues after learning; however, both inhibitory and excitatory responses were common. Considering this, it is possible that distinct populations of neurons in the PFC have opposing cue-encoding properties. Two major projection targets of the PFC are the nucleus accumbens (PFC-NAc) and paraventricular nucleus of the thalamus (PFC-PVT)4. Furthermore, studies examining reward seeking in rodent addiction models have found that PFC-NAc neurons express immediate early genes following cue-induced relapse21,22, and inhibition of these cells can prevent drug seeking6–8,12. Additionally, reward-predictive cues may influence the activity of PVT neurons23, and such activity is thought to modulate cue salience24 and conditioned behaviors25,26. Thus, we hypothesized that PFC-NAc and PFC-PVT neurons encode reward-predictive stimuli to orchestrate appetitive learning. To test this hypothesis, we first determined whether PFC-NAc and PFC-PVT neurons are distinct or overlapping populations of neurons. We injected retrograde cholera toxins conjugated to different fluorophores into NAc and PVT of the same mice. Electrophysiological recordings and histological analysis revealed that PFC-NAc and PFC-PVT neurons are physiologically distinct and anatomically segregated within dorsomedial PFC (Extended Data Fig. 5), such that PFC-NAc neurons are in layers II/III and V (46% layer II/III, 51% layer V, 4% layer VI) whereas PFC-PVT neurons are in layer VI (0% layer II/III, 20% layer V, 79% layer VI). These data are consistent with anatomical studies, as corticostriatal projection neurons reside in layers II/III and V in rats, whereas layer VI is specific for corticothalamic neurons27,28. Furthermore, using a retrograde rabies-tracing strategy to sparsely label PFC-NAc or PFC-PVT neurons as well as their afferent inputs, we found that these cell populations have both shared and unshared afferent connectivity (Extended Data Fig 6). Finally, PFC-NAc and PFC-PVT neurons express CaMKii (Extended Data Fig. 7a–d), collectively revealing that these neurons make up two non-overlapping subpopulations of CaMKii-expressing projection neurons.
We next targeted PFC-NAc and PFC-PVT neurons for in vivo two-photon calcium imaging. Cre-inducible GCaMP6s (AAVdj-DIO-GCaMP6s) was injected into dorsomedial PFC, and in the same surgery a retrogradely transported virus, canine adenovirus-2 encoding cre-recombinase (Cav2-cre), was injected into either the NAc or PVT (Figure 2a,g). This resulted in projection-specific GCaMP6s expression in PFC-NAc and PFC-PVT neurons (Figure 2b,h; Extended Data Fig. 7e–j). Next, mice underwent Pavlovian conditioning with simultaneous head-fixed two-photon calcium imaging. Data revealed that after learning, but not before learning, PFC-NAc neurons primarily displayed excitation to the CS+, whereas fewer neurons responded to the CS− (Figure 2c–e; Extended Data Fig. 3c,d). In contrast, PFC-PVT neurons primarily displayed inhibition to the CS+ after learning, whereas fewer neurons responded to the CS− (Figure 2i–k; Extended Data Fig. 3e,f). Finally, we found that activity in either PFC-NAc neurons (Figure 2f) or PFC-PVT neurons (Figure 2l) could be used to decode whether the CS+ or CS− was presented on any given trial after learning.
Figure 2. PFC projection neurons have opposing responses to reward-predictive cues.
a,b, Viral strategy (a) allowed recordings of PFC-NAc::GCaMP6s neurons (Early, n=84 neurons; Late, n=101 neurons; n=4 mice) in vivo (b). c,d, Population heat plots showing responses for all PFC-NAc::GCaMP6s neurons averaged across CS− trials (c) and CS+ trials (d) after learning. e, Population data of all PFC-NAc::GCaMP6s neurons showing no difference in CS+ versus CS− responses during early sessions (top; χ2(2)=0.88, p>0.6); however, these responses were different during late sessions (bottom; χ2(2)=41.06, p<0.001). f, CDF plots showing that the dynamics of individual PFC-NAc::GCaMP6s neurons could be used to accurately decode whether the CS+ or CS− was presented in late conditioning sessions (compared to late shuffled: Welch’s t(178.66)=5.63, p<0.001), but not in the early conditioning sessions (compared to early shuffled: Welch’s t(165.47)=1.13, p>0.2). g,h, Viral strategy (g) allowed recordings of PFC-PVT::GCaMP6s neurons (Early, n=92 neurons; Late, n=123 neurons; n=3 mice) in vivo (h). i,j, Population heat plots showing responses for all PFC-PVT::GCaMP6s neurons averaged across CS− trials (i) and CS+ trials (j) after learning. k, Population data of all PFC-PVT::GCaMP6s neurons showing no difference in CS+ versus CS− responses during early sessions (top; χ2(2)=2.02, p>0.35); however, these responses were different during late sessions (bottom; χ2(2)=43.86, p<0.001). l, CDF plots showing that the dynamics of individual PFC-PVT::GCaMP6s neurons could be used to accurately decode whether the CS+ or CS− was presented during late conditioning sessions (compared to late shuffled: Welch’s t(212.01)=6.03, p<0.001) but not during the early conditioning sessions (compared to early shuffled: Welch’s t(180.89)= −0.56, p>0.5). Vertical dotted lines refer to timing of sucrose delivery. Scale bars=100µm; CDF, cumulative distribution frequency; CS, conditioned stimulus; EarlySh, early shuffled; LateSh, late shuffled.
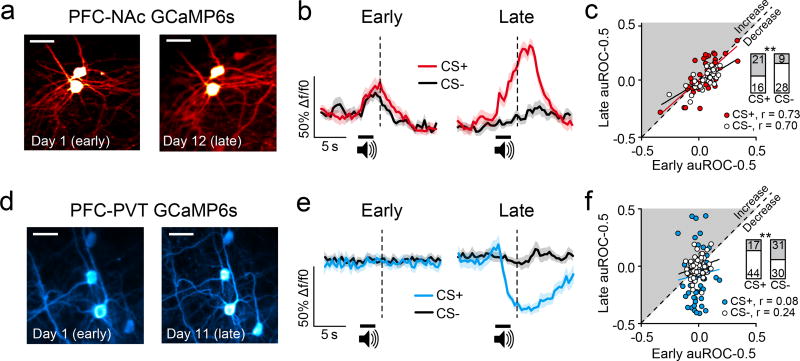
We found that PFC-NAc neurons and PFC-PVT neurons show distinct cue encoding profiles after learning, but how these response properties emerge across learning was unclear. To examine this, we identified individual PFC-NAc and PFC-PVT neurons whose activity could reliably be monitored throughout training (Figure 3a,d). We found that many PFC-NAc neurons initially displayed low amplitude, phasic calcium transients to both the CS− and CS+, such that there was little cue discrimination (Figure 3b). However, across learning the responses of individual PFC-NAc neurons became selective, such that responses to the CS+ were amplified, whereas responses to the CS− were diminished (Figure 3b,c). In contrast to this response tuning in PFC-NAc neurons, PFC-PVT neurons showed little response to either the CS+ or CS− before learning, but instead many neurons acquired new inhibitory responses after learning (Figure 3e,f). Thus, responses of PFC-NAc, but not PFC-PVT, neurons after learning could be predicted based on responses before learning (Figure 3c,f, correlations). Collectively, corticostriatal and corticothalamic neurons showed distinct functional plasticity across appetitive learning, such that PFC-NAc neurons adjusted their activity to allow cue discrimination, whereas PFC-PVT neurons gradually acquired responses for cue discrimination.
Figure 3. PFC projection neurons show distinct functional plasticity across learning.
a, Representative images show the same PFC-NAc::GCaMP6s neurons tracked from early (left) to late (right) sessions (n=37 neurons; n=4 mice). b, Traces from individual example neurons averaged across trials during early (left) and late (right) sessions. c, Cue responses of PFC-NAc::GCaMP6s neurons during early conditioning sessions could be used to predict responses during late conditioning sessions (CS+, r=0.73, p<0.001; CS−, r=0.70, p<0.001). c,inset, Bar graphs showing that most PFC-NAc::GCaMP6s neurons showed elevated (gray) GCaMP6s fluorescence to the CS+ across learning, and reduced (white) GCaMP6s fluorescence to the CS− across learning (χ2(1)=8.07; p<0.005). d, Representative images show the same PFC-PVT::GCaMP6s neurons tracked from early (left) to late (right) sessions (n=61 neurons; n=3 mice). e, Traces from individual example neurons averaged across trials during early (left) and late (right) sessions. f, Cue responses of all PFC-PVT::GCaMP6s neurons during early Pavlovian conditioning sessions could not be used to predict subsequent responses during late conditioning sessions (CS+, r=0.08, p>0.05; CS−, r=0.24, p>0.05). f,inset, Bar graphs showing that most PFC-PVT::GCaMP6s neurons showed reduced (white) GCaMP6s fluorescence to the CS+ across learning, whereas equivalent numbers of neurons showed elevated (gray) and reduced (white) GCaMP6s fluorescence to the CS− across learning (χ2(1)=6.73, p<0.01). Vertical dotted lines refer to timing of sucrose delivery. Scale bars=25µm; CS, conditioned stimulus.
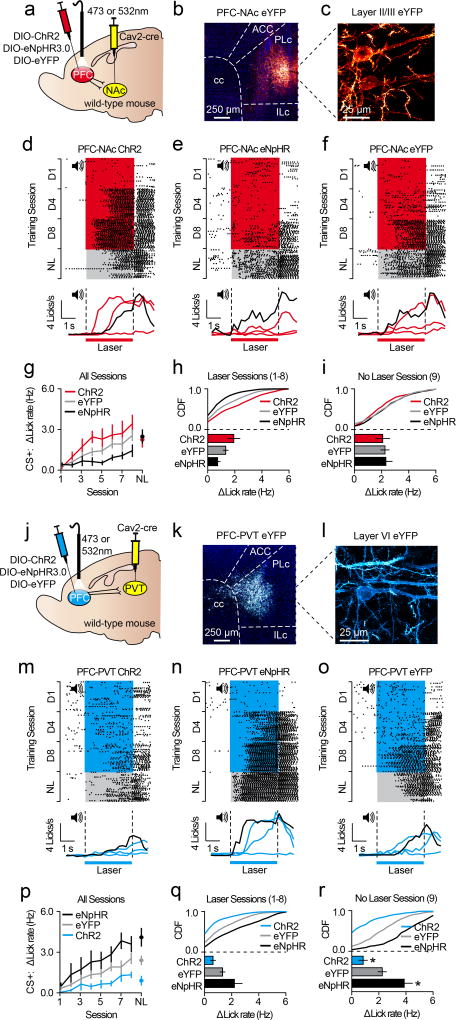
Our data reveal that projection-specific PFC neurons show distinct cue encoding properties across appetitive learning. However, whether this activity controls the acquisition of conditioned reward seeking is unclear. To test this, we targeted PFC-NAc or PFC-PVT neurons for optogenetic manipulation by injecting Cav2-cre into the NAc or PVT, and cre-inducible channelrhodopsin-2 (AAV5-DIO-ChR2-eYFP), halorhodopsin (AAV5-DIO-eNpHR3.0-eYFP), or control (AAV5-DIO-eYFP) into dorsomedial PFC (Figure 4a–c, j–l). Next, we optogenetically manipulated these cells during cue delivery throughout Pavlovian conditioning (sessions 1–8; Figure 4d–f, m–o), and tested the effects on acquisition of this task during a subsequent test without laser. Data reveal that activation (in PFC-NAc::ChR2 mice) or inactivation (in PFC-NAc::eNpHR3.0 mice) of PFC-NAc neurons did not influence CS+-evoked anticipatory licking during the no-laser test (Figure 4g–i), implying that these cells do not control the acquisition of anticipatory licking. In contrast, optogenetic activation of PFC-PVT neurons (in PFC-PVT::ChR2 mice) reduced CS+-evoked anticipatory licking during the no-laser test, whereas optogenetic inactivation of PFC-PVT neurons (in PFC-PVT::eNpHR mice) increased anticipatory licking during the no-laser test (Figure 4p–r). Thus, inhibitory cue encoding in PFC-PVT neurons, but not PFC-NAc neurons, contributes to the acquisition of conditioned reward seeking.
Figure 4. Activity in corticothalamic neurons controls acquisition of conditioned reward seeking.
a–c, Viral strategy (a) for PFC-NAc optogenetics experiments resulted in eYFP expression in PFC-NAc neurons (b,c). d–f, Example perievent rasters (top) and histograms (bottom; red lines refer to laser sessions (D1, D4, D8) and black line refers to no-laser test) from PFC-NAc::ChR2 (n=5), PFC-NAc::eNpHR (n=6), and PFC-NAc::eYFP mice (n=10). g, Line graph showing CS+ lick rate during conditioning (with laser) and test (no laser). h,i, CDF plots and bar graphs showing CS+ lick rate during conditioning (h) and test (i). No differences were observed between PFC-NAc groups during the no-laser test (ChR2 vs. eYFP: auROC=0.43; p=0.48; eNpHR vs. eYFP: auROC=0.51, p=0.48). j–l, Viral strategy (j) for PFC-PVT optogenetics experiments resulted in eYFP expression in PFC-PVT neurons (k,l). m–o, Example perievent rasters (top) and histograms (bottom; blue lines refer to laser sessions (D1, D4, D8) and black line refers to no-laser test) from a PFC-PVT::ChR2 (n=6), PFC-PVT::eNpHR (n=5), or PFC-PVT::eYFP mouse (n=10). p, Line graph showing average CS+ lick rate during all conditioning sessions (with laser) and test (no laser). q,r, CDF plots and bar graphs showing CS+ lick rate during all laser sessions (q), and during the no laser test (r). CS+ lick rate was reduced in PFC-PVT::ChR2 mice (vs. PFC-PVT::eYFP mice: auROC=0.09, p=0.01) and enhanced in PFC-PVT::eNpHR mice (vs. PFC-PVT::eYFP mice: auROC=0.84, p=0.02). Line and bar graphs represent the mean±SEM. ACC, anterior cingulate cortex; cc, corpus callosum; CDF, cumulative distribution frequency; ILc, infralimbic cortex; NL, no-laser test; PLc, prelimbic cortex.
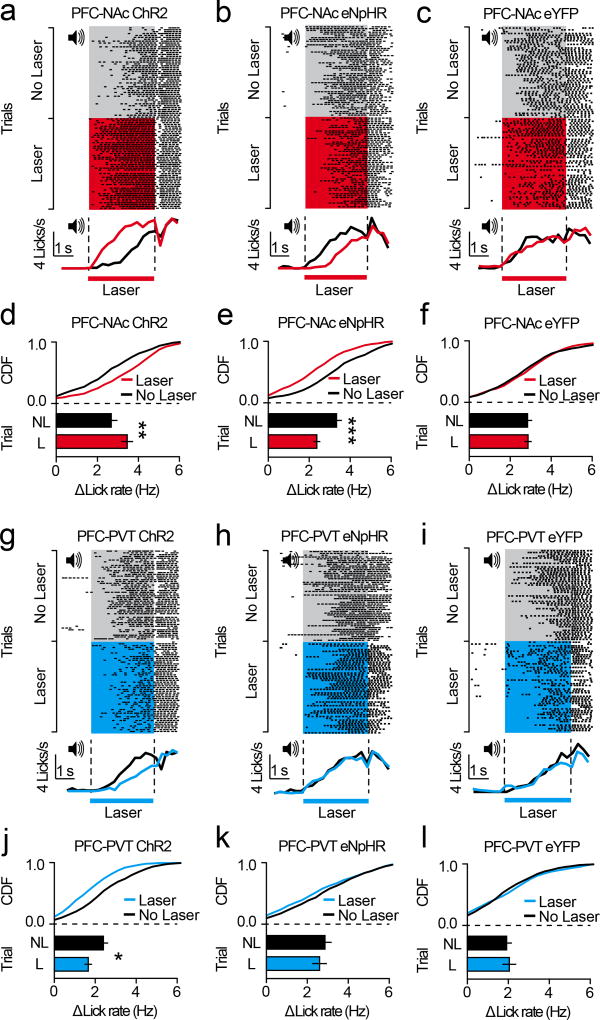
Although activity in PFC-NAc neurons did not control the acquisition of conditioned reward seeking, differences in licking behavior were apparent between groups during the laser conditioning sessions (sessions 1–8; see Figure 4g,h). Thus, one possibility is that PFC-NAc neurons control the expression of conditioned reward seeking, rather than acquisition. To test this directly, we next performed the optogenetic manipulations after conditioning in separate groups of mice. We found that optogenetic activation of PFC-NAc neurons during the CS+ increased anticipatory licking (Figure 5a,d; Figure 5c,f), whereas inactivation of PFC-NAc neurons reduced anticipatory licking (Figure 5b,e; Figure 5c,f). In contrast, optogenetic activation of PFC-PVT neurons during the CS+ reduced anticipatory licking (Figure 5g,j; Figure 5i,l) whereas inactivation of PFC-PVT neurons had no effect (Figure 5h,k; Figure 5i,l). The lack of effect for PFC-PVT inactivation is likely due to CS+-evoked inhibition of these cells (see Figures 2 and 3), as neuronal hyperpolarization from sub-threshold potentials should not result in further adjustment of neuronal output. Collectively, activation of PFC-NAc neurons and inhibition of PFC-PVT neurons supports the expression of conditioned reward seeking.
Figure 5. Activity in corticostriatal and corticothalamic neurons controls expression of conditioned reward seeking.
a–c, Example perievent rasters (top) and histograms (bottom) from PFC-NAc::ChR2 (n=5), PFC-NAc::eNpHR (n=5), and PFC-NAc::eYFP mice (n=8). d–f, CDF plots and bar graphs showing that the laser increased CS+ licking for PFC-NAc::ChR2 mice (vs. PFC-NAc::eYFP: auROC=0.74, p=0.006) and reduced CS+ licking for PFC-NAc::eNpHR mice (vs. PFC-NAc::eYFP: auROC=0.18, p<0.001). g–i, Example perievent rasters (top) and histograms (bottom) from PFC-PVT::ChR2 (n=5), PFC-PVT::eNpHR (n=5), and PFC-PVT::eYFP mice (n=6). j–l, CDF plots and bar graphs showing that the laser decreased CS+ licking for PFC-PVT::ChR2 mice (vs. PFC-PVT::eYFP: auROC=0.26, p=0.02), whereas no effect of laser was observed for PFC-NAc::eNpHR mice (vs. PFC-PVT::eYFP: auROC=0.37, p=0.11). Bar graphs represent the mean±SEM. CDF, cumulative distribution frequency.
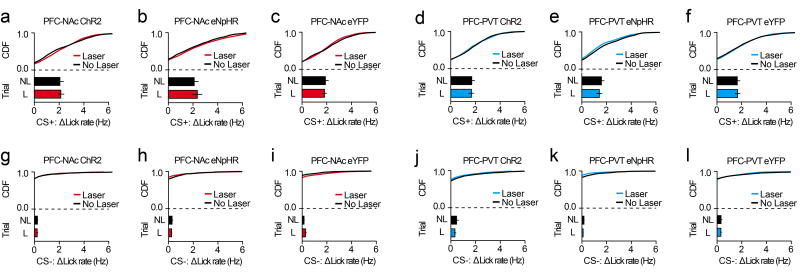
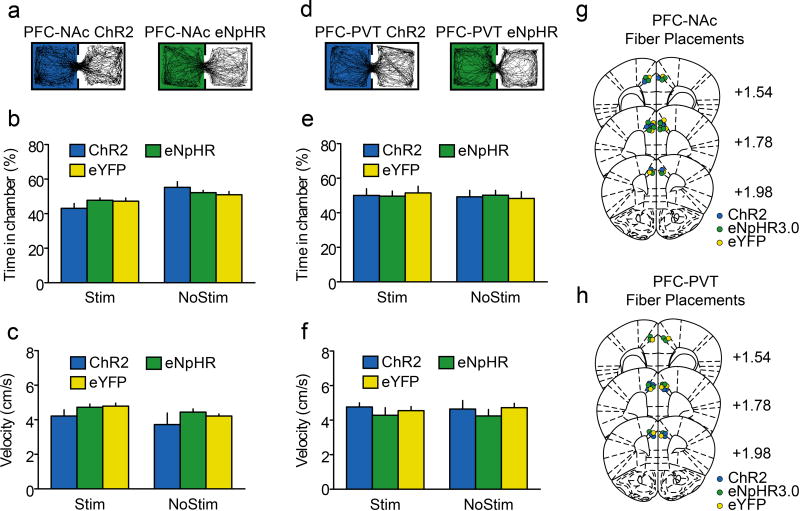
In addition to encoding the reward-predictive stimulus after learning, some PFC-NAc and PFC-PVT neurons displayed CS− encoding (see Figure 2). Considering this, we also evaluated how projection-specific cells influenced licking during the CS−. We found that optogenetic perturbations of PFC-NAc and PFC-PVT neurons during the CS− did not influence the acquisition of CS− licking (Extended Data Fig. 8a–f). In contrast, inactivation but not activation of PFC-NAc neurons reduced the expression of CS− licking, whereas optogenetic manipulations of PFC-PVT neurons had no effect on the expression of CS− licking (Extended Data Fig. 8g–l). Moreover, optogenetic manipulation of PFC-NAc or PFC-PVT neurons during random time epochs outside of cue delivery had no effect on licking (Extended Data Fig. 9), nor did optogenetic manipulations produce a real-time place preference or aversion (Extended Data Fig. 10). Thus, activity in PFC-NAc and PFC-PVT neurons specifically during the cue period is critical for conditioned reward seeking.
Here we found that the opposing population dynamics of prefrontal output circuits orchestrates conditioned reward seeking. In addition to divergent population encoding, subsets of cells in both corticostriatal and corticothalamic circuits have response profiles that are opposite to the population overall (i.e., some PFC-NAc neurons have inhibitory CS+ responses, whereas some PFC-PVT cells have excitatory CS+ responses). Although the cause and function of such heterogeneity is unclear, it is possible that subpopulations of cells within each group may have distinct cell-type specific targets, afferent inputs, and spatial locations. Thus, while it remains unclear how all cells in PFC function to orchestrate reward seeking, our data suggest that projection-specific and anatomically segregated prefrontal neurons can have opposing activity dynamics, plasticity profiles, and functional control of conditioned reward seeking.
Methods
Subjects and surgery
Adult male C57BL/6J mice (Jackson Laboratories) or Ai9 reporter mice (Cg-Gt(ROSA)26Sortm9(CAG-tdTomato)HzeIJ; Jackson Laboratories) were group housed (25–35g; 6–8 weeks old) with littermates until surgery. For all experiments, mice underwent surgery during which they were anesthetized with 0.8–1.5% isoflurane vaporized in pure oxygen (1L/min) and placed within a stereotactic frame (David Kopf Instruments). Ophthalmic ointment (Akorn) and a topical anesthetic (2% Lidocaine; Akorn) were applied during surgeries, and subcutaneous injections of sterile saline (0.9% NaCl in water) were administered to prevent dehydration. During surgeries, virus injections were administered unilaterally (for two-photon microscopy experiments) or bilaterally (for optogenetics or anatomical experiments) targeting dorsal medial PFC (specifically prelimbic cortex; 500nl/side; relative to bregma: AP, +1.85mm; ML, ±0.60mm; DV, −2.50mm), bilaterally targeting NAc (500nl/side; relative to bregma: AP, +1.42mm; ML ±0.73mm; DV, −4.80mm), and/or on the midline targeting PVT (300nl; relative to bregma: AP, −1.46mm; ML −1.13mm; DV, −3.30mm; 20° angle). The UNC Vector Core packaged all viruses except canine adenovirus-2 encoding cre (Cav2-cre; Institut de Génétique Moléculaire de Montpellier, France). For two-photon imaging experiments, an optical cannula (Inscopix, CA) was implanted above the PFC injection site (relative to bregma: AP, +1.85mm; ML −0.8mm; DV, −2.2mm; see Resendez et al., 2016 for details using similar surgical protocols for imaging experiments)29. For optogenetic experiments, custom-made optical fibers30 were implanted bilaterally ~0.5mm above the PFC injection sites (relative to bregma: AP, +1.85mm; ML ±0.83mm; DV, −1.93mm; 10° angle). For experiments involving head-fixed behavior, a custom-made ring (stainless steel; 5mm ID, 11mm OD) was attached to the skull during surgery to allow head fixation (see Figure 1a). Following surgeries, mice received acetaminophen in their drinking water for two days, and were allowed to recover with access to food and water ad libitum for at least 21 days. After recovery, mice were water restricted (water bottles taken out of the cage), and 0.6mL of water was delivered every day to a dish placed within each home cage. Behavioral experiments began when mice weighed less than 90% of free drinking weight (~10 days for all experiments). To ensure good health and weight maintenance, mice were weighed and handled daily. This protocol resulted in weight stabilization between 85–90% of free-drinking weight during each experiment. No mouse was given more or less than 0.6mL of water for weight concerns during water restriction procedures, nor did any health problems related to dehydration arise at any point from these protocols. All experimental procedures were performed in accordance with the Guide for the Care and Use of Laboratory Animals (National Institutes of Health), and were approved by the Institutional Animal Care and Use Committee at the University of North Carolina a priori.
Head-fixed behavior
Following recovery from surgery, mice were habituated to head fixation for 3 days, during which unpredictable drops of sucrose (10% sucrose in water; 2.0–2.5µL) were delivered intermittently for one hour (~60 drops/hour) through a gravity-driven, solenoid-controlled lick tube. Once the mice displayed sufficient licking (>1000 licks per session), they underwent Pavlovian conditioning. During each conditioning session, two cues (3kHz pulsing or 12kHz constant tones, 2 seconds, 70dB) were randomly presented 50 times before the delivery of sucrose (CS+, 10% sucrose in water; 2.0–2.5µL) or no sucrose (CS−), such that there was a one second trace interval between delivery of the CS+ and sucrose (see Figure 1b). The cue contingencies were counterbalanced across cohorts of mice to ensure that mice acquired conditioned licking in response to either tone when paired with sucrose. The inter-trial interval between the previous reward delivery (CS+) or withholding time (CS−) and the next cue was chosen as a random sample from a uniform distribution bounded by 40s and 80s. Cue discrimination was quantified using the area under a Receiver Operating Curve (auROC) formed by the number of licks during the CS+ versus CS− trace intervals. For both two-photon and optogenetic behavioral experiments, we classified sessions as ‘Early’ or ‘Late’ in learning, defined by both behavioral performance (Early, auROC < 0.65; Late, auROC > 0.66) and session number (Early, sessions 1–5; Late, sessions 7 or later). These criteria were used as post-hoc analysis revealed that an auROC > 0.66 approximates high performance in a phase space formed by behavioral performance across sessions. Finally, behavioral data is displayed and analyzed throughout the manuscript as the change in lick rate (“ΔLick Rate”) between each 3-second cue period and 1-second baseline period (baseline period is immediately before each cue). In addition, we show raw lick rates during both the cue and baseline periods for all imaging experiments (see Extended Data Fig 1). Baseline lick rates remained relatively low across all experiments, and therefore for optogenetics studies only “ΔLick Rate” is shown and analyzed (see Figures 4, Figure 5; Extended Data Fig. 8, Extended Data Fig. 9).
Two-photon microscopy
Experimental design
Two-photon microscopy was used to visualize activity dynamics of PFC neurons in vivo. A virus encoding the calcium indicator GCaMP6s18 (AAVdj-CaMKiiα -GCaMP6s; 5.3×10¹² infectious units/mL) was injected into PFC (see subjects and surgery). For imaging projection-specific neurons, a virus encoding the cre-dependent calcium indicator GCaMP6s (AAVdj-ef1α-DIO-GCaMP6s; 3.1×10¹² infectious units/mL; from Karl Deisseroth) was injected into PFC, and the retrogradely transported canine adenovirus encoding cre-recombinase31,32 was injected into either NAc or PVT (Cav2-cre; 4.2×10¹² infectious units/mL). After a minimum of 8 weeks to allow virus transport and infection, mice underwent Pavlovian conditioning during which GCaMP6s-expressing neurons were visualized using two-photon microscopy.
Data acquisition, signal extraction, and analysis
A two photon microscope (FVMPE-RS) was equipped with the following to allow imaging of PFC in vivo: a hybrid scanning core set with galvanometers and fast resonant scanners (allows up to 30Hz frame-rate acquisition; set to 2.5 Hz), multi-alkali PMT and GaAsP-PMT photo detectors with adjustable voltage, gain, and offset features, a single green/red NDD filter cube, a long working distance 20× air objective designed for optical transmission at infrared wavelengths (Olympus, LCPLN20XIR, 0.45NA, 8.3mm WD), a software-controlled modular XY stage loaded on a manual z-deck, and a tunable Mai-Tai Deep See laser system (Spectra Physics, laser set to 955nm, ~100fs pulse width) with automated four-axis alignment. Before each conditioning session, a particular field of view (FOV) was selected by adjusting the imaging plane (z-axis), and each FOV was spaced at least 50µm from one another to prevent visualization of the same cells across multiple FOVs. During each conditioning session, two-photon scanning was triggered for each trial 7s before cue delivery, and a 20s video was then collected for each trial. Data were both acquired and processed using a computer equipped with FluoView (Olympus, FV1200) and cellSens (Olympus) software packages. Following data acquisition, videos were motion corrected using a planar hidden Markov model (SIMA v1.3)33 and regions of interest (ROIs) were hand drawn around each cell using the standard deviation projection of the motion-corrected video using ImageJ. Next, calcium transient time series data were extracted with SIMA and analyzed using custom Python data analysis pipelines written in the lab (by VMN). For analysis, data were split into two groups (Early and Late) that were defined based on behavioral performance and the day of conditioning (see head-fixed behavior). Next, each recorded neuron was defined as having an excitatory response, inhibitory response, or no response. Significant responses represent significant two-tailed auROC comparing average fluorescence (Δf/f) of the trace interval (1s after CS offset) versus baseline (1s before CS onset) where p<0.05 after Benjamini-Hochberg false discovery rate correction. Each p-value for auROC was defined by calculating the p-values for the corresponding Mann-Whitney U statistic. Chi-squared tests were then used to compare the number of CS+ responders to CS− responders for each group. For additional decoding analysis (e.g. Figure 2f,l), we tested whether the identity of the cue on any given trial could be decoded from the mean trace interval response on that trial using support vector machines. To this end, we used the Python module, scikitlearn, with GridSearchCV and a support vector classification (SVC) estimator with a radial basis function kernel, optimizing across the following parameters: γ: {10−2, 10−1, 100, 101, 102}, C: {10−2, 10−1, 100, 101, 102}. Quantification of performance was done using 10-fold validation34 For each neuron, the highest accuracy score across these parameters was used as the metric of accuracy. In order to determine whether the population of accuracy scores across all neurons was significantly different from that expected by chance, we performed a single shuffle per neuron by randomizing the cue identity on every trial. The population of shuffled accuracy scores across one shuffle was then compared to the population of unshuffled accuracy scores using a two-tailed Welch's t-test. Note that since the metric of accuracy was optimized across parameters, the mean accuracy score expected by chance is not 0.5, but is instead closer to 0.55 (Figure 2f,l and Extended Data Fig. 4d). We also further tested whether the mean activity during the trace interval on a given trial for one neuron could be used to decode the number of licks in the trace interval. This was performed using support vector regression (SVR) in scikitlearn with GridSearchCV with a radial basis function kernel, optimizing across the following parameters: C: 5 logarithmically equidistant points between 10−3 and 103 {10−3, 3.16×10⁻², 100, 3.16×10², 103}, ε: 5 logarithmically equidistant points between 10−3 and 103 {10−3, 3.16×10⁻², 100, 3.16×10², 103}, γ: 10 logarithmically equidistant points between 10−6 and 106 {10−6, 2.15×10⁻⁵, 4.64×10⁻⁴, 10−2, 2.15×10⁻¹, 4.64, 102, 2.15×10³, 4.64×10⁴, 106}. Quantification of performance was done using 10-fold validation of the R2 metric (note that this metric can be infinitely negative, indicating arbitrarily poor performance, but is bounded on the positive end at 1, indicating perfect decoding). We found that as a population, the number of anticipatory licks during the trace interval could not be decoded in the late sessions in CaMKii-expressing neurons (mean R2=−1.21), PFC-NAc neurons (mean R2=−0.92) or PFC-PVT neurons (mean R2=−0.39). These negative numbers reflect the absence of a relationship between licking and calcium activity in each cell population.
Optogenetics
Behavioral optogenetics were performed as described in detail (see Sparta et al., 2011)30. Briefly, during surgery a virus encoding cre-inducible channelrhodopsin-2 (AAV5-EF1α-DIO-hChR2(H134R)-eYFP; 5.0×10¹² infectious units/mL), halorhodopsin (AAV5-EF1α-eNpHR3.0-eYFP; 8.0×10¹² infectious units/mL), or control (AAV5-EF1α-eYFP; 6.0×10¹² infectious units/mL) was injected into PFC; and the retrogradely transported canine adenovirus encoding cre-recombinase31,32 was injected into either NAc or PVT (Cav2-cre; 4.2×10¹² infectious units/mL). After a minimum of 8 weeks to allow sufficient virus transport and infection, mice underwent Pavlovian conditioning.
For acquisition experiments (e.g., Figure 4), mice underwent 8 daily conditioning sessions with laser followed by a test session (no laser). For photoactivation manipulations in ChR2 or control mice, the laser (473nm; 8–10mW) was turned on for 5ms pulses (20Hz) during 80% of the cue trials, starting at the cue onset and ending at the reward delivery. For photoinhibition manipulations in eNpHR3.0 or control mice, the laser (532nm; 8–10mW) did not pulse. Because there was no effect of laser in the control mice, these data were collapsed across PFC-NAc and PFC-PVT groups. For expression experiments (e.g., Figure 5), after mice reached high performance criterion (‘Late’, auROC>0.66), they underwent 6 daily conditioning sessions. Furthermore, every other session was selected for optogenetic manipulations, during which the laser was presented for 3s during either the cue and trace interval or at random time epochs outside of cue or reward delivery. Because there was no effect of laser in the ChR2 or eNpHR3.0 control mice, these data were collapsed for PFC-NAc groups and PFC-PVT groups. In addition, for expression experiments subsets of control mice were used twice, once as ChR2 controls (blue light), and again as eNpHR3.0 controls (green light). Following experiments, histological verification of fluorescence and optical fiber placements were performed as described previously35.
Behavioral data (ΔLick Rate, see above) was analyzed based on a priori comparisons of interest (effect of laser on ChR2/eNpHR animals versus effect of laser in eYFP animals). For acquisition experiments (Figure 4; Extended Data Fig. 8a–f), we analyzed data from the no laser test day only, and specifically compared the ΔLick Rate between the ChR2 or eNpHR groups versus the eYFP group. To correct for the double comparison (ChR2 or eNpHR versus eYFP), we performed a Benjamini-Hochberg multiple comparisons correction. For expression experiments (Figure 5; Extended Data Fig. 8 g–l; Extended Data Fig. 9), in each pair of sessions (no laser, laser) we calculated the difference in mean lick rate between the two in order to obtain a statistical measure of the “effect of laser” per session pair. Next, we compared the effects of laser from the ChR2 or eNpHR groups versus the corresponding effect of laser in the eYFP group. To correct for the double comparison (ChR2 or eNpHR versus eYFP), we again performed a Benjamini-Hochberg multiple comparisons correction. Considering this, for optogenetics experiments all p-values (which are two-tailed throughout the manuscript) have been corrected for multiple comparisons.
Retrograde tracing
The anatomy and electrophysiological properties of PFC-NAc and PFC-PVT neurons were evaluated through retrograde tracing36. Specifically, during surgeries the retrograde tracer cholera toxin subunit B conjugated to Alexa Fluor (CtB-488, CtB-594; Molecular Probes) was injected bilaterally into NAc (500nl/side) and on the midline in PVT (300nl; color counterbalanced across mice). Ten days following surgery, animals were sacrificed for histology (n=3 mice) or slice electrophysiology (n=3 mice). For anatomical experiments, a student blind to all experiments (E.P.M.) and conditions counted the number of CtB-488 positive, CtB-594 positive, and double-positive neurons in prelimbic medial prefrontal cortex (a subregion of dorsal medial PFC). The distance of each cell from the midline and the layer specificity of each cell were then measured using ImageJ. For electrophysiological experiments, mice were euthanized ten days following surgeries for patch-clamp recordings ex vivo (see below for details).
Rabies tracing
The monosynaptic afferents to PFC-NAc and PFC-PVT neurons were identified using a glycoprotein-deleted rabies strategy37 in combination with Cav2-cre targeting of projection-specific neuron populations. Specifically, during the first surgery a cocktail containing the cre-dependent starter viruses encoding the G-protein and TVA were injected into PFC (3:1 of AAV5-FLEX-RG and AAV5-FLEX-TVA-mCherry; 300nl/side), and Cav2-cre was injected into either NAc (500nl/side) or PVT (300nl). Five weeks later, mice were given a second surgery in which the G-deleted rabies virus was injected into PFC (1:5 diluted EnvA-Rabies-GFP). Finally, 8 days after the rabies injection each mouse (n=3/group) was sacrificed for histology and cell quantification. Our rabies protocol led to sparse labeling of PFC projection neurons, allowing quantification of individual cells in each brain section (40µm thick). Each ROI was selected based on previous PFC tracing experiments38, as well as the fluorescence intensity observed in our experiments. Next, out of all tissue collected for each ROI in each mouse, we selected the 3 sections containing the most cells per region, and used confocal microscopy to get cellular-resolution images of all cells in each of those sections. For each section, we quantified all individual input neurons (GFP+) and starter cells (both GFP+ and mCherry+). Considering that the anterior cingulate cortex (ACC) was close to the PFC injection site, some sections containing ACC also had starter cell labeling. Thus, because we were interested in long-range inputs from ACC only, only sections that did not have mCherry labeling were used for ACC input quantification. Finally, rabies-tracing data were analyzed by comparing the number of cells in each section across groups (raw neuron count), and by comparing the percentage of input neurons per starter cell for each particular mouse.
Patch-clamp electrophysiology
Mice were anesthetized with pentobarbital (50mg/kg) before transcardial perfusion with ice-cold sucrose cutting solution containing the following (in mM): 225 sucrose, 119 NaCl, 1.0 NaH2P04, 4.9 MgCl2, 0.1 CaCl2, 26.2 NaHCO3, 1.25 glucose, 305 mOsm. Brains were then rapidly removed, and coronal sections 300µm thick were taken using a vibratome (Leica, VT 1200). Sections were then incubated in aCSF (32°C) containing the following (in mM): 119 NaCl, 2.5 KCl, 1.0 NaH2P04, 1.3 MgCl, 2.5 CaCl2, 26.2 NaHCO3, 15 glucose, ~306 mOsm. After an hour of recovery, slices were constantly perfused with aCSF (32°C) and visualized using differential interference contrast through a 40× water-immersion objective mounted on an upright microscope (Olympus BX51WI). Whole-cell recordings were obtained using borosilicate pipettes (3–5 ΜΩ) back-filled with internal solution containing the following (in mM): 130 K gluconate, 10 KCl, 10 HEPES, 10 EGTA, 2 MgCl2, 2 ATP, 0.2 GTP (pH 7.35, 270–285 mOsm).
Current-clamp recordings were obtained from GCaMP6s-expressing neurons to identify how action potential frequency correlated with GCaMP6s fluorescence. Specifically, to determine how elevations in action potential frequency influence GCaMP6s fluorescence, a 1 second train of depolarizing pulses (2nA, 2ms) was applied at a frequency of 1, 2, 5, 10, or 20Hz. To determine how attenuations in action potential frequency influence GCaMP6s fluorescence, a 3 second pause was applied after a 10 second baseline train of depolarizing pulses (2nA, 2ms; 1, 2, 5, 10, or 20Hz). Finally, to determine if hyperpolarization influences GCaMP6s fluorescence in the absence of action potential frequency modulation, a 3 second hyperpolarizing step (150pA) was applied in neurons that were held either below or above resting membrane potential. During electrophysiological recordings, GCaMP6s fluorescence dynamics were visualized using a mercury lamp (Olympus, U-RFL-T) and microscope-mounted camera (QImaging, optiMOS). Imaging data were acquired using Micro-Manager, and extracted through hand-drawn ROIs for each recorded neuron using ImageJ.
Current-clamp recordings were also obtained to identify the intrinsic properties of PFC-NAc and PFC-PVT neurons in retrograde tracing experiments, as previously described39. First, action potential firing was examined by applying a series of long depolarizing sweeps (800ms) at +25pA steps (0–450pA). Next, rheobase (the minimum amount of current required for an action potential to fire) was measured by applying a series of short depolarizing sweeps (50ms) at +10pA steps (starting at 0pA) until the recorded neuron fired an action potential. For all patch-clamp experiments, data acquisition occurred at 1 kHz sampling rate through a MultiClamp 700B amplifier connected to a Digidata 1440A digitizer (Molecular Devices). Data were analyzed using Clampfit 10.3 (Molecular Devices).
Data Collection
The nature of all imaging and behavioral experiments yields high-power data sets, as we can test responses to reward-predictive cues hundreds of times within a single session. Thus, although the experiments themselves require rigorous experimentation, the number of mice that are required for each experiment is generally 3–6 per group, depending on the effect size (which was not predetermined for these experiments). Mice were randomly picked for each group in each experiment, by alternating the surgery for each mouse in a cage. During data collection, investigators were only blind to the conditions for rabies tracing cell counting and CtB cell counting. The only mice excluded from final analysis were those that died before or during the experiments (n=3). For optogenetics experiments, mice were excluded if histology confirmed ectopic virus expression outside of PFC (n=1), or if cannula placements were not in dorsomedial PFC (n=0). For data analysis, equal variance was not assumed for behavioral optogenetics or imaging datasets. Equal variance was deemed equivalent and was therefore not assumed for cell counting experiments and electrophysiological experiments.
Code and Data Availability
We used Python (codes written by VMN) to analyze imaging and optogenetics datasets included in this manuscript (see Figures 1–5). That data, as well as the codes used for analysis, are openly available online: <https://github.com/stuberlab>. All other data are available upon request from the corresponding author.
Extended Data
Extended Data Figure 1. Mice used for imaging experiments acquired cue-specific anticipatory licking across conditioning.
a, Average lick rate during the 1-second baseline period (immediately before each cue delivery) for all imaging experiments (Early, n=30; Late n=30). b, Average lick rate during each cue (rather than the change in lick rate presented in the main figures) for all imaging experiments (Early, n=30; Late n=30). c, Individual behavioral discrimination (licking during CS+ versus CS−; auROC-0.5) scores during early and late conditioning sessions for all imaging sessions used in this manuscript (Early, n=30; Late, n=30; t(58)=43.0, p<0.001). Line graphs represent the mean±SEM. These data are presented in a summarized form in Figure 1d and 1e.
Extended Data Figure 2. Elevations and reductions in GCaMP6s fluorescence track action potential frequency but not voltage per se.
a, Virus injections of AAVdj-CaMKii-GCaMP6s into dorsomedial PFC allowed subsequent whole-cell patch-clamp slice recordings of GCaMP6s-expressing neurons. Coronal cartoon redrawn based on Paxinos and Watson, 200740. b,c, Example traces showing GCaMP6s fluorescence (b) during current-clamp recordings (c), in the absence (left) and presence (right) of action potentials (n=8 neurons; n=2 mice). d, Grouped data revealing that hyperpolarization resulted in negative GCaMP6s fluorescence deflections in the presence of baseline action potentials, but not in the absence of baseline action potentials (interaction: F(1,14)=20.0; p<0.001; post-hoc tests: baseline APs, p>0.4; no baseline APs, p<0.001). e, Example traces showing a series of depolarizing pulses (1–20Hz) applied in current clamp mode to drive trains of action potentials (bottom), during which GCaMP6s fluorescence was tracked in recorded neurons (top; n=12 neurons; n=2 mice). f, Action potential generation resulted in linear elevations in GCaMP6s fluorescence (r=0.776, p<0.001), such that a single action potential was detectable (red waveform; peak=12.6±4.0% Δf/f). g, A series of baseline depolarizing pulses (1–20Hz) was applied before and after a 3 second pause (n=7 neurons; n=2 mice). h, The pause in action potentials resulted in linear reductions in GCaMP6s fluorescence (r=−0.656, p<0.001), such that a 1Hz reduction in firing frequency was detectable (red waveform; peak=−8.4±2.0% Δf/f). Line graphs represent the mean±SEM. AP, action potential; ILc, infralimbic cortex; PLc, prelimbic cortex.
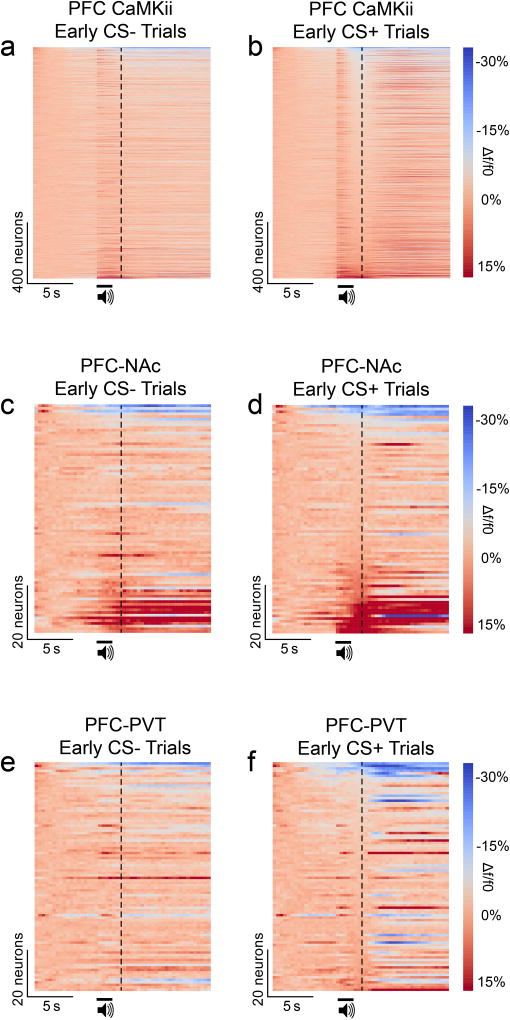
Extended Data Figure 3. Cue responses in PFC CaMKii-expressing neurons, PFC-NAc neurons, and PFC-PVT neurons before appetitive learning.
a,b, Population heat plots showing average responses for all individual PFC CaMKii-expressing neurons (n=1473 neurons; n=8 mice) across all CS− trials before learning (a) and all CS+ trials before learning (b). c,d, Population heat plots showing average responses for all individual PFC-NAc neurons (n=84 neurons; n=4 mice) across all CS− trials before learning (c) and all CS+ trials before learning (d). e,f, Population heat plots showing average responses for all individual PFC-PVT neurons (n=92 neurons; n=3 mice) across all CS− trials before learning (e) and all CS+ trials before learning (f). Data shown here are from neurons presented in Figures 1 & 2. Vertical dotted lines refer to the time of sucrose delivery (CS+ trials) or no sucrose delivery (CS− trials). CS, conditioned stimulus.
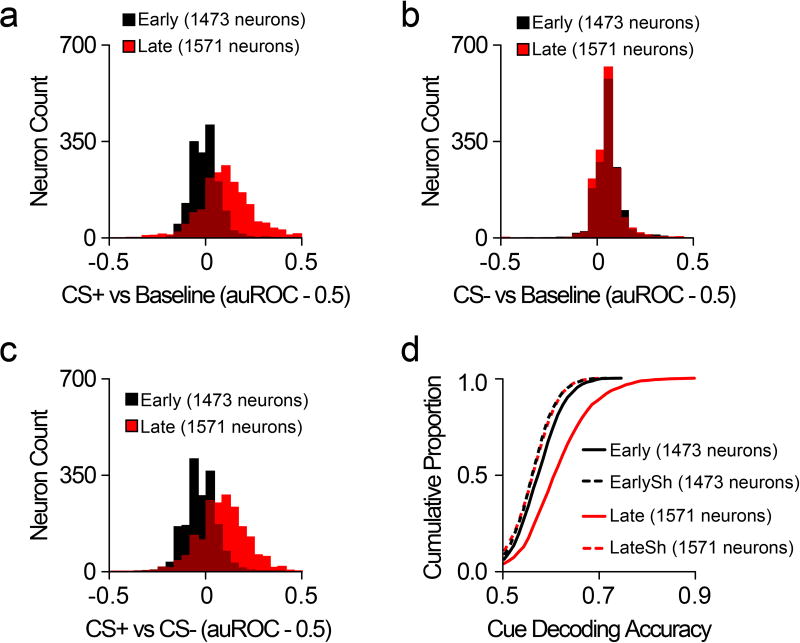
Extended Data Figure 4. Cue discrimination in PFC CaMKii-expressing neurons before and after appetitive learning. a–c.
Histograms for all recorded CaMKii-expressing PFC neurons (Early, n=1473 neurons; Late, n=1571 neurons; n=8 mice), showing CS+ responses (a), CS− responses (b), and CS+/CS− discrimination (c) during both early and late Pavlovian conditioning sessions. d, CDF plot showing that the dynamics of individual CaMKii-expressing neurons could be used to accurately decode whether the CS+ or CS− was presented in early conditioning sessions (compared to early shuffled: Welch’s t(2925.61)=7.30, p<0.001), as well as in late conditioning sessions (compared to late shuffled: Welch’s t(2727.06)=24.84, p<0.001). Data shown here are from neurons presented in Figure 1. CDF, cumulative distribution frequency; CS, conditioned stimulus; EarlySh, early shuffled; LateSh, late shuffled.
Extended Data Figure 5. Corticostriatal and corticothalamic projection neurons are anatomically and electrophysiologically distinct.
a,b, CtB-488 and CtB-594 were injected (n=3 mice) into either NAc or PVT (scale bars=250µm) (a), resulting in retrograde labeling of NAc-projecting and PVT-projecting neurons in dorsomedial PFC (scale bars=50µm) (b). c–e, Coronal sections of anterior (c), middle (d), and posterior (e) dorsomedial PFC revealing spatial separation of PFC-NAc and PFC-PVT neurons (scale bars=250µm). f–h, Population histograms from all mice (n=3) showing cell counts from anterior (f), middle (g), and posterior (h) dorsomedial PFC reveal that NAc-projecting neurons (red) are in more superficial layers as compared with PVT-projecting neurons (blue). Black refers to overlap (medial-lateral axis) between red and blue bars, and purple refers to double-labeled neurons (i.e., both NAc and PVT projection neurons). i, Current clamp recordings from dorsomedial PFC CtB-labeled neurons projecting to either NAc (top; n=9 neurons; n=3 mice; scale bars=25µm) or PVT (bottom; n=10 neurons; n=3 mice; scale bars=25µm). j,k, Representative waveforms (j) and averaged data (k) showing that PFC-NAc neurons fired fewer action potentials (spikes) as compared to PFC-PVT neurons during somatic depolarization (interaction: F(16,272)=16.6, p<0.001). l,m, Representative waveforms (l) and averaged data (m) revealing no differences in rheobase (the minimum current required to evoke an action potential) between PFC-NAc and PFC-PVT neurons (t(17)=1.22, p>0.2). n,o, Representative waveforms (n) and averaged data (o) showing that PFC-NAc neurons had larger peak AHPs as compared with PFC-PVT neurons (t(17)=4.67, p<0.001). p, The maximum number of action potentials (spikes) in each neuron was correlated with the peak AHP (r=0.80, p<0.001). Line and bar graphs represent the mean±SEM. AHP, afterhyperpolarization, cc, corpus callosum; ILc, Infralimbic cortex; MO, medial orbitofrontal cortex; PLc, prelimbic cortex; VO ventral orbitofrontal cortex.
Extended Data Figure 6. Corticostriatal and corticothalamic projection neurons have distinct monosynaptic inputs.
a–d, Viral strategy for rabies tracing experiments in which the monosynaptic inputs to (a,b) PFC-NAc and (c,d) PFC-PVT neurons were evaluated (n=3 mice/group). e–g, Example images showing (e) mCherry+ cells (TVA expression), (f) RV-GFP+ cells (local interneurons), and (g) overlap revealing mCherry+/RV-GFP+ cells (starter cells) or only GFP+ cells (local interneurons). h, The number of local inputs neurons (nonstarter; only GFP+ cells per section) to each projection population, as quantified by raw neuron count and by the percent of starter cells for each mouse, was equivalent for PFC-NAc and PFC-PVT neurons (raw neuron count: t(16)=0.59, p=0.56; % starter cells: t(16)=0.13, p=0.90). i, Representative image showing RV-GFP but not mCherry expression in the ACC. j, The number of input neurons from ACC was higher for PFC-PVT neurons as compared with PFC-NAc neurons (raw neuron count: t(16)=3.51; p=0.003; % starter cells: t(16)=3.31, p=0.004). k, Representative image showing RV-GFP but not mCherry expression in the LPO. l, The number of input neurons from the LPO was equivalent for PFC-NAc and PFC-PVT cells (raw neuron count: t(16)=1.77; p=0.01; % starter cells: t(16)=0.20, p=0.84). m, Representative image showing RV-GFP but not mCherry expression in the vHipp. n, The number of input neurons from vHipp was higher for PFC-NAc neurons as compared with PFC-PVT neurons (raw neuron count: t(16)=4.44; p<0.001; % starter cells: t(16)=4.00, p=0.001). o, Representative image showing RV-GFP but not mCherry expression in the VTA. p, The number of input neurons from the VTA was equivalent for PFC-NAc and PFC-PVT cells (raw neuron count: t(16)=0.56; p=0.59; % starter cells: t(16)=0.09, p=0.93). Bar graphs represent the mean±SEM. ACC, anterior cingulate cortex; RV-GFP, rabies virus encoding green fluorescent protein; LPO, lateral preoptic area; vHipp, ventral hippocampus; VTA, ventral tegmental area. *Note: no RV-GFP+ neurons were detected in any nucleus of the amygdala for either projection group.
Extended Data Figure 7. Corticostriatal and corticothalamic projection neurons express CaMKii and have distinct basal activity dynamics.
a–d, Injections of AAV5-CaMKii-eYFP into dorsomedial PFC and the retrograde tracer CtB-594 into NAc (a) or PVT (c) resulted in expression of eYFP in CtB-labeled PFC-NAc neurons (b) and PFC-PVT neurons (d). These data reveal that PFC-NAc and PFC-PVT are subpopulations of CaMKii-expressing neurons (n=2 mice/group). e,f, In ai9 reporter mice, (e) DIO-GCaMP6s injections in dorsomedial PFC and Cav2-cre injections into PVT (f) result in expression of GCaMP6s and tdTomato (marker for cre-recombinase), which have spatial overlap in PFC (n=2 mice). These data reveal that GCaMP6s expression is specific to the projection cells of interest. g, Example traces revealing spontaneous calcium dynamics from in vivo two-photon imaging in GCaMP6s-expressing PFC-NAc neurons (top; n=69 neurons; n=4 mice) and PFC-PVT neurons (bottom; n=61; n=3 mice) in awake, head-fixed mice. Red and blue dots refer to detected events. h–j, Averaged data reveal no differences in event amplitude (h) or event duration (i); however, PFC-NAc neurons had significantly shorter inter-event intervals (j) as compared to PFC-PVT neurons (amplitude: t(130)=1.10, p>0.2; duration: t(130)=0.68, p>0.4; interval: t(130)=2.30, p<0.05). Bar graphs represent the mean±SEM. CtB, cholera toxin subunit B; tdT, tdTomato.
Extended Data Figure 8. Effects of corticostriatal and corticothalamic optogenetic manipulations on acquisition and expression of CS− licking.
Acquisition: a, Line graph showing average CS− lick rate during conditioning (with laser) and test (no laser) from PFC-NAc::ChR2 (n=5), PFC-NAc::eNpHR (n=6), and PFC-NAc::eYFP mice (n=10). b,c, CDF plots and bar graphs showing CS− lick rate during conditioning (b) and test (c). No differences were observed between PFC-NAc groups during the no-laser test (ChR2 vs. eYFP: auROC=0.53, BHC p=0.43; eNpHR vs. eYFP: auROC=0.45, p=0.43). d, Line graph showing average CS− lick rate during conditioning (with laser) and test (no laser) from PFC-PVT::ChR2 (n=6), PFC-NAc::PVT (n=5), and PFC-PVT::eYFP mice (n=10). e,f, CDF plots and bar graphs showing CS− lick rate during conditioning (e) and test (f). No differences were observed between PFC-PVT groups during the no-laser test (ChR2 vs. eYFP: auROC=0.48, BHC p=0.48; eNpHR vs. eYFP: auROC=0.32, p=0.30). Expression: g–i, CDF plots and bar graphs showing CS− lick rates for PFC-NAc::ChR2 (n=5), PFC-NAc::eNpHR (n=5), and PFC-NAc::eYFP mice (n=8). There were no significant differences in CS− lick rate for PFC-NAc::ChR2 mice (vs. PFC-NAc::eYFP: auROC=0.43, p=0.26), although there was an effect of laser for PFC-NAc eNpHR mice (vs. PFC-NAc::eYFP: auROC=0.23, p=0.006). j–l, CDF plots and bar graphs showing CS− lick rates for PFC-PVT::ChR2 (n=5), PFC-PVT::eNpHR (n=5), and PFC-PVT::eYFP mice (n=6). There were no significant differences in CS− lick rate for PFC-PVT::ChR2 mice (vs. PFC-PVT::eYFP: auROC=0.35, p=0.15) or PFC-PVT::eNpHR mice (vs. PFC-PVT::eYFP: auROC=0.55, p=0.31). Line and bar graphs represent the mean±SEM. CDF, cumulative distribution frequency; NL, no laser test.
Extended Data Figure 9. Effects of corticostriatal and corticothalamic optogenetic manipulations are timing dependent.
a–c, CDF plots (top) and bar graphs (bottom) show anticipatory licking rates for PFC-NAc::ChR2 (n=5) or PFC-NAc::eNpHR3.0 (n=5) versus PFC-NAc::eYFP mice (n=6) during sessions in which the laser was randomly presented outside of cue delivery. There were no significant differences in anticipatory lick rate for PFC-NAc::ChR2 mice (vs. PFC-NAc::eYFP: auROC=0.56, BHC p=0.30) or PFC-NAc::eNpHR mice (vs. PFC-NAc::eYFP: auROC=0.63, p=0.23). d–f, CDF plots (top) and bar graphs (bottom) show anticipatory licking rates for PFC-PVT::ChR2 (n=5) or PFC-PVT::eNpHR3.0 (n=5) versus PFC-PVT::eYFP (n=8) mice during sessions in which the laser was randomly presented outside of cue delivery. There were no significant differences in anticipatory lick rate for PFC-PVT::ChR2 mice (vs. PFC-PVT::eYFP: auROC=0.42, p=0.21) or PFC-PVT::eNpHR mice (vs. PFC-PVT::eYFP: auROC=0.36, BHC p=0.14). g–i, CDF plots (top) and bar graphs (bottom) show CS− lick rates for PFC-NAc::ChR2 (n=5) or PFC-NAc::eNpHR3.0 (n=5) versus PFC-NAc::eYFP mice (n=6) during sessions in which the laser was randomly presented outside of cue delivery. There were no significant differences in CS− lick rate for PFC-NAc::ChR2 mice (vs. PFC-NAc::eYFP: auROC=0.41, p=0.19) or PFC-NAc::eNpHR mice (vs. PFC-NAc::eYFP: auROC=0.40, p=0.19). j–l, CDF plots (top) and bar graphs (bottom) show CS− lick rates for PFC-PVT::ChR2 (n=5) or PFC-PVT::eNpHR3.0 (n=5) versus PFC-PVT::eYFP (n=8) mice during sessions in which the laser was randomly presented outside of cue delivery. There were no significant differences in CS− lick rate for PFC-PVT::ChR2 mice (vs. PFC-PVT::eYFP: auROC=0.39, p=0.12) or PFC-PVT::eNpHR mice (vs. PFC-PVT::eYFP: auROC=0.36, p=0.12). Bar graphs represent the mean±SEM. CDF, cumulative distribution frequency.
Extended Data Figure 10. Optogenetic manipulations of corticostriatal and corticothalamic neurons are not appetitive, aversive, and do not affect movement.
a, Tracking data from single example mice during real time place preference experiments showing that PFC-NAc::ChR2 (left; 5) and PFC-NAc::eNpHR3.0 (right; n=5) mice spent equivalent time in chambers that were paired with laser (PFC-NAc::eYFP mice, n=8). b, Grouped data show that laser stimulation in PFC-NAc mice did not lead to a real-time place preference (interaction: F(2,30)=2.15, p>0.13). c, Grouped data show that optogenetic manipulations in PFC-NAc mice did not influence velocity of movement (interaction: F(2,30)=0.12, p>0.88). d, Tracking data from single example mice during real time place preference experiments showing that PFC-PVT::ChR2 (left; n=5) and PFC-PVT::eNpHR3.0 (right; n=5) mice spent equivalent time in chambers that were paired with laser (PFC-PVT::eYFP mice, n=5). e, Grouped data show that laser stimulation in PFC-PVT mice did not lead to a real-time place preference (interaction: F(2,24)=0.15, p>0.86). f, Grouped data show that optogenetic stimulation in PFC-PVT did not influence velocity of movement (interaction: F(2,24)=0.10, p>0.90). g,h, Coronal plates (redrawn based on Paxinos and Watson, 200740) located 1.98, 1.78, and 1.54 mm anterior to bregma illustrate the placements of optical fiber tips in PFC-NAc mice (g) and PFC-PVT mice (h). Bar graphs represent the mean±SEM. NoStim, no laser stimulation; Stim, laser stimulation.
Supplementary Material
Acknowledgments
We thank Drs. Spencer Smith and Jeffrey Stirman for helpful discussion. This study was funded by grants from the National Institutes of Health (NIDA: F32-DA041184, JMO; R01-DA032750, GDS; R01-DA038168, GDS; NICHD: T32-HD079124, SLR; NIMH: T32-MH093315, JAM), the Brain and Behavior Research Foundation (GDS), the Children's Tumor Foundation (016-01-006, JER), the Foundation of Hope (GDS), the UNC Neuroscience Center (Helen Lyng White Fellowship, VMN), the UNC Neuroscience Center Microscopy Core (P30 NS045892), and the UNC Department of Psychiatry (GDS). JMO performed experiments and surgeries. VMN wrote codes for analyses. VMN, AMM, ESV, EPM, OK, JAM, JER, SLR, and MAR provided technical assistance for in vivo optogenetics, histology, and immunohistochemistry. JMO, VMN, and GDS designed the experiments, analyzed and interpreted the data, and wrote the manuscript.
Footnotes
The authors declare no conflicts of interest.
References
- 1.Langworthy OR. Increased spontaneous activity produced by frontal lobe lesion in cats. Am. J. Physiol. 1939;126:158–161. [Google Scholar]
- 2.Matsumoto K, Suzuki W, Tanaka K. Neuronal correlates of goal-based motor selection in the prefrontal cortex. Science. 2003;301:229–232. doi: 10.1126/science.1084204. [DOI] [PubMed] [Google Scholar]
- 3.Warden MR, et al. A prefrontal cortex-brainstem neuronal projection that controls response to behavioural challenge. Nature. 2012;492:428–432. doi: 10.1038/nature11617. [DOI] [PMC free article] [PubMed] [Google Scholar]
- 4.Vertes RP. Differential projections of the infralimbic and prelimbic cortex in the rat. Synapse. 2004;51:32–58. doi: 10.1002/syn.10279. [DOI] [PubMed] [Google Scholar]
- 5.Britt JP, Benaliouad F, McDevitt RA, Stuber GD, Wise RA, Bonci A. Synaptic and behavioral profile of multiple glutamatergic inputs to the nucleus accumbens. Neuron. 2012;76:790–803. doi: 10.1016/j.neuron.2012.09.040. [DOI] [PMC free article] [PubMed] [Google Scholar]
- 6.Ma YY, et al. Bidirectional modulation of incubation of cocaine craving by silent synapse-based remodeling of prefrontal cortex to accumbens projections. Neuron. 2014;83:1453–1467. doi: 10.1016/j.neuron.2014.08.023. [DOI] [PMC free article] [PubMed] [Google Scholar]
- 7.McFarland K, Kalivas PW. The circuitry mediating cocaine-induced reinstatement of drug-seeking behavior. J. Neurosci. 2001;21:8655–8663. doi: 10.1523/JNEUROSCI.21-21-08655.2001. [DOI] [PMC free article] [PubMed] [Google Scholar]
- 8.McFarland K, Lapish CC, Kalivas PW. Prefrontal glutamate release into the core of the nucleus accumbens mediates cocaine-induced reinstatement of drug-seeking behavior. J. Neurosci. 2003;23:3531–3537. doi: 10.1523/JNEUROSCI.23-08-03531.2003. [DOI] [PMC free article] [PubMed] [Google Scholar]
- 9.Neumann PA, et al. Cocaine-induced synaptic alterations in thalamus to nucleus accumbens projection. Neuropsychopharmacology. 2016;41:2399–2410. doi: 10.1038/npp.2016.52. [DOI] [PMC free article] [PubMed] [Google Scholar]
- 10.Pascoli V, Terrier J, Espallergues J, Valjient E, O’Connor EC, Lüscher C. Contrasting forms of cocaine-evoked plasticity control components of relapse. Nature. 2014;509:459–464. doi: 10.1038/nature13257. [DOI] [PubMed] [Google Scholar]
- 11.Peters J, LaLumiere RT, Kalivas PW. Infralimbic prefrontal cortex is responsible for inhibiting cocaine seeking in extinguished rats. J. Neurosci. 2008;28:6046–6053. doi: 10.1523/JNEUROSCI.1045-08.2008. [DOI] [PMC free article] [PubMed] [Google Scholar]
- 12.Stefanik MT, et al. Optogenetic inhibition of cocaine seeking in rats. Addict. Biol. 2013;18:50–53. doi: 10.1111/j.1369-1600.2012.00479.x. [DOI] [PMC free article] [PubMed] [Google Scholar]
- 13.Ye L, et al. Wiring and Molecular Features of Prefrontal Ensembles Representing Distinct Experiences. Cell. 2016;165:1776–1788. doi: 10.1016/j.cell.2016.05.010. [DOI] [PMC free article] [PubMed] [Google Scholar]
- 14.Bouret S, Sara SJ. Reward expectation, orientation of attention and locus coeruleus-medial frontal cortex interplay during learning. Eur. J. Neurosci. 2004;20:791–802. doi: 10.1111/j.1460-9568.2004.03526.x. [DOI] [PubMed] [Google Scholar]
- 15.Kim H, Ährlund-Richter S, Wang X, Deisseroth K, Carlén M. Prefrontal parvalbumin neurons in control of attention. Cell. 2016;164:208–218. doi: 10.1016/j.cell.2015.11.038. [DOI] [PMC free article] [PubMed] [Google Scholar]
- 16.Kobayashi S, et al. Influences of rewarding and aversive outcomes on activity in macaque lateral prefrontal cortex. Neuron. 2006;51:861–870. doi: 10.1016/j.neuron.2006.08.031. [DOI] [PubMed] [Google Scholar]
- 17.Moorman DE, Aston-Jones G. Prefrontal neurons encode context-based response execution and inhibition in reward seeking and extinction. Proc. Natl. Acad. Sci. USA. 2015;112:9472–9477. doi: 10.1073/pnas.1507611112. [DOI] [PMC free article] [PubMed] [Google Scholar]
- 18.Chen TW, et al. Ultrasensitive fluorescent proteins for imaging neuronal activity. Nature. 2013;499:295–300. doi: 10.1038/nature12354. [DOI] [PMC free article] [PubMed] [Google Scholar]
- 19.Dittgen T, et al. Lentivirus-based genetic manipulations of cortical neurons and their optical and electrophysiological monitoring in vivo. Proc. Natl. Acad. Sci. USA. 2004;101:18206–18211. doi: 10.1073/pnas.0407976101. [DOI] [PMC free article] [PubMed] [Google Scholar]
- 21.Bossert JM, et al. Role of projections from ventral medial prefrontal cortex to nucleus accumbens shell in context-induced reinstatement of heroin seeking. J. Neurosci. 2012;32:4982–4991. doi: 10.1523/JNEUROSCI.0005-12.2012. [DOI] [PMC free article] [PubMed] [Google Scholar]
- 22.McGlinchey EM, James MH, Mahler SV, Pantazis C, Aston-Jones G. Prelimbic to accumbens core pathway is recruited in a dopamine-dependent manner to drive cued reinstatement of cocaine seeking. J. Neurosci. 2016;36:8700–8711. doi: 10.1523/JNEUROSCI.1291-15.2016. [DOI] [PMC free article] [PubMed] [Google Scholar]
- 23.Igelstrom KM, Herbison AE, Hyland BI. Enhanced c-Fos expression in superior colliculus, paraventricular thalamus and septum during learning of cue-reward association. Neuroscience. 2010;168:706–714. doi: 10.1016/j.neuroscience.2010.04.018. [DOI] [PubMed] [Google Scholar]
- 24.Haight JL, Flagel SB. A potential role for the paraventricular nucleus of the thalamus in mediating individual variation in Pavlovian conditioned responses. Front. Behav. Neurosci. 2014;8:79. doi: 10.3389/fnbeh.2014.00079. [DOI] [PMC free article] [PubMed] [Google Scholar]
- 25.Do-Monte FH, Quiñones-Laracuente K, Quirk GJ. A temporal shift in the circuits mediating retrieval of fear memory. Nature. 2015;519:460–463. doi: 10.1038/nature14030. [DOI] [PMC free article] [PubMed] [Google Scholar]
- 26.Penzo MA, et al. The paraventricular thalamus controls a central amygdala fear circuit. Nature. 2015;519:455–459. doi: 10.1038/nature13978. [DOI] [PMC free article] [PubMed] [Google Scholar]
- 27.Harris KD, Mrsic-Flogel TD. Cortical connectivity and sensory coding. Nature. 2013;503:51–58. doi: 10.1038/nature12654. [DOI] [PubMed] [Google Scholar]
- 28.Pinto A, Sesack SR. Limited collateralization of neurons in the rat prefrontal cortex that project to the nucleus accumbens. Neuroscience. 2000;97:635–642. doi: 10.1016/s0306-4522(00)00042-7. [DOI] [PubMed] [Google Scholar]
- 29.Resendez SL, et al. Visualization of cortical, subcortical and deep brain neural circuit dynamics during naturalistic mammalian behavior with head-mounted microscopes and chronically implanted lenses. Nat. Protoc. 2016;11:566–597. doi: 10.1038/nprot.2016.021. [DOI] [PMC free article] [PubMed] [Google Scholar]
- 30.Sparta DR, et al. Construction of implantable optical fibers for long-term optogenetic manipulation of neural circuits. Nat. Protoc. 2012;7:12–23. doi: 10.1038/nprot.2011.413. [DOI] [PMC free article] [PubMed] [Google Scholar]
- 31.Soudais C, Laplace-Builhe C, Kissa K, Kremer EJ. Preferential transduction of neurons by canine adenovirus vectors and their efficient retrograde transport in vivo. FASEB. 2001;15:2283–2285. doi: 10.1096/fj.01-0321fje. [DOI] [PubMed] [Google Scholar]
- 32.Hnasko TS, et al. Cre recombinase-mediated restoration of nigrostriatal dopamine in dopamine-deficient mice reverses hypophagia and bradykinesia. Proc. Natl. Acad. Sci. USA. 2006;103:8858–8863. doi: 10.1073/pnas.0603081103. [DOI] [PMC free article] [PubMed] [Google Scholar]
- 33.Kaifosh P, Zaremba JD, Danielson NB, Losonczy A. SIMA: Python software for analysis of dynamic fluorescence imaging data. Front. Neuroinformatics. 2014;8:80. doi: 10.3389/fninf.2014.00080. [DOI] [PMC free article] [PubMed] [Google Scholar]
- 34.Kohavi R. A study of cross-validation and bootstrap for accuracy estimation and model selection. IJCAI’95. 1995;2:1137–1143. [Google Scholar]
- 35.Stuber GD, et al. Excitatory transmission from the amygdala to nucleus accumbens facilitates reward seeking. Nature. 2011;475:377–380. doi: 10.1038/nature10194. [DOI] [PMC free article] [PubMed] [Google Scholar]
- 36.Conte WL, Kamishina H, Reep RL. Multiple neuroanatomical tract-tracing using fluorescent Alexa Fluor conjugates of cholera toxin subunit B in rats. Nat. Protoc. 2009;4:1157–1166. doi: 10.1038/nprot.2009.93. [DOI] [PubMed] [Google Scholar]
- 37.Callaway EM. Transneuronal circuit tracing with neurotropic viruses. Curr. Opin. Neurobiol. 2008;18:617–623. doi: 10.1016/j.conb.2009.03.007. [DOI] [PMC free article] [PubMed] [Google Scholar]
- 38.Hoover WB, Vertes RP. Anatomical analysis of afferent projections to the medial prefrontal cortex in the rat. Brain Struct. Funct. 2007;212:149–179. doi: 10.1007/s00429-007-0150-4. [DOI] [PubMed] [Google Scholar]
- 39.Otis JM, Dashew KB, Mueller D. Neurobiological dissociation of retrieval and reconsolidation of cocaine-associated memory. J. Neurosci. 2013;33:1271–1281a. doi: 10.1523/JNEUROSCI.3463-12.2013. [DOI] [PMC free article] [PubMed] [Google Scholar]
- 40.Paxinos G, Franklin KBJ. The Mouse Brain in Stereotactic Coordinates. 3. Academic Press; New York: 2007. [Google Scholar]
Associated Data
This section collects any data citations, data availability statements, or supplementary materials included in this article.


