

Abstract
To comprehensively detect diverse and novel RNA species, we compared deep small RNA and RNA sequencing (RNA-seq) methods applied to a primary acute myeloid leukemia (AML) sample. We were able to discover previously unannotated small RNAs using deep sequencing of a library method employing broader insert size selection. We analyzed the long non-coding RNA (lncRNA) landscape in AML by comparing deep sequencing from multiple RNA-seq library construction methods for the sample we studied, then integrating RNA-seq data from 179 AML cases. This identified lncRNAs that are completely novel, differentially expressed, and associate with specific AML subtypes. Our study revealed the complexity of the non-coding RNA transcriptome through a combined strategy of strand-specific small RNA and total RNA-seq. This dataset will serve as an invaluable resource for future RNA based analyses.
Keywords: Deep sequencing, RNA-seq, transcriptome, small RNA, lncRNA, leukemia
Introduction
Small RNA sequencing (small RNA-seq) and RNA sequencing (RNA-seq) have enabled expression profiling of various classes of RNA species as well as the discovery of novel RNAs. This is exemplified by large-scale sequencing efforts, such as The Cancer Genome Atlas (TCGA), that successfully used both microRNA sequencing and RNA-seq to enrich for microRNA and protein-coding gene expression, respectively, for subtyping, association with mutational status, and survival analysis. However, it remains unclear whether current databases fully represent all RNA transcripts. Current strategies typically select for small RNAs less than 35 nucleotides (nt) to enrich for microRNAs or utilize RNA-seq protocols that favor RNAs larger than 200 nt to evaluate the expression of protein-coding genes. However, these methods bias against the detection of RNA species with transcript sizes between these ranges, such as certain small nucleolar RNAs (snoRNAs)1. In this study, we performed deep sequencing of diverse RNA library preparation methods to detect RNA transcripts of varying sizes and expression levels.
The recent growth of annotated long non-coding RNAs (lncRNAs)2–5 has been followed by observations of their critical roles in normal hematopoiesis6–9 and potential contributions to the progression of acute leukemia10–13. However, despite the annotation of thousands of lncRNAs in human development and cancer, only a minor subset is well characterized in the context of leukemia. Furthermore, previous developmental14,15 and cancer transcriptome studies2,16–18 have revealed highly specific expression profiles for lncRNAs, suggesting that the full spectrum of biologically and clinically relevant lncRNAs may be under-represented in leukemia datasets. However, a major challenge is determining the necessary amount of sequencing needed to detect the full spectrum, due to the variable read coverage across transcript types with highly variable expression levels19. While some lncRNAs can be expressed at levels that are similar to protein-coding genes (such as HOTAIR20 and SChLAP121), the majorities are expressed at lower levels than protein-coding genes16,22. With decreasing sequencing costs, higher sequencing depths may be able to alleviate this issue. To address this, we conducted ultra-deep RNA-seq analysis by generating ~4.6 billion paired 100 nt RNA-seq reads derived from libraries using four different RNA-seq library construction strategies. Performing ultra-deep transcriptome sequencing enabled us to accurately assess the sequencing coverage necessary to comprehensively detect lncRNAs in AML samples. This in turn served as the foundation to discover altered lncRNAs across a large cohort of AML patient samples.
To detect the full spectrum of RNA species in AML, we focused on an individual with acute myeloid leukemia (AML), referred to as AML31 through out this study. This patient has been extensively studied through genomic and transcriptomic analyses, and the clinical features of this case have been described in detail in previous publications23–26. For the purposes of this study, we focused our analyses on the primary tumor sample (from the diagnostic bone marrow aspirate). We also used a diagnostic bone marrow aspirate relapse sample of AML31 to further support the transcripts we discovered in the primary tumor sample. The relapse sample was obtained 505 days after initial presentation, following standard induction chemotherapy with cytarabine and idarubicin and four rounds of high-dose cytarabine consolidation therapy. AML31 was also included in TCGA consortium study (referred to as TCGA-AB-2969) in which the primary tumor was sequenced with ~1.4 million small RNA reads, and ~140 million RNA-seq reads, representing typical coverage among existing studies. However, by performing deep small RNA (17-100 nt) and RNA-seq (>200 nt) of AML31 and integrating existing TCGA AML data, we demonstrate that (1) prior methods were not able to detect all classes of RNA species, (2) many non-coding RNAs expressed at lower levels were discovered by deeper sequencing read coverage, and (3) altered non-coding RNAs in AML not detected in the TCGA study were discovered by our library construction methods and deeper sequencing read coverage. The findings presented in this study suggest that deeper sequencing and broader size fractionations can yield additional information about cancer transcriptomes, which may prove to be relevant for a full understanding of cancer pathogenesis.
Results
Deep small RNA-seq and RNA-seq of an AML patient
In a companion study24, deep whole genome sequencing was applied to AML31, which enabled detection and measurement of mutations with very low variant allele frequencies. In this paper, we focus on comprehensive detection of various RNA classes using both deep small and long RNA sequencing. AML31 is one of the patient samples studied as part of the TCGA dataset26 that included microRNA and protein coding RNA analyses. We refer herein to the TCGA data by its TCGA patient id: ‘TCGA-AB-2969’ and to our new deep sequencing data generated at the McDonnell Genome Institute (MGI) by its patient id: ‘AML31’. To detect the full spectrum of small RNAs in AML, we generated small RNA libraries to select library fragment sizes ranging 17-100 nt using the unfractionated bone marrow aspirate (BMA) cells, and corresponding BMA relapse sample from AML 31 (Figure 1). We generated ~14.6 million reads for the primary tumor sample, and ~13.4 million reads for the relapse sample (Table S1). To evaluate the performance of different RNA-seq protocols we performed transcriptome sequencing on AML31 using four different library construction methods resulting in the generation of four RNA-seq datasets of ~4.6 billion reads in total (Table S1).
Figure 1. Samples, their small RNA-seq and RNA-seq data generated, and overview of data analyses.
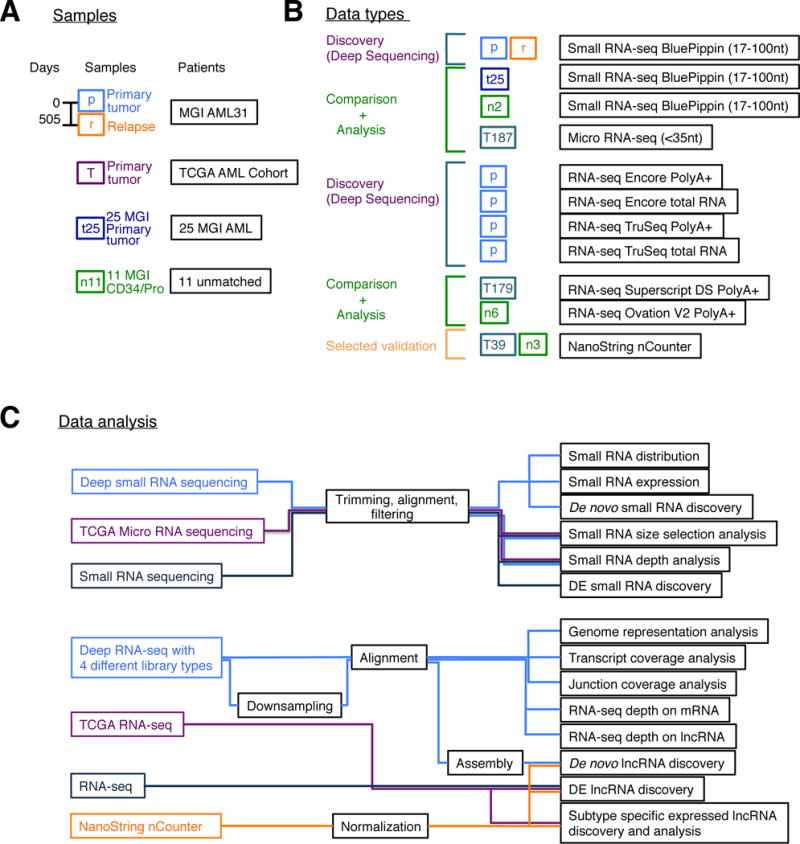
(A) Samples sequenced. (B) Small RNA-seq and RNA-seq datasets generated with different protocols. (C) Overview of data analyses. Details of the datasets are summarized in Table S1.
For the purposes of comparing these results with standard TCGA RNA datasets, we integrated microRNA data from 187 patients that were generated as part of the TCGA AML study. Whereas the TCGA data were generated utilizing a size selection to enrich for microRNAs (<35 nt)26, we generated small RNA-seq data using a size selection aimed at RNA transcripts <100 nt in length (to include miRNAs and larger small RNAs). This approach was also applied to library construction for small RNA-seq data generation from 25 primary AML and 2 unmatched CD34 bone marrow samples (Table S1), generating ~2.7 to ~5.4 million reads per sample. Similarly, for RNA-seq comparison and validation analyses, we incorporated RNA-seq data from 179 TCGA AML patients. To provide a normal RNA-seq comparator dataset, we also generated RNA-seq data for 6 unmatched samples (Table S1) with RNA derived from purified hematopoietic cell populations of bone marrow (3 from CD34 cells and 3 from promyelocytes), and produced ~315 million reads per sample. Table S1 summarizes all the samples used in the analyses. Orthogonal validation was performed using the NanoString nCounter Analysis System for the altered and novel lncRNA transcripts.
Expression of small RNAs in AML31
To accurately detect expressed small RNAs in AML31, the aligned small RNA-seq data was compared against a collection of small RNA annotations that includes microRNAs (miRNA)27, piwi-interacting RNAs (piRNA)28, transfer RNAs (tRNA)29, small nucleolar RNAs (snoRNA)30, small nuclear RNAs (snRNA)31, ribosomal RNAs (rRNA)32, and small miscellaneous RNAs (miscRNA)33. Expression of small RNAs from each of these classes was observed in our dataset. 1,436 of these annotated small RNAs were detected in the AML31 primary tumor sample. The quantity of small RNA genes in each class ranged from 85 to 345 (Figure 2A and Table S2). As shown in Figure 2A, we observed an enrichment of RNA classes at different length ranges with miRNAs enriched between 20-25 nt, piRNAs between 25-35 nt, tRNAs between 70-75 nt, and rRNAs between 115-120 nt. In contrast, the snoRNAs and snRNAs had more variable lengths, but they were generally greater than 60 nt. While all classes of small RNAs displayed broad ranges of expression levels (Figure 2B), snoRNAs were the most highly expressed, with 97% having normalized expression levels greater than 1 read per million (RPM). In contrast, piRNAs displayed the lowest expression levels, with only 38% being expressed at greater than 1 RPM. The AML31 relapse sample showed a similar pattern of small RNA length and expression distribution (Figure S1A and S1B).
Figure 2. Expression of annotated and unannotated small RNAs in MGI AML31 data.

(A) Length distribution of expressed annotated small RNAs in MGI AML31 primary tumor. The expressed annotated small RNAs are binned by length to different length ranges up to 150 nt. Each bin differs by 5 nt. Darker colors represent higher numbers of annotated small RNAs are expressed. miRNAs are shown around the length range 21-25 nt, tRNAs are shown around the length range 71-75 nt, and snoRNAs are distributed in a wider length range around 60-100 nt and 120-140 nt. (B) Expression level (RPM) of different types of RNAs in MGI AML31 primary tumor. RPM values are coded in different colors. For each type of RNA, the percentages of different RPM values are shown on the y-axis. Expressed small RNAs for MGI AML31 relapse data are shown in Figure S1. (C) Comparison of MGI AML31 data and TCGA-AB-2969 data in discovering unannotated RNAs (TCGA-AB-2969 is the same patient as AML31) in length range ≤ 35 nt. Log10 RPM values for the unannotated RNAs are plotted. Only 66 (34%) unannotated RNAs can be detected with TCGA-AB-2969 data. (D) Percentage of unannotated small RNAs detected in TCGA samples and simulated data with three read number cutoffs (1, 2 and 5). Simulated data were assembled using TCGA data but with larger number of reads (~15 million) for each simulated sample. The unannotated small RNAs showed in larger percentage of samples with larger read numbers in the simulated deep sequencing data compared with the original TCGA data. Unannotated small RNAs in length range 36-100 nt are shown in Figure S3. Also refer to Figures S2, S4, and S5, and Tables S2-S4. Also see Table S3 for the unannotated small RNA transcripts.
Discovery of novel small RNAs
Since existing studies concentrated their small RNA analyses on microRNAs26 we first focused on comparing our deep AML31 small RNA-seq data using an equivalent size range (17-35 nt). Our small RNA discovery pipeline (refer to Experimental Procedures) was applied to the AML31 deep sequencing data, and discovered 194 unannotated small RNAs in the 17-35 nt size range (Table S3) that were not included in the small RNA annotations. In contrast, only 66 (34%) of the 194 unannotated small RNAs had ≥ 1 read in the TCGA-AB-2969 data (Figure 2C). This is not surprising, since the TCGA-AB-2969 data comprise only ~1.4 million reads, while the AML31 data comprise ~14.6 million reads. For the whole TCGA AML cohort, these unannotated small RNAs are expressed more broadly, i.e. not just uniquely expressed in AML31, with on average 64/194 patients have at least one small RNA-seq read (Figure 2D).
Overall, the 66 unannotated small RNAs discovered in AML31 that were also detectable in the TCGA-AB-2969 data had the highest expression levels and prevalence among the TCGA patient cohort. In comparison, the unannotated small RNAs discovered in AML31 but missed by the TCGA-AB-2969 data had significantly lower expression levels (Welch’s two sample t-test, p-value 2.5e-09), and also were less prevalent within the TCGA patient data (Figure S2A and S2B). We further observed a correlation of 0.73 between the quantity of small RNAs detected and the quantity of reads generated when comparing the TCGA and MGI small RNA data (Figure S2C).
Next, to determine if deeper sequencing using TCGA data would have improved the ability to detect small RNAs we randomly selected and merged TCGA AML small RNA data to generate a simulated cohort of 100 samples. To make these composite data comparable to our AML31 dataset, each simulated sample had an average of ~15 million small RNA-reads. A higher percentage of the 194 unannotated small RNAs was detectable in the simulated dataset compared with the original TCGA data (Figure 2D). For example, greater than 50% of the unannotated small RNAs had greater than 2 reads in more than 50% of the simulated samples. In contrast, only ~18% of the unannotated small RNAs had greater than 2 reads in more than 50% of the original TCGA AML data. Overall, this result demonstrates that deeper sequencing (than used by the TCGA study) is required to reliably discover and quantify small RNAs.
Discovery of small RNAs up to 100 nt
While our initial analysis described above focused on small RNAs less than 35 nt in length, to facilitate comparison with existing data collections biased towards this size range, our broader size fractionation enabled an examination of novel small RNAs ranging from 17 to 100 nt in length. Hence, a focused discovery effort for small RNAs in the 36-100nt size range was conducted using AML31 data to identify small RNAs that may have been obviated by the TCGA approach. Using the same pipeline to discover RNAs less than 35 nt, we discovered 258 unannotated small RNAs in the range of 36-100 nt. Interestingly, although the TCGA applied a size selection that was biased against the 36-100 nt range, we still observed low quantities of sequence reads corresponding to these unannotated small RNAs in TCGA samples (Figure S3). Comparison of the AML31 data with the corresponding TCGA-AB-2969 data revealed 28 (10.9%) unannotated small RNAs with ≥1 read in the TCGA data. 169 (65.5%) of the unannotated small RNAs found in AML31 were not present in the TCGA-AB-2969 sequence data, but had at least one read from at least one other patient in the TCGA AML cohort. Finally, because 61 (23.6%) of the unannotated small RNAs from AML31 lacked any read support across all samples in the TCGA cohort, we investigated whether they were detectable in 25 MGI AML small RNA datasets (Figure S3) that used the same library construction protocol as the 17-100 nt size selection used for AML31. We found that 57 (93.4%) of the small RNAs had at least one read in at least one additional MGI AML dataset. Overall, 254 (98.4%) of the 258 unannotated small RNAs discovered by AML31 deep sequencing data in the range of 36-100 nt were detectable in multiple patients, but ~90% of them were not present in the corresponding TCGA-AB-2969 data.
The larger size selection (17-100 nt) of the AML31 data allowed us to detect unannotated small RNAs across diverse length ranges (Figure S2E). To illustrate this, Figure S4 shows coverage maps derived from patients TCGA-AB-2969 and 296361 (one of 25 MGI AML samples) compared to AML 31, for an intronic unannotated small RNA of length 18 nt, an intergenic unannotated small RNA of length 52 nt, and a unannotated small RNA of length 84 nt in the intronic region of PLD4.
The above comparisons highlight the advantages of deep sequencing for discovery of both RNA species of <35 nt and of 36-100 nt. The TCGA-AB-2969 sequence data were biased toward the <35 nt size range, and as a result the percentage of AML31 unannotated small RNAs detectable in TCGA-AB-2969 data decreased significantly (from 34% to 10.9%; Pearson’s Chi-squared test, p-value = 1.5e-09) when comparing the < 35 nt and 36-100nt size ranges, respectively. Size selection not only affects the number of detectable small RNAs, but also affects their calculated expression levels in the datasets. Expression levels of the 194 unannotated small RNAs calculated from TCGA data were higher in the <35 nt range than when calculated from our libraries size-selected for the 36-100 nt range (Welch’s two sample t-test, p-value = 6.2e-05). In contrast, expression levels of the AML31 194 unannotated small RNAs within the cohort of 25 MGI AML samples did not show any difference between the two size ranges (Figure S2D). This is probably because the libraries were constructed with the same protocol as AML31.
While the increased sequencing depth and size selection enabled us to detect novel small RNAs, we next wanted to determine if any of them were differentially expressed. Therefore, we performed a differential expression analysis using the small RNA-seq data from our cohort of 25 MGI-sequenced AML tumor samples and 2 unmatched CD34 bone marrow samples. This enabled us to discover 20 annotated and 6 unannotated differentially expressed small RNAs ranging in the length from 19 to 95 nt (Figure S5 and Table S4), including the microRNA miR-142, which was previously shown to be highly expressed in AML26.
Evaluation of data coverage by down-sampling deep RNA sequencing data
To evaluate how much sequence data coverage is needed to detect lncRNAs, we generated transcriptome sequencing data using four different library construction methods: TruSeq technology (Illumina, San Diego, CA) and Encore Complete RNA-seq DR Multiplex System (NuGen, San Carlos, CA), each with total RNA and PolyA+ selection (Figure S6 and Table S1). We will refer to these datasets the methods generating them as TruSeq PolyA+ RNA, TruSeq total RNA, Encore PolyA+ RNA and Encore total RNA, respectively in this study. By using these deep transcriptome sequencing data of ~4.6 billion RNA-seq reads, we down-sampled AML31 data from each RNA-seq library construction method, and quantified the number of annotated mRNAs and lncRNAs that were detectable from only a subset of all the RNA-seq reads generated (Figure 3). TruSeq PolyA+ library date consistently detected a greater number of protein-coding mRNAs (Figure 3A) than the other methods we evaluated. For example, at ~5 million reads, TruSeq PolyA+ detected ~12,000 mRNAs, whereas Encore PolyA+ detected ~11,000 mRNAs. Without down-sampling, ~15,300 mRNAs were detected using ~900 million TruSeq PolyA+ reads, and ~13,900 mRNAs were detected using ~1,280 million Encore PolyA+ reads. It is not surprising that PolyA+ selection protocols showed an advantage in identification of mRNAs (and that TruSeq PolyA+ performed the best in this comparison), since our earlier analysis demonstrated that TruSeq PolyA+ provides the greatest coding region representation. For lncRNAs, TruSeq total RNA libraries consistently detected a greater quantity of lncRNAs than other library types (Figure 3B). Therefore, this kit may represent the optimal method to evaluate lncRNA expression, since it also had the greatest coverage across the whole transcript. While the quantity of mRNA and lncRNAs increased with the addition of RNA-seq reads, the number of detectable mRNAs increased only by 5% comparing 340 million to 860 million TruSeq total RNA reads, while the number of detectable lncRNAs increased by 23%. Even at 1,200 million reads, the number of detectable lncRNAs was still not saturated. Therefore, a greater depth of sequencing will be required to identify all lncRNAs with even lower expression levels.
Figure 3. Downsampling of 4 types of RNA-seq data followed by detection of lncRNAs and mRNAs.

Datasets included: Encore PolyA+, TruSeq PolyA+, Encore total RNA, and TruSeq total RNA. (A) Downsampling for annotated mRNAs. (B) Downsampling for annotated lncRNAs. Percentage of detected annotated mRNAs and lncRNAs with different number of reads are indicated by the dashed lines according to TruSeq total RNA, since TruSeq total RNA consistently covered more genes in both panels. For mRNA, TruSeq polyA+ performs slightly better, since polyA+ may enrich some mRNAs.
Discovery of novel lncRNAs using deep transcriptome sequencing
Using a previously described method18 to comprehensively annotate lncRNAs in AML31 we identified 977 previously unannotated multi-exon lncRNA transcripts (See Table S5 for details). The expression levels of the multi-exon lncRNAs are shown in Figure 4A, which combine the datasets for AML31 and the TCGA AML cohort. 78% of these lncRNAs had at least one RNA-seq read in TCGA-AB-2969 (from AML31), and 99% had at least one read in at least one other patient in the TCGA AML cohort. From Figure 4B, we see that more than 60% of the unannotated lncRNAs had log10 FPKM values of less than 0.25 in both AML31 and TCGA-AB-2969, suggesting that these RNAs will require even higher coverage to guarantee their detection. For example, Figure 4C shows the coverage maps of one unannotated lncRNA in the combined data from TruSeq AML31 total RNA and TCGA-AB-2969 datasets.
Figure 4. Unannotated lncRNAs in AML.

(A) Expression level of unannotated lncRNAs (with multiple exons) in 4 types of TCGA AML31 RNA-seq data, TCGA-AB-2969, and other TCGA AMLs datasets. A large percent (78%) of the expressed unannotated lncRNAs detected in MGI AML31 data are also detected in TCGA-AB-2969 RNA-seq data with ≥1 RNA-seq reads. The remaining lncRNAs are not detected in TCGA-AB-2969 RNA-seq data, but 224 of them are detected in other TCGA AML RNA-seq datasets. Genes are sorted according to whether they were detected in TCGA-AB-2969 and by FPKM values. The heatmap shows that almost all of the unannotated lncRNAs discovered by MGI AML31 data are also recurrent in other datasets with at least one read, and the single TCGA-AB-2969 RNA-seq data missed a subset (22%) of the unannotated lncRNAs without any reads, most of which have very low FPKM according to the TCGA AML cohort to assemble. (B) Comparison of MGI AML31 RNA-seq data with TCGA-AB-2969 RNA-seq data in discovering unannotated lncRNAs. (C) An example of an unannotated lncRNA that was identified in the MGI AML31 dataset. Also see Table S5 for the unannotated lncRNA transcripts.
Altered lncRNA abundance in AML samples
While transcriptome analysis has been used extensively to profile protein-coding genes in AML, we leveraged the TCGA RNA-seq data to identify dysregulated lncRNAs. Hierarchical clustering of 1,216 lncRNAs expressed consistently (FPKM >1 and read count >200 in >75% patients) in the TCGA AML cohort enabled the identification of subtype-specific expression profiles. Similar to subtype specific microRNAs and protein-coding genes previously identified in AML26, we observed a subset of lncRNAs that have enriched expression in patients stratified within the M3 (acute promyelocytic leukemia) subtype (Figure 5A), which is initiated by the PML-RARA fusion gene. By differential expression analysis (see methods), we identified 19 subtype-specific lncRNAs (Table S6A), 13 of which are M3-specific, including MEG3, which has previously been associated with M3-AML10. Figure 5B shows the coverage maps of another example of an M3-specific lncRNA (TCONS_l2_00020926) in 8 TCGA AML patients (each from one FAB subtype, which is based on cellular morphology). We next examined differentially expressed (DE) lncRNAs (see methods) using the TCGA AML cohort database, and values from purified normal CD34 cells or promyelocytes (Table S1) obtained from the bone marrow cells of three different healthy donors each as done previously34. Eight lncRNAs were differentially expressed between AML samples of the FAB M0, M1, M2, M4, and M5 subtypes and CD34 cells, which represent the best surrogate for normal cells for these AML subtypes. Fifteen lncRNAs were differentially expressed between promyelocytes and FAB M3 samples (acute promyelocytic leukemia) (log fold change >2, FDR <10−5, Table S6B). Using an orthogonal platform, the NanoString nCounter platform, we attempted to validate the 19 subtype-specific and 23 differentially expressed lncRNAs. We were able to design probes for 7 subtype-specific and 12 differentially expressed lncRNAs. Overall, 6/7 subtype-specific expressed lncRNAs and 9/12 differentially expressed lncRNAs were validated using AML and the corresponding normal CD34 or promyelocyte samples (Figure 6A and Figure S7). Figure 6B shows 4 out of 6 previously unannotated lncRNAs were validated using NanoString (all with Welch’s two sample t-test, p-value <10−5).
Figure 5. AML subtype enriched lncRNA expression.

(A) Expression profiles for 179 TCGA AML tumor patients. 1,292 expressed lncRNAs were chosen and the normalized expression profiles of these lncRNAs of the cohort are shown in the heatmap by hierarchical clustering. M3 patients show the association with the PML-RARA fusion and better cytogenetic risks. This might be related to a set of highly expressed lncRNAs. (B) An example of differentially expressed lncRNA specific to M3. Also refer to Table S6 for the subtype specific expressed lncRNAs.
Figure 6. Experimental validation of subtype specific and unannotated lncRNAs in AML.

(A) 7 lncRNAs show different expression in AML subtypes from RNA-seq data and 6 were validated by the NanoString nCounter Analysis System. (B) NanoString counts of 4 unannotated lncRNAs in AML. Boxplots of 9 validated DE lncRNAs are shown in Figure S7. Also see Table S7.
Discussion
Comprehensive characterization of all RNA classes is challenging due to considerable diversity in expression levels, gene length, sequence complexity, prevalence of expression across patients, and the availability of existing gene annotation models. To date, current approaches to the TCGA RNA sequencing library construction have not targeted the full spectrum of RNAs in tumor samples; rather, they focus on microRNA and mRNA classes. Existing studies have also suffered from lack of sequencing depth, further restricting the ability to detect RNAs with low expression levels. In this study, we expanded the size selection range and performed ultra deep sequencing, leading to the discovery of 452 unannotated small RNAs and 977 unannotated lncRNAs in a single, highly representative normal karyotype AML sample, using deep small RNA-seq and RNA-seq methods, respectively. We were able to extend and validate many of our findings with data from the TCGA, since the AML31 patient was included in the TCGA AML study, and our comparison strikingly showed more comprehensive RNA detection using a wider size selection range and higher sequencing data coverage.
While more unannotated small RNAs and lncRNAs were detected, most had low expression levels, hence deep sequencing was required. For example, 282 (62.4%) of the 452 unannotated small RNAs had more than 5 (or 0.36 RPM) reads in our deep sequencing data (with more than 14 million reads). In contrast, 0.36 RPM is equivalent to only 0.5 reads in the TCGA-AB-2969 data (~1.4 million reads). Given their low expression—coupled with the lower sequencing depth used by TCGA—we focused on the evidence of their expression across patients to evaluate potential importance. While it is unclear whether these minimally expressed RNAs are functionally relevant, our study demonstrated the methodology necessary for ensuring these RNAs are detected, thereby enabling subsequent functional analysis. Identification of novel transcripts using deep sequencing data also opens up the possibility of discovering gene fusions involving these novel transcripts.
Previous studies have successfully used size selection to enrich for small RNAs in a desired size range to enhance the identification and discovery of specific classes of RNAs. This is exemplified by the higher percentage of small RNAs identifiable in the TCGA-AB-2969 data from libraries sized at less than 35 nt compared with those identified in the range of 36-100 nt.
We also observed that the calculated expression levels for RNAs in the selected size range are higher because of the size enrichment. For example, as shown in Figure S2D, the TCGA microRNA data showed a higher normalized RNA expression for RNAs less than 35 nt, and a lower normalized RNA expression in comparison to RNAs longer than 35 nt. In contrast, analysis of the MGI data did not show a significant difference between the two length ranges. This indicates that without broadening the size range above 35nt, the expression of small RNAs longer than 35nt might be underestimated. Therefore, we recommend using the wider selection size range of 36-100 nt to accurately represent the full diversity of small RNAs.
In addition to the advantage of high depth sequencing of small RNA-seq libraries in discovering unannotated small RNAs, this approach also has an advantage for discovering unannotated lncRNAs. Most of the unannotated lncRNAs we identified had supporting reads in at least two patients, confirming they were not patient-specific. On the other hand, the standard read depth of TCGA RNA-seq data was insufficient to discover these lncRNAs, and accurately characterize their expression levels. While we have demonstrated the advantage of deep transcriptome sequencing for discovering and characterizing unannotated lncRNAs, the next challenge will be to prioritize biologically significant RNA genes expressed in cancer cells. To identify potentially relevant lncRNAs in AML, we performed an initial differential expression analysis but the lack of comparator data from RNA-seq of purified CD34 and promyelocytes limited our ability to discover differentially expressed RNAs in the AML samples. To overcome this, we sequenced RNA-seq libraries constructed from RNA derived from 6 flow-purified hematopoietic samples obtained from healthy unmatched donors (3 from CD34 cells and 3 from promyelocytes, Table S1), and performed a differential expression analysis comparing these samples to the 179 AML samples in the TCGA study. Using the standard-depth TCGA RNA-seq datasets, we were able to re-discover and validate differentially expressed lncRNAs associated with AML, such as PVT1, the overexpression of which has been shown to correlate with cell proliferation in leukemia35. Overall, the 23 differentially expressed lncRNAs discovered in this study also warrant further investigation (Table S6).
While small RNA sequencing and RNA-seq could provide unbiased views of RNA expression in cancer transcriptomes, more restricted RNAs sizes and read depths are clearly insufficient to fully characterize all potentially relevant RNAs. This may in turn hinder the identification of the altered RNAs most relevant for cancer pathogenesis. The optimum sequencing depth depends on the different expression levels of different types of RNAs. For example, in the deep sequencing small RNA dataset of AML31, piRNAs still tend to have lower RPM levels, and thus may need even more sequencing depth to best detect them. Based on the data in this study, we recommend creating libraries and sequencing ~10-15 million for small RNA sequencing. We have also shown that generating datasets with deep coverage will help researchers obtain comprehensive coverage of the whole non-coding RNA landscape. To gain more power in the discovery of differentially expressed RNAs, not only is higher depth needed, but also a large cohort, with at least several hundred of samples. The approaches profiled in this study provide an initial step towards improving RNA-based discoveries in cancers, by serving as a valuable resource to the community for benchmarking their methods on deep sequencing data. Overall, the analyses in this study highlight several areas where the community will benefit from improved sequencing strategies that may lead to the discovery of novel RNA species. Further investigation of these species in terms of their functional importance may then prove them relevant to understanding disease pathogenesis, and/or pathways that could be targeted by novel therapies.
Materials and Methods
Identification of annotated and unannotated small RNAs
The AML31 small RNA tumor and relapse datasets were used to detect annotated and unannotated small RNAs. Adapter sequences were trimmed using Flexbar36 and only reads ≥ 17 nt after trimming were kept. BWA37 was used to align the small RNA-seq reads to human reference genome hg19, using a quality threshold for read trimming down to 5 nt, a seed length of 17 nt, and maximum differences in the seed equal to 1 nt. Overlapping aligned were then merged in to read clusters. Expressed annotated small RNAs were identified by comparing the read clusters with annotated genes, and unannotated small RNAs were discovered after multiple filtering steps (Figure S1C). The gene annotation included miRNAs, piRNAs, tRNAs, snoRNAs, snRNAs, rRNAs, miscs, lncRNAs, and mRNAs. miRNAs were downloaded from miRBASE38. piRNAs and miscs were downloaded from ncrna.org. tRNAs and snoRNAs were downloaded from the tRNA Genes track and sno/miRNA track of the UCSC Genome Browser39. LncRNAs were downloaded from the lncRNA Transcript track of the UCSC Genome Browser39 and Ensembl Genome Browser33. snRNAs, rRNAs, and mRNAs were downloaded from the Ensembl Genome Browser.
A read cluster was assigned to an annotated small RNA if they had overlapping coordinates. A read cluster can overlap with more than one small RNA annotation and therefore was assigned to the small from which it most likely originated. To accomplish this, for each small RNA overlapping with a read cluster a ratio was calculated where the numerator was equal to two times the length of the overlap between the small RNA and read cluster, and the denominator was equal to the sum of the small RNA length and read cluster length. This resulting ratio has a range of 0 to 1 that correlates with the likelihood of the small RNA and read cluster overlapping. Therefore, a read cluster was assigned to the small RNA with the greatest ratio. After assigning read clusters to an annotated small RNA, the expressed small RNAs are grouped according to their length and the RPM values were calculated.
To discover unannotated small RNAs, the read clusters that did not overlap an annotated gene were compared with RefSeq40 UCSC39, and Ensembl33 genes. A further step was applied to remove clusters with greater than 50% overlapping a repetitive region using RepeatMasker (http://repeatmasker.org). Read clusters were filtered by requiring that at least one read from each cluster have a mapping quality greater than 10. Figure S1C shows the number of clusters remaining after each step for MGI AML31 tumor and relapse data resulting in the final list of unannotated small RNAs. Last, we required read clusters to be detectable in at least 5 TCGA samples.
Read counts of both annotated and unannotated small RNAs from the 25 primary AML and 2 unmatched CD34 bone marrow samples sequenced at MGI were calculated using HTseq-counts from the BAM files (using the same methods mentioned above). Differentially expressed small RNAs were predicted using edgeR41 with an FDR cutoff of 0.05 and a log fold change cutoff of 2.
Unannotated lncRNAs
AML31 RNA-seq samples were used to discover novel expressed transcripts using the same methods in18. Sequencing reads were aligned using TopHat242. Transcript assemblies were generated using Cufflinks43 in unannotated mode and subsequently merged together with Cuffmerge43 to generate a consensus transcriptome across the cohort.
To identify unannotated transcripts we generated an aggregated set of protein-coding genes annotated by RefSeq, UCSC, Ensembl and GENCODE. LncRNAs were downloaded as described in the section ‘Downloading and merging of lncRNAs transcripts from public databases’. Cuffcompare44 was used to compare the AML31 consensus transcriptome with annotated protein-coding and lncRNA genes. The Cuffcompare results were filtered for gene loci that were classified as unannotated (‘u’), and with multi exons. This subset was defined as ‘novel transcripts’ in AML.
Identification of DE and subtype specific lncRNAs
Differentially expressed (CD34 vs. M0-2,4-5 and Pro vs. M3) lncRNAs in AML patients were identified using edgeR41. Differentially expressed subtype specific lncRNAs were calculated using edgeR41.
Experimental validation for lncRNAs
Subtype specific and differentially expressed lncRNAs were selected for validation using the NanoString nCounter platform. Probes were designed for 19 differentially expressed candidates (7 for subtype specific and 12 for DE lncRNAs), and 6 unannotated lncRNAs. The NanoString probes for subtype-specific, differentially expressed, and unannotated lncRNAs are summarized in Table S7.
NanoString nCounter expression analysis was performed on 34 primary tumor TCGA AML samples (6, 5, 5, 6, 6, and 6 M0-5 subtypes) and 3 additional CD34 and Pro samples. 100 ng RNA from each sample was used in the validation. For primary TCGA AML samples, we normalized the expression of each lncRNA candidate, and marked the samples with z score larger than 2 or less than −2. NanoString counts were normalized by the positive controls, then the normalized read counts were used to calculate p-values using a t-test (Table S7). 6 (86%) subtype specific lncRNAs and 9 (75%) showed p-values less than 0.05. For the 6 unannotated lncRNAs, we compared NanoString counts with the negative controls.
Supplementary Material
Highlights.
Current sequencing strategies are inadequate to characterize the diversity of RNAs
Deep sequencing on 17-100 nt discovered previously unannotated small RNAs
Novel lncRNAs were discovered and validated from ultra deep transcriptome sequencing
We present the deepest RNA data for a human cancer patient as a community resource
Acknowledgments
We thank the McDonnell Genome Institute’s LIMS, Analysis Pipeline, and Systems groups for developing and maintaining the automated sequence analysis pipelines. This work was funded by grants to T.J.L. from the NCI (PO1CA101937) and to R.K.W. from the NHGRI (U54HG003079).
Footnotes
Publisher's Disclaimer: This is a PDF file of an unedited manuscript that has been accepted for publication. As a service to our customers we are providing this early version of the manuscript. The manuscript will undergo copyediting, typesetting, and review of the resulting proof before it is published in its final citable form. Please note that during the production process errors may be discovered which could affect the content, and all legal disclaimers that apply to the journal pertain.
Conflict of interest
The authors declare that they have no Conflict of interest.
Accession Numbers
The accession number for the sequence data reported in this paper is dbGaP: phs000159.
References
- 1.Prensner JR, Chinnaiyan AM. The emergence of lncRNAs in cancer biology. Cancer Discov. 2011;1:391–407. doi: 10.1158/2159-8290.CD-11-0209. [DOI] [PMC free article] [PubMed] [Google Scholar]
- 2.Cabanski CR, et al. Pan-cancer transcriptome analysis reveals long noncoding RNAs with conserved function. RNA Biol. 2015;12:628–642. doi: 10.1080/15476286.2015.1038012. [DOI] [PMC free article] [PubMed] [Google Scholar]
- 3.Guttman M, Russell P, Ingolia NT, Weissman JS, Lander ES. Ribosome Profiling Provides Evidence that Large Noncoding RNAs Do Not Encode Proteins. Cell. 2013;154:240–251. doi: 10.1016/j.cell.2013.06.009. [DOI] [PMC free article] [PubMed] [Google Scholar]
- 4.Hu GZ, Lou ZK, Gupta M. The Long Non-Coding RNA GAS5 Cooperates with the Eukaryotic Translation Initiation Factor 4E to Regulate c-Myc Translation. Plos One. 2014;9 doi: 10.1371/journal.pone.0107016. doi: ARTN e10701610.1371/journal.pone.0107016. [DOI] [PMC free article] [PubMed] [Google Scholar]
- 5.Prensner JR, et al. The long noncoding RNA SChLAP1 promotes aggressive prostate cancer and antagonizes the SWI/SNF complex. Nature Genetics. 2013;45:1392–+. doi: 10.1038/ng.2771. [DOI] [PMC free article] [PubMed] [Google Scholar]
- 6.Hu W, Yuan B, Flygare J, Lodish HF. Long noncoding RNA-mediated anti-apoptotic activity in murine erythroid terminal differentiation. Genes & development. 2011;25:2573–2578. doi: 10.1101/gad.178780.111. [DOI] [PMC free article] [PubMed] [Google Scholar]
- 7.Ng SY, Johnson R, Stanton LW. Human long non-coding RNAs promote pluripotency and neuronal differentiation by association with chromatin modifiers and transcription factors. The EMBO journal. 2012;31:522–533. doi: 10.1038/emboj.2011.459. [DOI] [PMC free article] [PubMed] [Google Scholar]
- 8.Wagner LA, et al. EGO, a novel, noncoding RNA gene, regulates eosinophil granule protein transcript expression. Blood. 2007;109:5191–5198. doi: 10.1182/Blood-2006-06-027987. [DOI] [PMC free article] [PubMed] [Google Scholar]
- 9.Zhang XQ, et al. A myelopoiesis-associated regulatory intergenic noncoding RNA transcript within the human HOXA cluster. Blood. 2009;113:2526–2534. doi: 10.1182/Blood-2008-06-162164. [DOI] [PMC free article] [PubMed] [Google Scholar]
- 10.Benetatos L. CpG methylation analysis of the MEG3 and SNRPN imprinted genes in acute myeloid leukemia and myelodysplastic syndromes. Leukemia Res. 2010;34:148–153. doi: 10.1016/J.Leukres.2009.06.019. [DOI] [PubMed] [Google Scholar]
- 11.Garding A, et al. Epigenetic upregulation of lncRNAs at 13q14.3 in leukemia is linked to the In Cis downregulation of a gene cluster that targets NF-kB. PLoS genetics. 2013;9:e1003373. doi: 10.1371/journal.pgen.1003373. [DOI] [PMC free article] [PubMed] [Google Scholar]
- 12.Sun JN, et al. A novel antisense long noncoding RNA within the IGF1R gene locus is imprinted in hematopoietic malignancies. Nucleic acids research. 2014;42:9588–9601. doi: 10.1093/Nar/Gku549. [DOI] [PMC free article] [PubMed] [Google Scholar]
- 13.Trimarchi T, et al. Genome-wide Mapping and Characterization of Notch-Regulated Long Noncoding RNAs in Acute Leukemia. Cell. 2014;158:593–606. doi: 10.1016/J.Cell.2014.05.049. [DOI] [PMC free article] [PubMed] [Google Scholar]
- 14.Derrien T, et al. The GENCODE v7 catalog of human long noncoding RNAs: Analysis of their gene structure, evolution, and expression. Genome Res. 2012;22:1775–1789. doi: 10.1101/Gr.132159.111. [DOI] [PMC free article] [PubMed] [Google Scholar]
- 15.Guttman M, et al. Ab initio reconstruction of cell type-specific transcriptomes in mouse reveals the conserved multi-exonic structure of lincRNAs. Nature biotechnology. 2010;28:503–510. doi: 10.1038/nbt.1633. [DOI] [PMC free article] [PubMed] [Google Scholar]
- 16.Iyer MK, et al. The landscape of long noncoding RNAs in the human transcriptome. Nat Genet. 2015;47:199–208. doi: 10.1038/ng.3192. [DOI] [PMC free article] [PubMed] [Google Scholar]
- 17.Prensner JR, et al. Transcriptome sequencing across a prostate cancer cohort identifies PCAT-1, an unannotated lincRNA implicated in disease progression. Nature biotechnology. 2011;29:742–749. doi: 10.1038/nbt.1914. [DOI] [PMC free article] [PubMed] [Google Scholar]
- 18.White NM, et al. Transcriptome sequencing reveals altered long intergenic non-coding RNAs in lung cancer. Genome biology. 2014;15:429. doi: 10.1186/s13059-014-0429-8. [DOI] [PMC free article] [PubMed] [Google Scholar]
- 19.Griffith M, Walker JR, Spies NC, Ainscough BJ, Griffith OL. Informatics for RNA Sequencing: A Web Resource for Analysis on the Cloud. Plos Comput Biol. 2015;11 doi: 10.1371/journal.pcbi.1004393. doi:ARTN e100439310.1371/journal.pcbi.1004393. [DOI] [PMC free article] [PubMed] [Google Scholar]
- 20.Gupta RA, et al. Long non-coding RNA HOTAIR reprograms chromatin state to promote cancer metastasis. Nature. 2010;464:1071–1076. doi: 10.1038/nature08975. [DOI] [PMC free article] [PubMed] [Google Scholar]
- 21.Prensner JR, et al. RNA biomarkers associated with metastatic progression in prostate cancer: a multi-institutional high-throughput analysis of SChLAP1. Lancet Oncol. 2014;15:1469–1480. doi: 10.1016/S1470-2045(14)71113-1. [DOI] [PMC free article] [PubMed] [Google Scholar]
- 22.Grossman SR, et al. Identifying Recent Adaptations in Large-Scale Genomic Data. Cell. 2013;152:703–713. doi: 10.1016/j.cell.2013.01.035. [DOI] [PMC free article] [PubMed] [Google Scholar]
- 23.Ding L, et al. Clonal evolution in relapsed acute myeloid leukaemia revealed by whole-genome sequencing. Nature. 2012;481:506–510. doi: 10.1038/nature10738. [DOI] [PMC free article] [PubMed] [Google Scholar]
- 24.Griffith M, et al. Optimizing cancer genome sequencing and analysis. Cell Syst. 2015;1:210–223. doi: 10.1016/j.cels.2015.08.015. [DOI] [PMC free article] [PubMed] [Google Scholar]
- 25.Klco JM, et al. Functional heterogeneity of genetically defined subclones in acute myeloid leukemia. Cancer Cell. 2014;25:379–392. doi: 10.1016/j.ccr.2014.01.031. [DOI] [PMC free article] [PubMed] [Google Scholar]
- 26.Ley TJ. Genomic and Epigenomic Landscapes of Adult De Novo Acute Myeloid Leukemia (vol 368, pg 2059, 2013) New Engl J Med. 2013;369:98–98. doi: 10.1056/NEJMoa1301689. [DOI] [PMC free article] [PubMed] [Google Scholar]
- 27.Bartel DP. MicroRNAs: genomics, biogenesis, mechanism, and function. Cell. 2004;116:281–297. doi: 10.1016/s0092-8674(04)00045-5. [DOI] [PubMed] [Google Scholar]
- 28.Seto AG, Kingston RE, Lau NC. The coming of age for Piwi proteins. Mol Cell. 2007;26:603–609. doi: 10.1016/j.molcel.2007.05.021. [DOI] [PubMed] [Google Scholar]
- 29.Sharp SJ, Schaack J, Cooley L, Burke DJ, Soll D. Structure and transcription of eukaryotic tRNA genes. CRC Crit Rev Biochem. 1985;19:107–144. doi: 10.3109/10409238509082541. [DOI] [PubMed] [Google Scholar]
- 30.Bachellerie JP, Cavaille J, Huttenhofer A. The expanding snoRNA world. Biochimie. 2002;84:775–790. doi: 10.1016/s0300-9084(02)01402-5. [DOI] [PubMed] [Google Scholar]
- 31.Matera AG, Terns RM, Terns MP. Non-coding RNAs: lessons from the small nuclear and small nucleolar RNAs. Nat Rev Mol Cell Biol. 2007;8:209–220. doi: 10.1038/nrm2124. [DOI] [PubMed] [Google Scholar]
- 32.Yusupov MM, et al. Crystal structure of the ribosome at 5.5 A resolution. Science. 2001;292:883–896. doi: 10.1126/science.1060089. [DOI] [PubMed] [Google Scholar]
- 33.Hubbard T, et al. The Ensembl genome database project. Nucleic acids research. 2002;30:38–41. doi: 10.1093/Nar/30.1.38. [DOI] [PMC free article] [PubMed] [Google Scholar]
- 34.Payton JE, et al. High throughput digital quantification of mRNA abundance in primary human acute myeloid leukemia samples. J Clin Invest. 2009;119:1714–1726. doi: 10.1172/Jci38248. [DOI] [PMC free article] [PubMed] [Google Scholar]
- 35.Zeng CW, et al. Overexpression of the long non-coding RNA PVT1 is correlated with leukemic cell proliferation in acute promyelocytic leukemia. J Hematol Oncol. 2015;8 doi: 10.1186/s13045-015-0223-4. doi:ARTN 12610.1186/s13045-015-0223-4. [DOI] [PMC free article] [PubMed] [Google Scholar]
- 36.Dodt M, Roehr JT, Ahmed R, Dieterich C. FLEXBAR-Flexible Barcode and Adapter Processing for Next-Generation Sequencing Platforms. Biology (Basel) 2012;1:895–905. doi: 10.3390/biology1030895. [DOI] [PMC free article] [PubMed] [Google Scholar]
- 37.Li H, Durbin R. Fast and accurate short read alignment with Burrows-Wheeler transform. Bioinformatics. 2009;25:1754–1760. doi: 10.1093/bioinformatics/btp324. [DOI] [PMC free article] [PubMed] [Google Scholar]
- 38.Griffiths-Jones S. The microRNA Registry. Nucleic acids research. 2004;32:D109–111. doi: 10.1093/nar/gkh023. [DOI] [PMC free article] [PubMed] [Google Scholar]
- 39.Kent WJ, et al. The human genome browser at UCSC. Genome Res. 2002;12:996–1006. doi: 10.1101/Gr.229102. [DOI] [PMC free article] [PubMed] [Google Scholar]
- 40.Pruitt KD, et al. RefSeq: an update on mammalian reference sequences. Nucleic acids research. 2014;42:D756–D763. doi: 10.1093/Nar/Gkt1114. [DOI] [PMC free article] [PubMed] [Google Scholar]
- 41.Robinson MD, McCarthy DJ, Smyth GK. edgeR: a Bioconductor package for differential expression analysis of digital gene expression data. Bioinformatics. 2010;26:139–140. doi: 10.1093/bioinformatics/btp616. [DOI] [PMC free article] [PubMed] [Google Scholar]
- 42.Kim D, et al. TopHat2: accurate alignment of transcriptomes in the presence of insertions, deletions and gene fusions. Genome biology. 2013;14:R36. doi: 10.1186/gb-2013-14-4-r36. [DOI] [PMC free article] [PubMed] [Google Scholar]
- 43.Trapnell C, et al. Transcript assembly and quantification by RNA-Seq reveals unannotated transcripts and isoform switching during cell differentiation. Nature biotechnology. 2010;28:511–515. doi: 10.1038/nbt.1621. [DOI] [PMC free article] [PubMed] [Google Scholar]
- 44.Trapnell C, et al. Differential gene and transcript expression analysis of RNA-seq experiments with TopHat and Cufflinks. Nat Protoc. 2012;7:562–578. doi: 10.1038/nprot.2012.016. [DOI] [PMC free article] [PubMed] [Google Scholar]
Associated Data
This section collects any data citations, data availability statements, or supplementary materials included in this article.