

Abstract
Brown adipose tissue (BAT) plays an important role in whole body metabolism and with appropriate stimulus could potentially mediate weight gain and insulin sensitivity. Although imaging techniques are available to detect subsurface BAT, there are currently no viable methods for continuous acquisition of BAT energy expenditure. Microwave (MW) radiometry is an emerging technology that allows the quantification of tissue temperature variations at depths of several centimeters. Such temperature differentials may be correlated with variations in metabolic rate, thus providing a quantitative approach to monitor BAT metabolism. In order to optimize MW radiometry, numerical and experimental phantoms with accurate dielectric properties are required to develop and calibrate radiometric sensors. Thus, we present for the first time, the characterization of relative permittivity and electrical conductivity of brown (BAT) and white (WAT) adipose tissues in rats across the MW range 0.5–10GHz. Measurements were carried out in situ and post mortem in six female rats of approximately 200g. A Cole-Cole model was used to fit the experimental data into a parametric model that describes the variation of dielectric properties as a function of frequency. Measurements confirm that the dielectric properties of BAT (εr = 14.0–19.4, σ = 0.3–3.3S/m) are significantly higher than those of WAT (εr = 9.1–11.9, σ = 0.1–1.9S/m), in accordance with the higher water content of BAT.
Keywords: brown adipose tissue, microwave radiometry, dielectric properties, metabolism, diabetes, obesity
Introduction
Adipose tissues play a critical role in the energy homeostasis of mammalian bodies. These tissues are mainly composed of white and brown adipocytes, which present different morphology and homeostatic functions [1]. White fat is mainly associated with energy storage whereas brown fat metabolizes fat to generate heat when stimulated [2]. The metabolism produced by brown fat may be estimated using non-invasive tissue temperature measurement techniques such as microwave radiometry. This electromagnetic thermal sensing technique is optimized using numerical and experimental phantoms that require a priori knowledge of tissue dielectric properties. Currently, there are no dielectric properties data available on brown fat. Thus, the goal of this study is to characterize the dielectric properties (relative permittivity εr and electrical conductivity σ) of both brown and white adipose tissues for use in electromagnetic-based thermal sensing techniques that allow the measurement and long term monitoring of brown fat metabolism.
White adipose tissue (WAT) is composed of white adipocytes, which are filled with one large lipid droplet (figure 1a) that pushes the nuclei to the side of the cell. White adipocytes main function is energy storage in the form of triglycerides, which occurs during meals, and energy release in the form of fatty acids, which occurs between meals. Long term imbalance between energy intake and expenditure will lead to excess accumulation of WAT, which can in turn lead to obesity. White adipocytes are also responsible for releasing hormones that tend to lower whole-body metabolism and promote insulin resistance, which further aggravate obesity and contribute to the appearance of type 2 diabetes [3, 4].
Figure 1.

Scanning electron microscopy of (a) white adipose cells composed of a single large droplet and (b) brown adipose cells composed of numerous smaller droplets. Reprinted with permission from [5].
Brown adipocytes, on the other hand, present numerous smaller droplets in the cytoplasm (figure 1b), are densely vascularized, and are rich in large mitochondria containing the protein UCP1, which is uniquely expressed in these cells. UCP1 protein is responsible for uncoupling the oxidative phosphorylation that in turn is responsible for heat production [4, 6]. This thermogenic process is characteristic of brown adipose tissue (BAT) and is responsible for the dissipation of stored energy, hence playing a concurrent role with WAT in energy homeostasis. Thus, the ability to stimulate BAT activity may help mediate weight gain and insulin sensitivity [7–11].
Interestingly, BAT cells can be activated with cold exposure. Cold excites the sympathetic nervous system and consequent release of norepinephrine (NE) at the sympathetic nerve terminals, which profusely innervate BAT cells. This pathway leads to UCP1 activation and consequent heat generation [7, 12]. The increased metabolism associated with thermogenesis is a good indicator of BAT activity. Controlled modulation of BAT activity could lead to effective treatments for obesity and associated diseases such as type 2 diabetes and metabolic syndrome [3, 7, 13].
BAT was thought to exist in significant amounts only in infants, small animals, and hibernating animals. Using PET/CT (positron emission tomography/computed tomography) however, metabolically active BAT has now been found in well-defined regions (BAT depots) along the upper chest and upper back of adults [14, 15]. PET/CT has proven most effective for locating BAT due to its high uptake of radioactive-labelled glucose, measured in terms of 18F-fluorodeoxyglucose [16–18]. These studies are expensive and non-portable however, and risks associated with radiation exposure prevent repetitive scanning. Functional magnetic resonance functional imaging (fMRI) has also been used, but is similarly expensive and poorly-suited for repetitive or long-term continuous investigations [2, 19, 20]. Infrared thermography is a passive approach that has demonstrated feasibility for locating BAT. It detects increased metabolic activity from conduction of locally increased temperature at depth to the skin surface [21]. However, infrared radiation does not penetrate more than few millimeters. Thus thermal imaging is not sufficiently sensitive to quantify small changes in the metabolic activity of subsurface BAT regions that extend 1–3 centimeters deep and have a thermal signature that is affected by blood flow of overlying tissues as well as environmental conditions [22]. In summary, all three imaging techniques are logistically unsuited to continuously track changes in BAT activity over a long period of time [23].
A new technology is required to facilitate long term studies of BAT metabolic activity. It must be painless, non-toxic, reliable, sensitive to several centimeters depth, and inexpensive enough for long term monitoring in large patient studies. Microwave radiometry was recently proposed for this purpose since it fits all these requirements [24–27]. This technique uses a small microwave antenna on the skin surface to collect thermal radiation emitted by human tissues such as brown fat that are in the antenna radiation pattern. Once the sensor is calibrated, the received power is calibrated and converted into a volume-averaged measure of absolute temperature of the deep tissue target [26, 28–30]. The conversion algorithm relies on accurate characterization of electromagnetic wave propagation through the tissue between antenna and BAT target. Water and lipid content determines the transmission loss through human tissue, characterized by dielectric properties [31, 32]. Dielectric properties have been extensively studied for several tissues in humans and in animals [33], but they have not yet been characterized for brown fat. This paper will characterize for the first time the frequency-dependent dielectric properties in the range 0.5–10GHz, at normal body temperature, for both brown and white fat in rats.
Methods
Six 8-month-old female rats (Rattus Norvegicus) were obtained from the Mississippi State University College of Veterinarian Medicine. They weighted on average 200g and were presented in good health. The most typically studied BAT depots in rodents are located in the interscapular region [34, 35]. After euthanasia (CO2 monitored until confirmed death), the skin was removed from the interscapular region and BAT could be easily identified between the shoulders (figure 2a). The dielectric properties were then measured in situ and post mortem using a dielectric properties measurement probe (Agilent E85070 Slim Form Probe, Keysight Technologies, Santa Rosa CA) and microwave network analyzer (Agilent E8362B, Keysight Technologies, Santa Rosa CA) as observed in figure 2b. The mean and percentage standard deviation of the mean (SDM) were then calculated for the permittivity and conductivity at each measurement frequency, with SDM being determined as the average over the analyzed frequency range 0.5–10Ghz.
Figure 2.
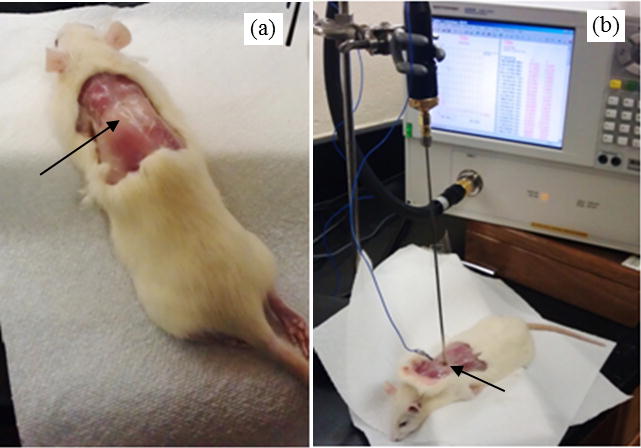
Rattus Norvegicus displaying region of brown adipose tissue (a) and experimental setup for measuring the dielectric properties of BAT while monitoring BAT temperature (b).
Since dielectric properties are temperature dependent, BAT internal temperature was monitored continuously using a fiber optic temperature sensor (FISO, Quebec Canada). For all six rats, in situ measurements were taken from three distinct interscapular BAT samples with tissue temperatures of 37 ± 1°C. WAT dielectric properties were measured in the lower abdomen and upper thigh regions using the same procedure and at the same temperature. These studies were conducted in accordance with a protocol approved by the Institutional Animal Care and Use Committee at Mississippi State University.
Dielectric properties are well defined by the complex relative permittivity (unitless) that describes the ability of a medium to support an electric field:
| (1) |
where is the relative permittivity and the loss factor. Both real and imaginary components can be measured directly, but in regards to the loss factor, electrical conductivity (units S/m) is preferred and is given by
| (2) |
where f (units rad/s) is the angular frequency of the electromagnetic field and = 8.85×10⁻¹² F/m the permittivity of free space. Both relative permittivity and electrical conductivity are tissue, frequency and temperature dependent [33]. For simplicity, εr will be used in the remaining document to represent relative permittivity.
The Cole-Cole equation is widely used in the literature [36–38] because it provides a simple and accurate model of frequency dependent complex dielectric permittivity. In heterogeneous materials such as biological tissue, there are several dispersion mechanisms over the electromagnetic frequency spectrum. In the microwave (MW) range 0.5–10GHz however, the dominant mechanism – γ dispersion – is associated with the orientation of polarized dipoles such as water molecules that are a major component of biological tissue [31]. Thus, the Cole-Cole equation may be expressed as a single-pole case, where the frequency dependence of the complex relative permittivity is defined as
| (3) |
where τ is the time constant that characterizes the polarization mechanism; ε∞ is the permittivity at field frequencies where ωτ >> 1 and εs the permittivity at ωτ << 1; σi is the conductivity due to ionic drift and to the lower frequency polarization mechanisms; Δε = εs − ε∞ is the magnitude of the dispersion; and α is a measure of the broadening of the dispersion [36]. In addition to these parameters, we also determined the relaxation frequency (fR = 1/2πτ) associated with the γ dispersion considered in equation (3). For tissues in the 0.5–20GHz range, it was recently shown that a single pole has been proven to suffice to fit tissue dielectric properties [37]. Outside this MW frequency range, multiple Cole-Cole dispersions are required to accommodate other polarization mechanisms. To fit the model to measurements, the following fitness function was minimized using the particle swarm optimization method, where each Cole-Cole parameter represents a dimension in the solution space:
| (4) |
where and are the measured target data, and and are the computed candidate values [39].
Results
Figures 3 and 4 present the dielectric properties of BAT and WAT tissues in the range 0.5–10GHz measured in immediately post-mortem rats. The data points correspond to the average of measurements from 6 rats and show similar trends between the white and brown adipose tissues. The optimization of the Cole-Cole equation results in the parameters given in table 1, with the fitted values plotted in solid and dashed lines in figures 3 and 4. The small oscillations observed in the measured data occur due to reflections from the surrounding bone and muscle tissues. This is especially relevant in small animals that have thin tissue layers, but the oscillations do not affect significantly the overall trend or the fitting optimization.
Figure 3.

Measured relative permittivity of in situ 37°C BAT and WAT tissues of immediately post-mortem rat (n=6) with Cole-Cole model fits, where SDMBAT = 3.8% and SDMWAT = 5.6%.
Figure 4.

Measured electrical conductivity of in situ 37°C BAT and WAT tissues of immediately post-mortem rat (n=6) with Cole-Cole model fits, where SDMBAT = 3.9% and SDMWAT = 12.5%.
Table 1.
Parameters for the Cole-Cole model obtained from measured data in different adipose tissues in rats.
| Fitting parameter | WAT | BAT |
|---|---|---|
| ε∞ | 3.05 | 3.95 |
| Δε | 8.954 | 15.731 |
| τ (ps) | 9.015 | 10.078 |
| α | 0.169 | 0.186 |
| σi | 0.123 | 0.221 |
| fR (GHz) | 17.654 | 15.792 |
Figures 5 and 6 compare the Cole-Cole model fits of brown and white fat data in rats measured in the current study with the Cole-Cole models for human muscle and white fat retrieved from the literature [36], as well as with the Cole-Cole model for rat muscle retrieved from Peyman et al. [40]. Muscle dielectric properties are roughly similar for human and rat tissues. The relative permittivity of WAT in rats is two times higher than in humans over the entire measurement range 0.5–10GHz (figure 5). Although similar at lower frequencies (0.5–4GHz), the electrical conductivity in rats increases more rapidly at higher frequencies than in humans, reaching 1.88S/m compared to just 0.59S/m for human WAT (figure 6). However, the BAT dielectric properties measured in rats fall between the muscle and WAT values for both rat and human tissues.
Figure 5.

Comparison of relative permittivity of brown and white fat in rats (reported here), rat muscle [40] and muscle and white fat tissues in humans [36].
Figure 6.

Comparison of electrical conductivity of brown and white fat in rats (reported here), rat muscle [40] and muscle and white fat tissues in humans [36].
Discussion
The measurement of tissue dielectric properties is challenging because it is dependent on several factors, such as the physiological state of the tissue, tissue inhomogeneity, and anisotropy [31]. To mitigate these effects and highlight the major dielectric differences between brown and white adipose tissues, the measurements were carried out in situ and post-mortem. After death, osmosis causes progressive cell swelling and tissue damage. As a consequence, dielectric properties will change depending on the length of time after death, but they remain relatively unchanged for a period of 30–120min, depending on tissue type [31, 37]. All measurements in this study occurred within 5–15min after death to avoid any error associated with tissue changes after death. In situ measurements were preferred to measurements in excised samples to avoid loss of body fluids and heat which influence dielectric properties [31, 41]. Regarding to anisotropy, it becomes relevant only in skin and muscle tissues that have preferred electric paths for ion movement, e.g. along muscle fibers; that is not the case for either brown or white fat. The accuracy of measurements also depends on the probe sensing volume, which in our case corresponds to a sphere of about 5mm sensing radius in lossy tissue. Although in practice both BAT and WAT are closely surrounded by muscle or bone, the tissues were excised after measurement to confirm that each measurement site had a thickness of at least 5mm to minimize the reflections from surrounding tissues.
There is a well-known correlation between tissue water content and dielectric properties, where both permittivity and electrical conductivity increase directly with water content [41]. Reinoso et al. [42] measured an 18% and 76% water content in ex vivo rat white fat and muscle tissue, respectively. Current MR techniques allow in situ measurements and recently, Rasmussen et al. [35] determined a 25% higher water content in BAT (57%) when compared to WAT (32%), which is expected since BAT is highly vascularized and blood has high water content. The water content difference in WAT between both reported experiments (18% and 25%) is related to the fluid loss that occurs when measurements are implemented ex vivo, which highlights the relevance of doing in situ measurements. As observed in figures 5 and 6, the dielectric properties of BAT are between those of WAT and muscle, which is in agreement with the direct correlation between water content and dielectric properties.
The Cole-Cole parameters obtained in this study are summarized in table 1. The data confirm that as expected, ε∞ and σs are higher for brown fat due to its higher water content. For the same reason, Δε is higher for brown fat, since this parameter reflects the amount of free water in the tissue. The mean relaxation time (τ) is longer for both tissues than the value for water (6.2), indicating a restriction in the rotational ability of at least some of the tissue water molecules due to the organic environment [36]. The white fat cells have a spherical shape and ~90% of their volume is comprised by a single cytoplasmic lipid droplet and a ‘squeezed’ nucleus, whereas brown adipocytes are polygonal cells with a roundish nucleus and several cytoplasmic lipid droplets (figure 1). Brown adipocytes are also characterized by numerous large mitochondria packed with cristae [1]. This heterogeneity might explain the higher broadening of the dispersion (α) in brown fat. These Cole-Cole parameters were fitted using the particle swarm optimization (PSO) method, where we allowed ε∞ to vary, contrarily to Gabriel’s study that fixed ε∞ at 2.5 or 4 for low and high water-content tissues, respectively [36]. A recent study by Sasaki et al. [38] addressed this limitation and used the least squares method to improve the Gabriel curve fits with success. Despite these differences, the PSO method proved to be a valid and useful approach to fit Cole-Cole parameters to the measured data.
In figures 3 and 4 one can observe that rat WAT dielectric properties are higher than human WAT. This is an indication that the rat adipose tissue should have a higher level of blood infiltration, whereas in the analyzed human WAT it should be closer to pure fatty tissue with lower water content. In terms of measurements deviation, the rodent white fat presents a high SDM (5.6% for εr and 12.5% for σ, n=6), which is in accordance with other fatty tissues reported in literature [33, 37, 43]. The SDM for brown fat was 3.8% for εr and 3.9% for σ (n=6) and is within the range of other tissues: 1–5% from 0.3–5% [44].
One limitation of the present study is the analyzed range 0.5–10GHz, which does not cover the relaxation frequency characteristic of the γ dispersion reported to be within 9–20GHz [36, 38]. We obtained fR = 17.6GHz for WAT and fR = 15.8 GHz for BAT. Nonetheless, the model fits our data well and is valid for studies at frequencies below 10 GHz which are useful for microwave radiometry purposes. In addition, there are other thermal medicine applications that operate at e.g. 915Mhz and 2.45 GHz that might also benefit from differentiating brown fat and white fat dielectric properties in their electromagnetic models [45, 46].
The end goal of ongoing studies on BAT metabolism is to understand the possible role of BAT in obesity and insulin resistance. Activating BAT is a key aspect, which can be accomplished by noradrenergic stimulation or cold exposure. Orava et al. demonstrated up to 12-fold increase in glucose uptake during cold exposure of 17°C ambient temperature for 2 hours [47]. This metabolism increase in BAT tissue was accompanied by doubling of blood perfusion to accommodate the increased demand of glucose and provide oxygen for mitochondria activity. However, the water content only changes about 10% [48, 49] and thus we do not expect significant changes in the dielectric properties ounce BAT is activated.
The increased metabolism and blood flow, which transfer heat from BAT to other parts of the body, result in a measureable temperature change in the BAT region of the order of 2°C [22, 24]. Tissue temperature influences dielectric properties, but for a 2°C differential above core temperature only 1–3% variation in dielectric properties is expected [50]. Different levels of BAT activation will result in different levels of temperature rise that can be detected at depths of several centimeters from the skin surface and correlated with BAT metabolism using a microwave radiometer sensor. The dielectric properties of brown and white fat reported in this work can now be assigned to experimental and numerical fat phantoms, an essential step in the development and calibration of radiometric temperature sensors.
Conclusions
We report the measurement of dielectric properties of brown and white fat in rats. These results fill a void in the existing knowledge of tissue dielectric properties of brown adipose tissue and its relation to white fat. A single-pole Cole-Cole model proved to be adequate to describe the frequency dependence of dielectric properties of both tissues in the range 0.5–10GHz. Both BAT dielectric properties (relative permittivity and electrical conductivity) are higher than those of WAT. This is in accordance with the higher water content of BAT, which typically correlates directly with dielectric properties. The dielectric properties characterized in this work will support the development and calibration of microwave-based technologies to monitor and/or activate brown fat metabolism continuously, in a non-invasive and cost effective manner. This data should improve the accuracy of microwave radiometry and thereby enable future research that improves our understanding of BAT metabolism in humans through continuous monitoring of BAT activity during drug development trials for control of diabetes and obesity.
Acknowledgments
The authors would like to acknowledge fundamental support from NIH R21-DK092912 and NIH R21GM111560. We would also like to recognize the crucial software and hardware support from Keysight Technologies (Marshall Kay, Art Lizotte).
References
- 1.Cinti S. The adipose organ at a glance. Dis Model Mech. 2012;5:588–94. doi: 10.1242/dmm.009662. [DOI] [PMC free article] [PubMed] [Google Scholar]
- 2.Hu HH, Perkins TG, Chia JM, Gilsanz V. Characterization of human brown adipose tissue by chemical-shift water-fat MRI. Am J Roentgenol. 2013;200:177–83. doi: 10.2214/AJR.12.8996. [DOI] [PMC free article] [PubMed] [Google Scholar]
- 3.Frigolet Vazquez-Vela ME, Torres N, Tovar AR. White Adipose Tissue as Endocrine Organ and Its Role in Obesity. Arch Med Res. 2008;39:715–28. doi: 10.1016/j.arcmed.2008.09.005. [DOI] [PubMed] [Google Scholar]
- 4.Cinti S. Transdifferentiation properties of adipocytes in the adipose organ. Am J Physiol Endocrinol Metabol. 2009;297:E977–E86. doi: 10.1152/ajpendo.00183.2009. [DOI] [PubMed] [Google Scholar]
- 5.Cinti S. The Adipose Organ (Milan, Italy: Kurtis) 1999 [Google Scholar]
- 6.Dempersmier J, Sambeat A, Gulyaeva O, Paul SM, Hudak CS, Raposo HF, Kwan HY, Kang C, Wong RH, Sul HS. Cold-inducible Zfp516 activates UCP1 transcription to promote browning of white fat and development of brown fat. Mol Cell. 2015;57:235–46. doi: 10.1016/j.molcel.2014.12.005. [DOI] [PMC free article] [PubMed] [Google Scholar]
- 7.Haas B, Schlinkert P, Mayer P, Eckstein N. Targeting adipose tissue. Diabetol Metab Syndr. 4(2012):43. doi: 10.1186/1758-5996-4-43. [DOI] [PMC free article] [PubMed] [Google Scholar]
- 8.Schulz TJ, Huang P, Huang TL, Xue R, McDougall LE, Townsend KL, Cypess AM, Mishina Y, Gussoni E, Tseng YH. Brown-fat paucity due to impaired BMP signalling induces compensatory browning of white fat. Nature. 2013;495:379–83. doi: 10.1038/nature11943. [DOI] [PMC free article] [PubMed] [Google Scholar]
- 9.Nedergaard J, Cannon B. The browning of white adipose tissue: some burning issues. Cell Metab. 2014;20:396–407. doi: 10.1016/j.cmet.2014.07.005. [DOI] [PubMed] [Google Scholar]
- 10.Elattar S, Satyanarayana A. Can Brown Fat Win the Battle Against White Fat? J Cell Physiol. 2015;230:2311–7. doi: 10.1002/jcp.24986. [DOI] [PMC free article] [PubMed] [Google Scholar]
- 11.Cohen P, Spiegelman BM. Brown and Beige Fat: Molecular Parts of a Thermogenic Machine. Diabetes. 2015;64:2346–51. doi: 10.2337/db15-0318. [DOI] [PMC free article] [PubMed] [Google Scholar]
- 12.Cinti S. The adipose organ. Prostaglandins Leukot Essent Fatty Acids. 2005;73:9–15. doi: 10.1016/j.plefa.2005.04.010. [DOI] [PubMed] [Google Scholar]
- 13.Hossain P, Kawar B, Nahas ME. Obesity and diabetes in the developing world - A growing challenge. N Engl J Med. 2007;356:213–5. doi: 10.1056/NEJMp068177. [DOI] [PubMed] [Google Scholar]
- 14.Nedergaard J, Bengtsson T, Cannon B. Unexpected evidence for active brown adipose tissue in adult humans. Am J Physiol Endocrinol Metabol. 2007;293:E444–E52. doi: 10.1152/ajpendo.00691.2006. [DOI] [PubMed] [Google Scholar]
- 15.Richard D, Monge-Roffarello B, Chechi K, Labbe SM, Turcotte EE. Control and physiological determinants of sympathetically mediated brown adipose tissue thermogenesis. Front Endocrinol. 2012;3:36. doi: 10.3389/fendo.2012.00036. [DOI] [PMC free article] [PubMed] [Google Scholar]
- 16.Cypess AM, Lehman S, Williams G, Tal I, Rodman D, Goldfine AB, Kuo FC, Palmer EL, Tseng YH, Doria A, Kolodny GM, Kahn CR. Identification and importance of brown adipose tissue in adult humans. N Engl J Med. 2009;360:1509–17. doi: 10.1056/NEJMoa0810780. [DOI] [PMC free article] [PubMed] [Google Scholar]
- 17.Virtanen KA, Lidell ME, Orava J, Heglind M, Westergren R, Niemi T, Taittonen M, Laine J, Savisto NJ, Enerback S, Nuutila P. Functional brown adipose tissue in healthy adults. N Engl J Med. 2009;360:1518–25. doi: 10.1056/NEJMoa0808949. [DOI] [PubMed] [Google Scholar]
- 18.Muzik O, Mangner TJ, Granneman JG. Assessment of oxidative metabolism in brown fat using PET imaging. Front Endocrinol. 2012;3:15. doi: 10.3389/fendo.2012.00015. [DOI] [PMC free article] [PubMed] [Google Scholar]
- 19.Lunati E, Marzola P, Nicolato E, Fedrigo M, Villa M, Sbarbati A. In vivo quantitative lipidic map of brown adipose tissue by chemical shift imaging at 4.7 tesla. J Lipid Res. 1999;40:1395–400. [PubMed] [Google Scholar]
- 20.Chen Y-CI, Cypess AM, Chen Y-C, Palmer M, Kolodny G, Kahn CR, Kwong KK. Measurement of Human Brown Adipose Tissue Volume and Activity Using Anatomic MR Imaging and Functional MR Imaging. J Nucl Med. 2013;54:1584–7. doi: 10.2967/jnumed.112.117275. [DOI] [PMC free article] [PubMed] [Google Scholar]
- 21.Rothwell NJ, Stock MJ. A role for brown adipose tissue in diet-induced thermogenesis. Nature. 1979;281:31–5. doi: 10.1002/j.1550-8528.1997.tb00591.x. [DOI] [PubMed] [Google Scholar]
- 22.Lee P, Ho KKY, Greenfield JR. Hot fat in a cool man: infrared thermography and brown adipose tissue. Diabetes Obes Metab. 2011;13:92–3. doi: 10.1111/j.1463-1326.2010.01318.x. [DOI] [PubMed] [Google Scholar]
- 23.Cypess Aaron M, Haft Carol R, Laughlin Maren R, Hu Houchun H. Brown Fat in Humans: Consensus Points and Experimental Guidelines. Cell Metab. 2014;20:408–15. doi: 10.1016/j.cmet.2014.07.025. [DOI] [PMC free article] [PubMed] [Google Scholar]
- 24.Rodrigues DB, Maccarini PF, Salahi S, Colebeck E, Topsakal E, Pereira PJ, Limao-Vieira P, Stauffer PR. Numerical 3D modeling of heat transfer in human tissues for microwave radiometry monitoring of brown fat metabolism. Proc SPIE. 2013;8584:S1–12. doi: 10.1117/12.2004931. [DOI] [PMC free article] [PubMed] [Google Scholar]
- 25.Stauffer PR, Rodriques DB, Salahi S, Topsakal E, Oliveira TR, Prakash A, D’Isidoro F, Reudink D, Snow BW, Maccarini PF. Stable Microwave Radiometry System for Long Term Monitoring of Deep Tissue Temperature. Proc SPIE. 2013;8584:R1–12. doi: 10.1117/12.2003976. [DOI] [PMC free article] [PubMed] [Google Scholar]
- 26.Rodrigues DB, Maccarini PF, Salahi S, Oliveira TR, Pereira PJ, Limao-Vieira P, Snow BW, Reudink D, Stauffer PR. Design and optimization of an ultra wideband and compact microwave antenna for radiometric monitoring of brain temperature. IEEE Trans Biomed Eng. 2014;61:2154–60. doi: 10.1109/TBME.2014.2317484. [DOI] [PMC free article] [PubMed] [Google Scholar]
- 27.Stauffer PR, Snow BW, Rodrigues DB, Salahi S, Oliveira TR, Reudink D, Maccarini PF. Non-invasive measurement of brain temperature with microwave radiometry: demonstration in a head phantom and clinical case. Neuroradiol J. 2014;27:3–12. doi: 10.15274/NRJ-2014-10001. [DOI] [PMC free article] [PubMed] [Google Scholar]
- 28.Dubois L, Sozanski JP, Tessier V, Camart JC, Fabre JJ, Pribetich J, Chive M. Temperature control and thermal dosimetry by microwave radiometry in hyperthermia. IEEE Trans Microw Theory Tech. 1996;44:1755–61. [Google Scholar]
- 29.Hand JW, Van Leeuwen GMJ, Mizushina S, Van De Kamer JB, Maruyama K, Sugiura T, Azzopardi DV, Edwards AD. Monitoring of deep brain temperature in infants using multi-frequency microwave radiometry and thermal modelling. Phys Med Biol. 2001;46:1885–903. doi: 10.1088/0031-9155/46/7/311. [DOI] [PubMed] [Google Scholar]
- 30.Arunachalam K, Maccarini PF, De Luca V, Bardati F, Snow BW, Stauffer PR. Modeling the detectability of vesicoureteral reflux using microwave radiometry. Phys Med Biol. 2010;55:5417–35. doi: 10.1088/0031-9155/55/18/010. [DOI] [PMC free article] [PubMed] [Google Scholar]
- 31.Miklavčič D, Pavšelj N, Hart FX. Wiley Encyclopedia of Biomedical Engineering. New York: John Wiley & Sons, Inc.; 2006. Electric properties of tissues; pp. 1–12. [Google Scholar]
- 32.Hand JW. Modelling the interaction of electromagnetic fields (10 MHz-10 GHz) with the human body: methods and applications. Phys Med Biol. 2008;53:R243–86. doi: 10.1088/0031-9155/53/16/R01. [DOI] [PubMed] [Google Scholar]
- 33.Gabriel C, Gabriel S, Corthout E. The dielectric properties of biological tissues: I. Literature survey. Phys Med Biol. 1996;41:2231–49. doi: 10.1088/0031-9155/41/11/001. [DOI] [PubMed] [Google Scholar]
- 34.Casteilla L, Penicaud L, Cousin B, Calise D. Choosing an Adipose Tissue Depot for Sampling. Methods Mol Biol. 2008;456:23–38. doi: 10.1007/978-1-59745-245-8_2. [DOI] [PubMed] [Google Scholar]
- 35.Rasmussen JM, Entringer S, Nguyen A, van Erp TGM, Guijarro A, Oveisi F, Swanson JM, Piomelli D, Wadhwa PD, Buss C, Potkin SG. Brown Adipose Tissue Quantification in Human Neonates Using Water-Fat Separated MRI. Plos One. 2013;8:e77907. doi: 10.1371/journal.pone.0077907. [DOI] [PMC free article] [PubMed] [Google Scholar]
- 36.Gabriel S, Lau RW, Gabriel C. The dielectric properties of biological tissues: III. Parametric models for the dielectric spectrum of tissues. Phys Med Biol. 1996;41:2271–93. doi: 10.1088/0031-9155/41/11/003. [DOI] [PubMed] [Google Scholar]
- 37.Lazebnik M, Popovic D, McCartney L, Watkins CB, Lindstrom MJ, Harter J, Sewall S, Ogilvie T, Magliocco A, Breslin TM, Temple W, Mew D, Booske JH, Okoniewski M, Hagness SC. A large-scale study of the ultrawideband microwave dielectric properties of normal, benign and malignant breast tissues obtained from cancer surgeries. Phys Med Biol. 2007;52:6093–115. doi: 10.1088/0031-9155/52/20/002. [DOI] [PubMed] [Google Scholar]
- 38.Sasaki K, Wake K, Watanabe S. Development of best fit Cole-Cole parameters for measurement data from biological tissues and organs between 1 MHz and 20 GHz. Radio Sci. 2014;49:459–72. [Google Scholar]
- 39.Karacolak T, Hood A, Topsakal E. Design of a dual band implantable antenna and development of skin mimicking gels for continuous glucose monitoring. IEEE Trans Microw Theory Tech. 2008;56:1001–8. [Google Scholar]
- 40.Peyman A, Rezazadeh AA, Gabriel C. Changes in the dielectric properties of rat tissue as a function of age at microwave frequencies. Phys Med Biol. 2001;46:1617–29. doi: 10.1088/0031-9155/46/6/303. [DOI] [PubMed] [Google Scholar]
- 41.Smith SR, Foster KR. Dielectric-properties of low-water-content tissues. Phys Med Biol. 1985;30:965–73. doi: 10.1088/0031-9155/30/9/008. [DOI] [PubMed] [Google Scholar]
- 42.Reinoso RF, Telfer BA, Rowland M. Tissue water content in rats measured by desiccation. J Pharmacol Toxicol Methods. 1997;38:87–92. doi: 10.1016/s1056-8719(97)00053-1. [DOI] [PubMed] [Google Scholar]
- 43.Gabriel S, Lau RW, Gabriel C. The dielectric properties of biological tissues: II. Measurements in the frequency range 10 Hz to 20 GHz. Phys Med Biol. 1996;41:2251–69. doi: 10.1088/0031-9155/41/11/002. [DOI] [PubMed] [Google Scholar]
- 44.Gabriel C, Peyman A. Dielectric measurement: error analysis and assessment of uncertainty. Phys Med Biol. 2006;51:6033–46. doi: 10.1088/0031-9155/51/23/006. [DOI] [PubMed] [Google Scholar]
- 45.Paulides MM, Stauffer PR, Neufeld E, Maccarini PF, Kyriakou A, Canters RA, Diederich CJ, Bakker JF, Van Rhoon GC. Simulation techniques in hyperthermia treatment planning. Int J Hyperthermia. 2013;29:346–57. doi: 10.3109/02656736.2013.790092. [DOI] [PMC free article] [PubMed] [Google Scholar]
- 46.Salahi S, Maccarini PF, Rodrigues DB, Etienne W, Landon CD, Inman BA, Dewhirst MW, Stauffer PR. Miniature microwave applicator for murine bladder hyperthermia studies. Int J Hyperthermia. 2012;28:456–65. doi: 10.3109/02656736.2012.677931. [DOI] [PMC free article] [PubMed] [Google Scholar]
- 47.Orava J, Nuutila P, Lidell ME, Oikonen V, Noponen T, Viljanen T, Scheinin M, Taittonen M, Niemi T, Enerback S, Virtanen KA. Different Metabolic Responses of Human Brown Adipose Tissue to Activation by Cold and Insulin. Cell Metab. 2011;14:272–9. doi: 10.1016/j.cmet.2011.06.012. [DOI] [PubMed] [Google Scholar]
- 48.Smith DL, Jr, Yang Y, Hu HH, Zhai G, Nagy TR. Measurement of interscapular brown adipose tissue of mice in differentially housed temperatures by chemical-shift-encoded water-fat MRI. J Magn Reson Imaging. 2013;38:1425–33. doi: 10.1002/jmri.24138. [DOI] [PMC free article] [PubMed] [Google Scholar]
- 49.Romu T, Elander L, Leinhard OD, Lidell ME, Betz MJ, Persson A, Enerback S, Borga M. Characterization of brown adipose tissue by water-fat separated magnetic resonance imaging. J Magn Reson Imaging. 2015 doi: 10.1002/jmri.24931. In Press. [DOI] [PubMed] [Google Scholar]
- 50.Rossmanna C, Haemmerich D. Review of temperature dependence of thermal properties, dielectric properties, and perfusion of biological tissues at hyperthermic and ablation temperatures. Crit Rev Biomed Eng. 2014;42:467–92. doi: 10.1615/critrevbiomedeng.2015012486. [DOI] [PMC free article] [PubMed] [Google Scholar]