

Highlights
-
•
The waste hierarchy is not enough for prioritizing food waste prevention measures.
-
•
The methodology proposed prioritizes measures using LCA and mathematical programming.
-
•
The methodology identifies quick wins – actions with low cost and high impact avoided.
-
•
The relevance of the weighting set used in the prioritization is limited.
-
•
Targets for food waste prevention must be set at the level of environmental impact.
Keywords: Food waste, Waste prevention, Life cycle assessment, Sustainability, Mathematical programming, Optimization
Abstract
Food waste has gained prominence in the European political debate thanks to the recent Circular Economy package. Currently the waste hierarchy, introduced by the Waste Framework Directive, has been the rule followed to prioritize food waste prevention and management measures according to the environmental criteria. But when considering other criteria along with the environmental one, such as the economic, other tools are needed for the prioritization and optimization. This paper addresses the situation in which a decision-maker has to design a food waste prevention programme considering the limited economic resources in order to achieve the highest environmental impact prevention along the whole food life cycle. A methodology using Life Cycle Assessment and mathematical programing is proposed and its capabilities are shown through a case study. Results show that the order established in the waste hierarchy is generally followed. The proposed methodology revealed to be especially helpful in identifying “quick wins” – measures that should be always prioritized since they avoid a high environmental impact at a low cost. Besides, in order to aggregate the environmental scores related to a variety of impact categories, different weighting sets were proposed. In general, results show that the relevance of the weighting set in the prioritization of the measures appears to be limited. Finally, the correlation between reducing food waste generation and reducing environmental impact along the Food Supply Chain has been studied. Results highlight that when planning food waste prevention strategies, it is important to set the targets at the level of environmental impact instead of setting the targets at the level of avoided food waste generation (in mass).
Nomenclature
Sets
- A
set of impact categories indexed by a
- I
set of actions indexed by i
- J
set of food supply chains indexed by j
- K
set of stages of the food supply chain indexed by k
- T
set of time periods indexed by t
- Iprev (I)
sub-set of prevention actions indexed by iprev
- Ireu (I)
sub-set of reuse actions indexed by ireu
- Irere (I)
sub-set of recycle and recovery actions indexed by irere
- AFC
annual financial cost
- B
budget
- EI
environmental impact
- EIA
environmental impact avoided
- Inh
number of inhabitants in the geographical area considered
- N
normalisation factor
- Q
quantity
- r
discount rate
- t
time period
- TEI
total environmental impact
- TEIA
total environmental impact avoided
- TFC
total annual financial cost
- TQ
total quantity
- w
weighting set
- x
binary variable
- α
unavoidable fraction of food waste
1. Introduction
According to the Food and Agriculture Organization of the United Nations (FAO), up to one third of all food is lost or wasted worldwide throughout the supply chain. This corresponds to about 1.3 billion tonnes per year and represents a waste of resources, water, energy, land, and other inputs used for producing that food, including labour (FAO, 2011). For Europe, Brautigam et al. (2014) reported that the quantity spoiled is around 143 million tonnes per year (data for 2006). Those estimates are highly uncertain, as shown – among others – in Cristobal et al. (2016), mostly due to: different methods for quantifying food waste exist, different databases for the calculation are used (e.g. FAOSTAT and EUROSTAT), and a lack of harmonization in the nomenclature (Corrado et al., 2017).
Thanks to the recent Circular Economy (CE) package (EC, 2015a), food waste prevention has gained prominence in the European political debate. In fact, the CE Action Plan (EC, 2015b) included food waste within the so-called “priority areas”, i.e. areas that should be carefully considered to strengthen the circularity of the European economy. Previously, other EC’s policy documents explicitly stressed on the importance of waste prevention to achieve sustainable use of resources, such as the “Community Strategy for Waste Management” (EC, 1989) and the “Thematic Strategy on the prevention and recycling of waste” (EC, 2005). But, it was with the Waste Framework Directive (WFD) (EC, 2008) that the first mandatory provisions concerning waste prevention were established. In fact, the WFD presented the key legally binding principle upon which European waste management is based: the so-called “waste hierarchy”. The waste hierarchy establishes a priority order for waste management intended to ensure that the most environmentally sound waste management options are chosen. According to such hierarchy, waste prevention is the preferred option, while landfilling of waste is the least desirable option. Also, the WFD requires European Member States to prepare so-called “waste management plans” that should show how MS are going to implement the objectives and provisions made by the WFD and, in particular, the implementation of the waste hierarchy. In addition, further stressing on the strategic importance of waste prevention, according to the WFD, MS are required to develop “waste prevention programmes”, which shall clearly identify waste prevention measures and targets. To support MS in the development of their waste prevention programmes, the Commission prepared general guidelines (EC, 2012a), as well as guidelines specifically focused on food waste (EC, 2011).
As stated by Van Ewijk and Stegemann (2016), the priority order in the waste hierarchy mainly relates to the ability of each option to achieve diversion from landfill but also equates with the least environmental impact. Towards ensuring that the most environmentally sound options can always be identified, the WFD allows to deviate from the hierarchy for specific waste streams, if this is justified by life cycle thinking on the overall environmental impacts of the different waste management options. In fact, many examples of application of Life Cycle Thinking (LCT) and Life Cycle Assessment (LCA) to waste management exist in literature (Laurent et al., 2014a, Laurent et al., 2014b) that show that in certain cases (Finnveden et al., 2005, Eriksson et al., 2015), or for certain materials such as food waste (DEFRA, 2011a), the priority order indicated by the hierarchy may not hold true e.g., anaerobic digestion (i.e. recovery) can be better (for the environment) than composting (i.e. recycle). As concluded by Laurent et al. (2014a), due to the strong dependence of each waste on its context and local specificities, the waste hierarchy should be used with caution as it can be misleading and overshadow the support that LCA brings in the management of solid waste. Furthermore, as shown by Gharfalkar et al., (2015) there are a number of conceptual gaps and disparities in literature (WRAP, 2011, DEFRA, 2011b, EC, 2012b) in the understanding of the waste hierarchy and the definitions of different measures in the WFD, making the classification of some measures within the hierarchy not clear.
Mourad (2016) shown that there exists a competition among three management options of the waste hierarchy (i.e. prevention, reuse and recycle-recovery). This competition entails environmental, social and economic interests. In this line, Gharfalkar et al. (2015) concluded that the waste hierarchy acts as a priority guideline, but for the final decision of implementing different prevention and management measures LCA-based methodologies may be required to ascertain the option that delivers the best overall environmental, human health, economic and social impact. Certainly, the inclusion of the other two pillars of sustainability (i.e. economic and social) exerts a strong influence on the decision making process.
A literature review revealed that there is a knowledge gap concerning evaluation methodologies and reliable results of implementing food waste prevention measures, as stated by Schneider (2013). Gentil et al. (2011), using a LCA methodology, evaluated the environmental consequences of food waste prevention on waste management systems and on the wider society. Hamilton et al. (2015) used a multi-layer systems framework for comparing quantitatively food waste recycling and prevention strategies in Norway. But till now, up to the knowledge of the authors, there is limited knowledge on the evaluation of food waste prevention and management strategies including both economic and environmental dimensions. Towards filling such gap, the main aim of this paper is to propose a novel methodology based on LCA and mathematical programming for planning food waste prevention and management measures, taking into account environmental and economic indicators. This paper addresses the situation in which a decision-maker has to design a food waste prevention programme considering the limited economic resources in order to achieve the highest environmental impact prevention along the whole food life cycle. For the time being, the social dimension has been excluded from this analysis due to lack of indicators and reliable data. It will serve as a tool for decision makers to identify the optimal combination of food waste prevention and management measures to be prioritized in order to maximize the environmental impact benefit along the whole Food Supply Chain (FSC) within a defined budget. This methodology will be developed through an integer linear programming (ILP) model. The environmental impact benefit will be measured through an indicator that aggregates 15 different impact categories by means of normalisation and weighting. This paper also presents a case study which results will be analyzed and compared with the provisions made by the waste hierarchy discussing the possible misalignments (e.g. recovery options are prioritized over recycling or reuse options). In addition, six different weighing sets will be used and their results discussed.
This paper is organized as follows. Section 2 provides the methodological approach that includes: the quantification of food waste prevented by a given measure (Section 2.1); the calculation of the environmental impact(s) prevented by each measure depending if they are prevention, re-use or recycle-recovery measures (Section 2.2); the calculation of the economic indicator for each measure (Section 2.3); the problem statement and the mathematical formulation of the model (Section 2.4). Section 3 presents the case study. Section 4 analyzes and discusses the results. Finally, Section 5 presents the conclusions drawn from the study.
2. Methodological approach
The methodological approach developed to assess and prioritize different options for food waste prevention and management considering both environmental and economic criteria includes three main steps: (i) the quantification of food waste prevented (on a mass base), intended as diverted from landfill, thanks to the implementation of the considered prevention and management measures, (ii) the calculation of the environmental impact(s) avoided by the measures, and (iii) the calculation of the economics of the implementation of such measures. The system boundaries of the study consider the entire food system of a given region (see Fig. 1) consisting of different food supply chains (FSCs) j, including all the supply chain stages k in the food life cycle i.e. from the agricultural stage to the retail, the consumption of food and its end of life (i.e. collection and management), which as default is assumed to be landfilling.
Fig. 1.

Definition of different food supply chains and stages where prevention measure (represented by the blue star) may apply.
2.1. Quantification of food waste avoided by the measures
The first step is the quantification of the food waste avoided by each measure i. This is not a simple task since European legislation does not provide a binding definition of food waste. A clear differentiation among unavoidable/inedible food waste, by-products and avoidable/edible food waste is key to improve the quantification and the databases used in the food waste prevention studies (Priefer et al., 2016, Corrado et al., 2017).
In this methodology, the quantity of food waste avoided is calculated starting from the quantity of food waste generated in a stage k of a FSC j () by a specific stakeholder or target group, e.g. residential food waste. This quantity of food waste, if no measure is applied, is assumed to be sent to landfilling. From that quantity, the maximum quantity of food waste that could be potentially avoided when measure i is put in place in the stage k = p () is identified. For instance, we can say that 100 tonnes of food waste are generated each year at the consumption stage by households and that 90% of this amount could be potentially reduced through consumer education campaigns, to educate people to avoid waste (10% is unavoidable waste consisting in inedible food). However, the amount of food waste that is actually avoided could be lower than the potential quantity, for several reasons (e.g. ineffectiveness of the campaign, low reaction by consumers, etc.). Therefore, the real amount avoided when measure i is put into place in the stage k = p of the FSC j shall be quantified .
These three quantities are always expressed as tonnes or tonnes ∗ year−1 of food waste. Note that and only occur in a certain stage of the FSC k = p. Sometimes, literature or specific surveys provide the relative quantities (q) expressed in kg per capita. The total quantity (Q) can be calculated as shown in Eq. (1).
| (1) |
where Inh is the number of inhabitants in the geographical area considered.
To estimate the final amount of food waste potentially or actually prevented from the generated one, two factors are taken into consideration:
-
(1)
The scope factor (S)
The absolute quantity potentially or actually prevented depends on the extent of the target of the action compared to the size of the system, which for example, for actions targeting citizens, is the total population of the area. The scope (S) defines the target group as a percentage of the total target.
To define S, it is necessary to consider what resources are available (for example in terms of budget, personnel and organization, etc.).
-
(2)
The participation factor (P)
The participation factor (P) is the rate that defines the users in the target group who effectively participate to the action. To estimate P, different approaches could be followed such as conducting surveys (e.g. about the possibility of changing small habits such as change of diet, accepting a change in the size of menus, etc.) or using references about the participation reached with the same activities carried out in other regions.
Normally, the total quantity potentially and actually prevented are calculated as follows (Eqs. (2), (3), respectively), although in certain cases those factors (P and S) are not so well differentiated:
| (2) |
| (3) |
2.2. Calculation of the environmental impact avoided
The environmental indicator chosen for the calculations is the total environmental impact avoided (TEIA). This aggregates into a single score the 15 different impact categories recommended as ILCD (International Reference Life Cycle Data System) method (v. 1.08) by the European Commission (EC, 2013, EC-JRC, 2011). In order to get a single score, normalisation and weighting steps shall be used as explained in subsection 2.2.4. But before that, the environmental impact avoided () by each measure i in each impact category a shall be calculated differently depending on the step of the waste hierarchy to which they belong: prevention (iprev) (Section 2.2.1), reuse (ireu) (Section 2.2.2) or recycle-recovery (irere) (Section 2.2.3).
2.2.1. Prevention measures
In order to calculate the environmental impact avoided by a certain prevention measure (), it is assumed that the quantity of food waste prevented by measure i in the FSC j at a certain stage k () would have never been produced, and so an equivalent amount of food for human consumption does not enter the food system. Thus, it can be assumed that the impact avoided by the measure is equal to the sum of the impact of producing the avoided amount of food (that will no longer have to be produced) and the impact of disposing the quantity of food waste prevented (end of life phase (EoL) that will no longer take place). Therefore, the environmental impact prevented is calculated following the approach presented in FAO (2013) and shown in Fig. 2.
Fig. 2.

Framework for calculating the environmental impact avoided by a prevention measure.
The following equations summarize the complexity of the problem (schematically represented in Fig. 2). Eq. (4) allows calculating the impact avoided in every environmental impact category a arising from every individual measure i assuming that prevention actions themselves do not introduce additional impacts (as a direct or rebound effect – i.e. the avoidance of food waste leads to increased effective income which results in expenditure on alternative products and services that may present a higher environmental impact influencing the overall environmental impact). Salemdeeb et al. (2017a) presented an econometric-based marginal expenditure model to calculate the rebound effect of prevention measures. In case prevention measures have a non-negligible environmental impact, Eq. (5) is used.
| (4) |
| (5) |
where
is the environmental impact avoided by measure i in the impact category a. It is measured in the unit of the environmental impact.
is the environmental impact in the FSC stage k of the FSC j in the impact category a. It is measured in the unit of the environmental impact per tonne of food. It is particularly important to have robust knowledge of the methodology used for the calculation of , i.e. system boundaries of the study, which elementary flows have been taken into account, which functional unit has been used, etc. (Notarnicola et al., 2017).
is the quantity of food waste prevented by the action i in the FSC stage k = p of the FSC j. It is measured in tonnes (See Section 2.1).
k = 1 is the first stage of the FSC and k = p is the FSC stage in which action i takes place. k = EoL is the End of Life FSC stage (i.e. landfilling).
is the environmental impact in the impact category a of implementing measure i. It is measured in the unit of the environmental impact.
2.2.2. Reuse measures
For reuse measures, intended as the reuse of surplus food for human consumption through redistribution networks, food banks and donations, the impact avoided () is calculated as shown in Fig. 3. One of the main challenges of food reuse is that food donations are not necessarily adapted to the needs of hunger-relief organizations and their “clients” especially in terms of nutrition (Mourad, 2016). That is why it is assumed that the quantity of food waste prevented by action i in the FSC j at a certain stage k () will not substitute any product at the consumption level. Thus, the impact avoided by the measure will be considered equal to sum of the impacts of the stages avoided between the one in which the food waste has been produced and the consumption stage, plus the impacts of disposing the avoidable fraction of the food product and minus the additional impact from the transportation stage.
Fig. 3.

Framework for calculating the environmental impact avoided by a reuse measure.
Eq. (6) allows calculating the prevented environmental impact in every environmental impact category a arising from each individual reuse measure i assuming that the only additional impact generated by the measure put in place comes from the additional transport needed for the distribution of food to charities.
| (6) |
where
is the unavoidable fraction in the food supply chain j.
2.2.3. Recycling and recovery measures
Recycling and recovery appear in the waste hierarchy as different steps but for the calculation of the environmental impact avoided () the framework and the equations are the same (Fig. 4). This type of measures substitutes the landfilling at end of life (EoL) with an alternative end of life (AEoL) management option. Thus, the impact avoided by the measure will be considered equal to the impact of the avoided EoL stage (i.e. landfill) minus the impacts of the alternative EoL. The EoL and AEoL stages include the collection of the food waste and accounts for the benefits coming from the avoided production of products substituted (e.g. when food waste is recycled as feed for animals, the production of compound feed is avoided and in this case the benefits are credited to the system).
Fig. 4.

Framework for calculating the environmental impact avoided by a recycling or recovery measure.
Eq. (8) allows calculating the avoided impact in every environmental impact category a arising from every individual measure i. Recycling or recovery measures refer to an alternative waste management option and additional impacts are already accounted within the measure.
| (8) |
2.2.4. Normalisation and weighting
Normalisation and weighting are optional steps in LCA (ISO, 2006). However, when the LCA practitioner intends to aggregate the environmental scores of different impact categories into a single score value, normalisation and weighting become mandatory steps. To calculate the total environmental impact avoided (TEIA), Eq. (9) must be applied. The normalisation step will relate the magnitude of the impact category indicator results in relation to a reference system (i.e. by dividing the impact in each category () by the estimated impacts form a reference region in a reference year (Na)) and the weighting step will adjust the relative significance of each impact category based upon user-defined criteria so they can be aggregated (i.e. by multiplying each normalized impact by a percentage point (wa)).
| (9) |
where
wa is the weight of impact category a (in%)
Na is the normalisation reference for impact category a (measured in the units of the impact category)
Different normalisation and weighting sets of factors appear in literature. In this paper (see Table 1), for the normalisation references those proposed by the European Commission-Joint Research for Europe (Sala et al., 2015) has been selected. The normalisation factors applied here are European only. For the weighing factors, different options have been tested in the case study and their results discussed, namely: the distance-to-target (DTT) weighting sets (both binding and non-binding policy-based targets for 2020) developed by Castellani et al. (2016), the DTT based on the planetary boundary approach developed by Tuomisto et al. (2012), the DTT based on the Earth’s carrying capacity concept developed by Bjørn and Hauschild (2015), the panel-based weighting sets developed by Huppes and van Oers, 2011 and, finally, a set that assumes equal weighting among impact categories.
Table 1.
Normalization and weighting factor sets.
| Impact category | Acronym | Units | Normalization (Na) | Weighting sets (wa) |
|||||
|---|---|---|---|---|---|---|---|---|---|
| W1 Castellani et al., 2016 – Binding | W2 Castellani et al., 2016 – Non binding | W3 Tuomisto et al., 2012 | W4 Bjørn and Hauschild 2015 | W5 Huppes and van Oers, 2011 | W6 Equal weighting | ||||
| Climate change | CC | kg CO2 eq. | 4.60 × 10¹² | 7.1 | 5.4 | 10.4 | 24.7 | 23.2 | 6.6 |
| Ozone depletion | OD | kg CFC-11 eq. | 1.08 × 10⁷ | 6.4 | 4.8 | 8.1 | 0.7 | 3.6 | 6.6 |
| Human toxicity, non-cancer effects | HT,nce | CTUh | 2.66 × 10⁵ | 6.2 | 4.7 | 0 | 0 | 4.1 | 6.6 |
| Human toxicity, cancer effects | HT,ce | CTUh | 1.84 × 10⁴ | 6.9 | 5.2 | 0 | 0 | 6.5 | 6.6 |
| Particulate matter | PM | kg PM2.5 eq. | 1.9 × 10⁹ | 7.4 | 5.6 | 0 | 0 | 6.6 | 6.6 |
| Ionizing radiation, human health | IR,hh | kBq U235 eq. (to air) | 5.64 × 10¹¹ | 6.1 | 4.6 | 0 | 0 | 6.5 | 6.6 |
| Photochemical ozone formation | POF | kg NMVOC eq. | 1.58 × 10¹⁰ | 7.8 | 5.9 | 0 | 34.1 | 5.4 | 6.6 |
| Acidification | A | mol H+eq. | 2.36 × 10¹⁰ | 7.2 | 5.5 | 8.4 | 1.4 | 4.2 | 6.6 |
| Eutrophication terrestrial | TE | mol N eq. | 8.76 × 10¹⁰ | 7 | 5.3 | 27.6 | 0.8 | 2.3 | 6.6 |
| Eutrophication freshwater | FE | kg P eq. | 7.41 × 10⁸ | 6.2 | 4.7 | 6.5 | 8.5 | 2.3 | 6.6 |
| Eutrophication marine | ME | kg N eq. | 8.44 × 10⁹ | 6.9 | 5.2 | 27.6 | 1.5 | 2.3 | 6.6 |
| Ecotoxicity freshwater | Fecotox | CTUe | 4.36 × 10¹² | 6.1 | 5.3 | 0 | 2.2 | 10.9 | 6.6 |
| Land use | LU | kg C deficit | 3.74 × 10¹³ | 6.4 | 5.1 | 6.2 | 24.7 | 10.2 | 6.6 |
| Resource depletion water | WRD | m3 water eq. | 4.06 × 10¹⁰ | 6.1 | 29.6 | 5.2 | 1.4 | 5.1 | 6.6 |
| Resource depletion, mineral, fossils | MFRD | kg Sb eq. | 5.03 × 10⁷ | 6.1 | 3 | 0 | 0 | 6.9 | 6.6 |
2.3. Calculation of the economic indicator
For quantifying the economic impact of food waste prevention measures several economic indicators can be used such as the financial cost, the economic value, or the financial benefit (ReFED, 2016). Normally, decision makers have a certain budget (B) available to address waste prevention and within this budget it is impossible to implement all possible measures. That is why, the economic indicator used in this paper is the financial cost associated with each solution, which includes the initial investment capital, ongoing implementation and operating costs, and other general expenses. A realistic timeline must be selected for considering the depreciation of the equipment that may be included in the modelled solution. Initial investment expenses are modelled to fully impact the first year financials, while recurring operating expenses (variable and/or fixed) are modelled over the selected time period. For the calculation of the annualized net present value (NPV) of each solution, a discount rate (r) representing the social cost of capital must be selected.
For the calculation of the annual financial cost of each measure (AFCi) Eq. (10) is used. The total annual financial cost (TFC) is calculated with Eq. (11).
| (10) |
| (11) |
where
ACt,i is the annual cost flow in every period t for each measure i measured in the used currency.
t is the time period considered
r is the discount rate
2.4. Problem statement and mathematical formulation of the model
As stated in the scope of this study, the paper addresses the situation in which a decision-maker has to design a food waste prevention programme considering the limited economic resources in order to achieve the highest environmental impact prevention along the whole food life cycle. The following list includes the most important parameters and factors that should be known or should be identified in order to apply the proposed methodology:
-
•
a set of prevention and management measures,
-
•
a set of FSC or food commodities (divided in a set of FSC stages),
-
•
a set of environmental impact categories,
-
•
the annual quantity of food waste generated in the FSC stage k of the FSC j () and the environmental impact of each FSC stage k of the FSC j in each impact category a (),
-
•
the annual quantity of food waste prevented by measure i in the FSC stage k = p of the FSC j (),
-
•
a set of normalisation and weighting factors for the impact categories,
-
•
the annual cost of each measure i (),
-
•
the annual budget (B).
Thus, the main outcome is the optimal pool of measures that maximizes the total environmental impact avoided without exceeding the budget. This paper proposes an integer linear programming (ILP) model (MODEL1):
| (MODEL1) |
is the Total Environmental Impact Avoided calculated with Eq. (9), which detailed formulation is shown in Eq. (12):
| (12) |
where is a binary variable that takes the value of 1 in case the prevention measure is implemented and 0 otherwise.
2.4.1. Solution method
The model shown previously (MODEL1) is considered a multi-objective optimization ILP (MOILP) being the objective functions the economic (TFC, Eq. (11)) and the environmental (TEIA, Eq. (9)). The MOILP model was implemented in the modeling system GAMS 24.7.1 and solved using CPLEX. The problem is solved using the epsilon constraint method in which one objective remains as the objective function (i.e. the environmental impact prevented to be maximized) and the other one (i.e. the total cost) is constrained to be less than or equal to given target values that in this case correspond to different budgets (B). In this way a Pareto front can be obtained for the pair of objectives environmental and economic. The shape of the Pareto front indicates the nature of the trade-off between the different objective functions. However, there are some limitations on the capability of this solving method to construct the entire Pareto front. Since integrality constraints arise, one of the main limits of this technique is the inability of obtaining some Pareto optima, appearing supported and unsupported Pareto optima (see Fig. 5) (Caramia and Dell’Olmo, 2008).
Fig. 5.
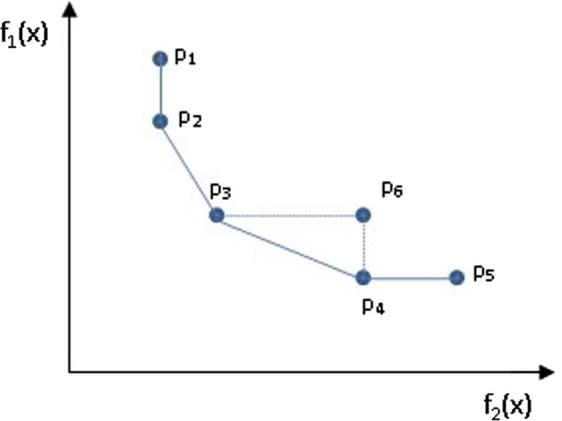
Example of Pareto front with supported and unsupported Pareto optima, being p2, p3 and p4 supported strict Pareto optima, p1 and p5 are supported weak Pareto optima, while p6 is unsupported Pareto optima.
3. Case study
In order to show the capabilities of the methodology presented in Section 2, a case study is proposed which makes use of data from ReFED1 (for data concerning real prevention measures) and the Basket-of-Products (BoP) within the LC-IND project2 (for the environmental impact of the different food goods). One of the main shortcomings is that both databases have different geographical scope. On the one hand, ReFED reports real data of prevention measures within a national economic study and action plan which scope is to create a roadmap to reduce food waste in the United States. On the other hand, BoP data refers to the environmental impacts along different food products life cycle associated to EU consumption, assessing 15 environmental impact categories (as recommended by the ILCD impact assessment method (EC-JRC, 2011)). To overcome this, it is assumed that the FSCs of the selected food products are similar all over the world, so the BoP data without considering the consumption pattern component of the indicator (i.e. total quantity of each product consumed in Europe) have been used for the United States.
Data about the performance of actual prevention measures applied to food waste is very scarce in literature. ReFED has shortlisted and analyzed in detail 27 solutions gathered from stakeholders that met criteria around data availability, cost-effectiveness, feasibility, and scalability. For that reason, ReFED will serve, in this case study as a validated source of data concerning the quantity of food waste generated, the quantity of food waste prevented by each measure and the annual financial cost of each of them.
Table 2 shows the quantity of food waste generated along the 5 different FSC proposed by ReFED (i.e. grain, meat, produce (fruit and vegetables), milk/dairy and seafood) in each of the FSC stages. Since seafood (j = 5) is only the 2% of the food waste generated and there is no data of the environmental impacts along the FSC, it has been excluded from the analysis.
Table 2.
Quantity of food waste generated in each FSC stage as reported by ReFED measured in ktonnes per year.
| FSC chain |
||||||
|---|---|---|---|---|---|---|
| j = 1 Grain | j = 2 Meat | j = 3 Produce | j = 4 Milk/dairy | j = 5 Seafood | ||
| FSC stage | k = 1 Agriculture/breeding | 0 | 0 | 10100 | 0 | 0 |
| k = 2 Industrial processing | 361 | 110 | 280 | 19 | 284 | |
| k = 3 Logistics | 1785 | 566 | 3220 | 2303 | 96 | |
| k = 4 Consumption | 6945 | 6815 | 18796 | 9940 | 912 | |
| k = 5 EoL – landfilling | 0 | 0 | 0 | 0 | 0 | |
| k = 6 Additional transport | 0 | 0 | 0 | 0 | 0 | |
| k = 7–9 Alternative EoL | 0 | 0 | 0 | 0 | 0 | |
In order to make the database of the BoP Food coherent to the one by ReFED, two main adjustments were needed. Firstly, the FSC has been divided in 9 different stages as shown in Fig. 6 (which includes a brief explanation of the processes included in each of them).
Fig. 6.

Food Supply Chain stages with an explanation of the processes included in each of them.
Secondly, the representative products included in the BoP Food (EC-JRC, 2017, Notarnicola et al., 2017) has been grouped into the product categories analyzed by ReFED (Grain, Meat, Milk/Dairy and Produce). Since there is no exact correspondence between the products included in the BoP Food and the FSC analyzed by ReFED, only 11 representative products, out of the 17 included in the BoP model, are considered for the present study (namely bread, pasta, beef meat, pork meat, poultry meat, apples, oranges, potatoes, milk, cheese and butter). The representative 11 products are grouped into the 4 selected FSCs, according to their relative quantities (based on the quantity consumed in one year by an average EU citizen) (Table 3). For instance, the three types of meat products included in the BoP Food (beef, pork and poultry meat) are combined to compose a single representative product for the FSC Meat (j = 2). Therefore, for each kg of meat food waste avoided, the avoided environmental impact is calculated as the sum of the avoided impacts of 0.18 kg of beef meat, 0.53 kg of pork meat and 0.29 kg of poultry meat.
Table 3.
Composition of FSC used in the study (relative contribution of each BoP products – e.g. bread and pasta contributed to the composition of 1 kg of product Grain used in the study).
| j = 1 Grain | j = 2 Meat | j = 3 Produce | j = 4 Milk/Dairy | |
|---|---|---|---|---|
| Bread | 0.83 | 0 | 0 | 0 |
| Pasta | 0.17 | 0 | 0 | 0 |
| Beef meat | 0 | 0.18 | 0 | 0 |
| Pork meat | 0 | 0.53 | 0 | 0 |
| Poultry meat | 0 | 0.29 | 0 | 0 |
| Apple | 0 | 0 | 0.16 | 0 |
| Orange | 0 | 0 | 0.17 | 0 |
| Potato | 0 | 0 | 0.67 | 0 |
| Milk | 0 | 0 | 0 | 0.81 |
| Cheese | 0 | 0 | 0 | 0.15 |
| Butter | 0 | 0 | 0 | 0.04 |
From the 27 shortlisted measures by ReFED, the 22 selected for this study are shown in Table 4 (further description and information of each of them are reported in ReFED (2016)). The terminology used in this paper is slightly different from the referenced document and actions herein have been divided in prevention (iprev), reuse (ireu) and recycle-recovery (irere). In the Appendix A, Table A1 shows the occurring FSC stage for each measure, the quantity of food waste prevented by each measure in ktonnes per year as well as the annual financial cost (AFC) measured in M$ per year.
Table 4.
Definition of the prevention and management measures selected for the case study.
| Sub-set | Measure (i) | Definition |
|---|---|---|
| Prevention (iprev) | i1 – Consumer education campaigns | Conducting large-scale consumer advocacy campaigns to raise awareness of food waste and educate consumers about ways to save money and reduce wasted food |
| i2 – Waste tracking and analytics | Providing restaurants and prepared-food providers with data on wasteful practices to inform behavior and operational changes | |
| i3 – Standardized data labelling | Standardizing food label dates and instructions, including eliminating “sell by” dates, to reduce consumer confusion | |
| i4 – Produce specifications | Accepting and integrating the sale of off-grade produce (short shelf life, different size/shape/color), also known as “ugly” produce, for use in foodservice and restaurant preparation and for retail sale | |
| i5 – Packaging adjustments | Optimizing food packaging size and design to ensure complete consumption by consumers and avoid residual container waste | |
| i6 – Smaller plates | Providing consumers with smaller plates in self-serve all-you-can-eat dining settings to reduce portion sizes | |
| i7 – Trayless dining | Eliminating tray dining in all-you-can-eat establishments to reduce consumer portion sizes | |
| i8 – Spoilage prevention packaging | Using active intelligent packaging, such as ethylene absorbing packaging inserts, to prolong product freshness and slow down spoilage of perishable fruits and meat | |
| i9 – Improved inventory management | Improvements in the ability of retail inventory management systems to track an average product’s remaining shelf-life (time left to sell an item) and inform efforts to reduce days on hand (how long an item has gone unsold) | |
| i10 – Cold chain management | Reducing product loss during shipment to retail distribution centers by using direct shipments and cold chain certified carriers | |
| i11 – Secondary resellers | Businesses that purchase processed foods and produce directly from manufacturers and distributors for discounted retail sale to consumers | |
| i12 – Manufacturing line optimization | Identifying opportunities to reduce food waste from manufacturing/processing operations and product line changeovers | |
| Reuse (ireu) | i13 – Donation tax incentives | Expanding federal tax benefits for food donations to all corporations and improving ease of donation reporting processes for tax deductions |
| i14 – Standardized donation regulation | Standardizing local and state health department regulations for safe handling and donation of food through federal policy | |
| i15 – Donation matching software | Using technology platform to connect individual food donors with recipient organizations and reach smaller scale food donations | |
| i16 – Donation transportation | Providing small-scale transportation infrastructure for local recovery as well as long-haul transport capabilities | |
| i17 – Donation storage and handling | Expanding temperature-controlled food distribution infrastructure (e.g. refrigeration, warehouses) and labor availability to handle (e.g. process, package) additional donation volumes | |
| i18 – Value-added processing | Extending the usable life of donated foods through processing methods such as making soups, sauces, or other value-added products | |
| i19 – Donation liability education | Educating potential food donors on donation liability laws | |
| Recycling-recovery (irere) | i20 – Centralized composting | Transporting waste to a centralized facility where it decomposes into compost |
| i21 – Centralized anaerobic digestion | A series of biological processes in which microorganisms break down biodegradable material in the absence of oxygen resulting in two end products: biogas and digestate. | |
| i22 – Animal feed | Feeding food waste to animals after it is heat-treated and dehydrated and either mixed with dry feed or directly fed | |
For the calculation of the AFC of each measure, a discount rate (r) of 4% and a period (t) of 10 years is considered. Table 5 shows the unavoidable fraction of each food product j (αj) which is needed in the calculation of the environmental impact avoided in the reuse measures.
Table 5.
Fraction of unavoidable waste assumed for each of the FSCs analyzed (FAO, 2011).
| j = 1 grain | j = 2 meat | j = 3 produce | j = 4 milk/dairy | |
|---|---|---|---|---|
| αj (%) | 0 | 1 | 12.9 | 0 |
For the environmental impact, data from the BoP Food is used. In the case of prevention measures, the impact avoided thanks to the amount of avoided food waste is calculated as equal of the environmental impact caused by the production of the same quantity (and type) of food. This is calculated by using the Life Cycle Inventory (LCI) model of the products in the BoP Food, assessed with the abovementioned Life Cycle Impact Assessment (LCIA) method ILCD 1.08 (EC-JRC, 2011). The results of the assessment of one kg of product, for each impact category a () are then multiplied by the amount of food waste prevented, as explained in Eq. (4). Due to lack of data, neither additional direct impact coming from the implementation of the prevention measure, nor rebound effect have been included in this case study.
In the case of reuse measures, i.e. donations, the avoided impact is calculated only for the stages of the FSC that are avoided (e.g. retail, if the donation happens at the production stage). On the other hand, an additional impact coming from the transport of food from the point of donation to the point of consumption is included in the calculation. The transport distance is assumed to be 20 km (based on Eriksson et al., 2015), and to be covered by a light commercial vehicle. The end of life stage is assumed to be the same as in the baseline scenario (i.e. landfilling), because the reuse measures will not avoid the disposal of the unavoidable fraction of food waste () after consumption.
In the case of recycling and recovery measures, the impact avoided is the impact of landfilling at the EoL minus the impact of the alternative end of life (AEoL) measure, as in Eq. (8). For the EoL and all AEoL, the impact of the treatment (e.g. due to energy consumption and direct emissions to air) is calculated, including the stages of collection and transport to the treatment facility. In addition, the benefits coming from the avoided production of alternative products that can be substituted thanks to the recycling of food waste is subtracted as well (see Table 6 for details). The options considered as alternative to the base case (i.e. landfilling) are: composting, anaerobic digestion, and the use of food waste as feed. This latter is assumed to be a direct use in all cases (i.e. grain, produce and milk) except in the case of meat waste, because of sanitary reasons. In the case of meat waste, the production of dry feed, obtained through hot treatment and then dehydration of food waste, is assumed and modelled as in Salemdeeb et al. (2017b). For all the AEoL options, the transport of the food waste is modelled with the same features of the transport to landfill in the base case (i.e. 50 km transport, done by a 21-metric-tonnes lorry).
Table 6.
Substituted products assumed for each of the AEoL considered.
| AEoL | Substituted product | Reference |
|---|---|---|
| Composting | Nitrogen fertilizer, as N (0.0025 kg per kg of waste treated) | Ecoinvent 3.2 (ecoinvent report No. 15, Nemecek and Kagi, 2007) |
| Anaerobic digestion | Natural gas (Methane coming from produced biogas (54% of biogas volume) | Ecoinvent 3.2 (ecoinvent report No. 17, Jungbluth et al., 2017) |
| Direct use as feed | Compound feed beef cattle (1 t/t food waste) | Salemdeeb et al. (2017b) |
| Dry feed production | Compound feed beef cattle (0.125 kg/t food waste) | Salemdeeb et al. (2017b) |
The complete results of for all FSC stages k (including the different AEoL) for each product j in the 15 impact categories a are reported in the Appendix A (Tables A2-A5).
4. Results and discussion
The results obtained for the case study are shown and discussed below. After solving the MOILP for each weighting set (W), a Pareto front can be obtained for the pair of objectives environmental (TEIA) and economic (B) (Fig. 7). In order to represent all Pareto fronts in the same graph, the ratio between the TEIA and the total environmental impact generated for each weighting set (TEIgen - Eq. (13)) is calculated (% TEIA) and represented in Fig. 7.
| (13) |
Fig. 7.

Pareto fronts obtained for the pair of objectives environmental (TEIA – Total Environmental Impact Avoided) and economic (B - Budget).
Each point in the Pareto fronts corresponds to a different combination of measures that for each budget (B) maximizes the total environmental impact avoided. These pools of actions are shown in Fig. 8 where “1” denotes that the measure has been implemented, while “0” otherwise.
Fig. 8.

Set of action implemented in each of the Pareto front solutions for each weighting set W.
All Pareto fronts in Fig. 7 are similar in shape and their analysis can be conducted in three parts. First of all, around 80% of the TEIA is achieved within the first step of budgeting (i.e. the lowest budget). Having a look at Fig. 8, one can see that the actions implemented are: several prevention measures (i1 – Consumer education campaigns, i2 – Waste tracking and analytics, i3 – Standardized data labelling, i6 – Smaller plates, i7 – Trayless dining, i9 – Improved inventory management, i10 – Cold chain management, i12 – Manufacturing line optimization); one reuse measure (i14 – Standardized donation regulation); and one recycling measure (i22 – Animal feed). It is important to highlight that these measures will always be prioritized for all steps in the budgeting.
Secondly, around 10% of the TEIA is achieved within the second and third step of the budgeting and, as shown in Fig.8, this corresponds with the implementation of three prevention measures: i5 – Packaging adjustments; i8 – Spoilage prevention packaging (that will remain always as prioritized for further budget steps); and. i4 – Produce specifications (that in almost all cases will remain as prioritized with the exception of certain weighting sets).
Finally, the remaining 10% of the TEIA is achieved within the rest of the steps of the budgeting. The measures will be prioritized competing at two levels: on the one hand depending on the constrained budget (e.g. when the budget increases from 948.8 M$ to 1186 M$ measure i20 is prioritized at the expense of i16, i17, i18 and i19) and on the other hand depending on the weighting set that is applied, (e.g. when the budget is 1897.6 M$ W1, W3 and W6 prioritize i11 and i15 while W2, W4 and W5 prioritize i4, i13, i16 and i20).
Some general trends and key findings that can be derived from these results include:
-
•
As mentioned before, there is a list of measures that are always prioritized (i.e. i1, i2, i3, i6, i7, i9, i10, i12, i14 and i22). These actions are considered “quick wins” since they avoid a high environmental impact at a low cost and they should be the first measures to be considered in the planning.
-
•
i5 and i8, despite their higher price, should be also taken into account right after the “quick wins”.
-
•
i11 – Secondary resellers - is by far the most expensive measure but yet it is prioritized by all the weighting sets in medium budgeting options. So it can also be considered as an effective waste prevention measure.
-
•
i13 – Donation tax incentives - and i20 – Centralized composting - are usually the last measures to be prioritized presumably due to their high cost and lower environmental savings.
-
•
i21 – Centralized anaerobic digestion (CAD) - is only implemented in one of the weighting sets (i.e. W3, Tuomisto et al., 2012), remaining in the other ones not implemented even if there is enough budget to do so. The main reason is that CAD performs worse than landfilling in most of impact categories. In this sense, only applying W3 CAD is implemented due to the high importance of the impact category marine eutrophication (ME) and relative importance of climate change (CC), in which CAD performs better than landfilling.
-
•
The general trend of prioritization seems to be in line with the disposition of the waste hierarchy in which prevention measures are prioritized over reuse and recycle-recovery measures. Albeit, as mentioned before, certain recycle, recovery and reuse measures (e.g. i14 – Standardized donation regulation, and i20 – Centralized composting) will be prioritized before some prevention measures. This point reinforces the statement that the waste hierarchy acts as a priority guideline, but for the final decision of implementing different prevention and management measures other analytical approaches may be required to select the most sustainable and cost-effective options.
-
•
As mentioned in Section 2.4.1, due to integrality constraints, almost all the Pareto fronts shown in Fig. 7 present unsupported Pareto optima (the only exception is the Pareto front for W3). These optima should be carefully considered by the decision maker since they represent points in which an increment in the budget does not lead to the implementation of any additional measure and so the TEIA remains the same. An example of these unsupported Pareto optima can be seen in W1 when for the budget 1423.2 M$ the TEIA is 0.73% and for the next budget 1660.4 M$ the TEIA is the same (i.e. same measures implemented).
-
•
When applying W2 (Castellani et al. 2016 – non binding) and W3 (Tuomisto et al., 2012), the TEIA obtained with a defined budget is higher than when applying the other weighting sets. In the case of W3 (that ensures a TEIA higher than W2), this may be due to the relatively high weight assigned to two impact categories (terrestrial eutrophication and marine eutrophication) that are quite relevant in terms of normalized scores (each of the two covers 10% of the total impact). However, in general, the relevance of the weighting set in the prioritization of the measures appears to be limited compared to the influence of the budget constraint.
In addition to the results already shown, the model provides information about the real food waste prevention target (FWPT), intended as the ratio between the total quantity of food waste prevented (i.e. diverted from landfill) and the total quantity of food waste generated, that could be achieved for different budgeting when maximizing the TEIA. Having knowledge of the FWPT can be useful to analyze the link between reducing food waste generation and reducing environmental impact along the FSC since both are not always correlated. For the calculation of the potential FWPT achievable once the previous model (MODEL 1) has been solved, Eqs. (14), (15), (16) shall be used:
| (14) |
| (15) |
| (16) |
Fig. 9 shows the FWPT at each budgeting step when the TEIA has been maximized for each weighting set. As shown in Fig. 9, for every weighting set, there is at least one point in which the line decreases i.e. the FWPT for one budget step is lower than the previous one. This means that while increasing (or at least maintaining) the TEIA, the quantity of food waste prevented decreases. For sake of clarity, let’s consider the following example from Fig. 9. In W2 for the budget 1186 M$ the following actions are prioritized: i1-i10, i12, i14, i15, i20 and i22 with a TEIA of 0.88% and a FWTP of 12.53% and for the next budgeting step of 1423.2 M$ the following actions are prioritized: i1-i10, i12-i16, i18, i19 and i22 with a TEIA of 0.89% and a FWTP of 5.5%. An increase in the budget allows the substitution of action i20 for actions i13, i16, i18 and i19 with the resulting increase of TEIA of 0.01% and the decrease of FWPT by 7%. This points out that when planning food waste prevention strategies, it is important to set the targets at the level of environmental impact, avoiding to set targets at the level of avoided food waste generation, since the latter could lead to misleading measure implementation planning.
Fig. 9.

Food waste prevention target (FWTP) at each budgeting step when the TEIA has been maximized for each weighting set. Note that W1 and W6 are coincident and overlap.
When analyzing the final results, it is important to consider the uncertainty associated to input data. In this case study, the main sources of uncertainty are:
-
(i)
Data concerning food consumption and the ratio of food waste associated to each FSC modelled in the BoP Food. The BoP is modelled to represent average European conditions. Therefore, variability among conditions in Member States and among citizens’ behavior should be considered when the analysis is focused on a specific situation.
-
(ii)
Data about costs, efficiency, scope factor and participation factor. The source of data (i.e. ReFED study) includes sensitivity analyses showing the data confidence for each measure, being higher for prevention than for reuse and recycling-recovery measures. Besides, ReFED refers to the US, whereas the food consumption and case study refers to Europe. FSC are currently quite standardized, so no relevant differences regarding costs and efficiencies are expected, however there may be differences in the participation factor, due to the different lifestyles of citizens in Europe and the US.
-
(iii)
Data about the environmental impact of the considered measures. On the one hand, the life cycle inventory of resources and emissions associated to each of the measures is a model of reality and, therefore, has some uncertainty. On the other hand, the impact assessment method used to quantify the potential environmental impact of each of the options considered can influence the results. Castellani et al. (2017) ran a sensitivity analysis on the results of the BoP Food used for the present study. Results of their work can give some insights on possible uncertainties associated to the impact assessment phase.
-
(iv)
The aggregation through the application of normalisation and weighting factors may introduce an additional layer of uncertainties (Benini and Sala, 2016). Normalisation in this study has been applied focusing on the European factors, which implies some shortcomings, such as an overestimation of the impact due to resource depletion. Weighting as well, due to inherent subjectivity underpinning the factors, is again associated with possible uncertainties (Pizzol et al., 2017).
5. Conclusions
In this paper a methodology using LCA and mathematical programing is proposed for decision makers to plan the implementation of food waste prevention and management measures maximizing the environmental impact prevention considering the limited economic resources. To show the capabilities of the methodology, a case study is proposed.
Up to now the waste hierarchy, introduced by the WFD, has been the rule followed to prioritize food waste prevention and management measures. Results in this paper are generally in line with the order stablished in the mentioned hierarchy but they highlight that when other criteria are considered along with the environmental one other tools are needed. The inclusion of the economic criteria, as a budget constraint, shows that not always prevention measures are prioritized before reuse or recycle-recovery measures since reuse and recycle-recovery measures can be more cost-effective and so prioritized first. The proposed methodology revealed to be especially helpful in identifying “quick wins” – measures that should be always prioritized in all plans since they avoid a high environmental impact at a low cost.
The choice of the weighting set appears to be less relevant than the cost-efficiency of the measures and the budget in defining the set of actions to be prioritize. In fact, this is highlighted by the similarity of the results shown when different weighting sets are selected within a fixed budget availability. This means that budget availability is the key parameter that may influence the choices of decision makers, rather than the importance that they may give to a specific type of impact (i.e. higher weight assigned to an impact category) compared to the others.
The preparation of the case study shown in this paper seed light on the difficulty of acquiring reliable data concerning food waste prevention actions. This limitation is even more relevant if we consider that available data (i.e. environmental impact, implementation cost, quantity of food avoided) for different FSCs may have a different geographical scope (e.g. EU and US) as in the present paper, limitation herein overcame by the assumption that the FSCs in developed countries are identical. Further data and studies on food waste prevention are needed. Furthermore, the data concerning quantity of food waste prevented by each measure depends on scope (S) and participation (P) factors. As reported by ReFED, very conservative values are used for those parameters and that is the reason why the results shown in this paper concerning the environmental impact prevented are so low. Further research will include a sensitivity analysis for these two parameters as well as the modelization of the variable implementation cost of each measure depending on these two parameters.
Finally, it was shown that a group of measures can prevent a lower quantity of food waste than a second group of measures but yet the former will avoid a higher environmental impact. This points out that when planning food waste prevention strategies, it is important to set the targets at the level of environmental impact, avoiding to set targets at the level of avoided food waste generation (in mass).
Footnotes
ReFED is a multistakeholder group formed in 2015 committed to tackling food waste at scale in the United States. ReFED has identified 27 of the best actions to reduce food waste detailing economic data and quantifying the food waste prevention potential of each measure. https://www.refed.com/
The project (called LC-IND) focused on indicators that measure the environmental impact of the consumption of goods and services by the average European citizen, focusing on food, housing, and transport, via the identification and environmental assessment of the most representative products of each category (Basket of Products). http://eplca.jrc.ec.europa.eu/?page_id=1517
Supplementary data associated with this article can be found, in the online version, at https://doi.org/10.1016/j.wasman.2017.11.007.
Appendix A. Supplementary material
References
- Benini L., Sala S. Integrated assessment of environmental impact of Europe in 2010: uncertainty and sensitivity of the normalisation factors to methodological assumptions. Int. J. Life Cycle Assess. 2016;21:224–236. [Google Scholar]
- Bjørn A., Hauschild M.Z. Introducing carrying capacity-based normalization in LCA: framework and development of references at midpoint level. Int. J. Life Cycle Assess. 2015;20:1005–1018. [Google Scholar]
- Brautigam K.R., Jorissen J., Priefer C. The extent of food waste generation across EU-27: Different calculation methods and the reliability of their results. Waste Manage. Res. 2014;32(8):683–694. doi: 10.1177/0734242X14545374. [DOI] [PubMed] [Google Scholar]
- Caramia, M., Dell’Olmo, P., 2008. Multi-objective management in freight logistics – Increasing capacity, service level and safety with optimization algorithms. Chapter 2 - Multi-Objective Optimization. Springer-Verlag, London.
- Castellani V., Benini L., Sala S., Pant R. A distance-to-target weighting method for Europe 2020. Int. J. Life Cycle Assess. 2016;21:1159–1169. [Google Scholar]
- Castellani V., Sala S., Benini L. Hotspots analysis and critical interpretation of food life cycle assessment studies for selecting eco-innovation options and for policy support. J. Clean. Prod. 2017;140(2):556–568. [Google Scholar]
- Corrado S., Ardente F., Sala S., Saouter E. Modelling of food loss within life cycle assessment: From current practice towards a systematization. J. Clean. Prod. 2017;140(2):847–859. [Google Scholar]
- Cristobal, J., Vila, M., Giavini, M., Torres De Matos, C., Manfredi, S., 2016. Prevention of waste in the circular economy: analysis of strategies and identification of sustainable targets - the food waste example. EUR 28422; Luxembourg (Luxembourg): Publications Office of the European Union; JRC105415; doi: 10.2760/256208.
- DEFRA – Department for Environment, Food and Rural Affairs (UK), 2011a. Applying the waste hierarchy: evidence summary. https://www.gov.uk/government/uploads/system/uploads/attachment_data/file/69404/pb13529-waste-hierarchy-summary.pdf.
- DEFRA – Department for Environment, Food and Rural Affairs (UK), 2011b. Guidance on applying the waste hierarchy. https://www.gov.uk/government/uploads/system/uploads/attachment_data/file/69403/pb13530-waste-hierarchy-guidance.pdf.
- EC – European Commission, 1989. Communication from the Commission to the Council and the Parliament: A community strategy for waste management. SEC (89) 934 Final.
- EC – European Commission, 2005. Communication COM(2005) 666: Taking sustainable use of resources forward: A Thematic Strategy on the prevention and recycling of waste. http://eur-lex.europa.eu/legal-content/EN/TXT/PDF/?uri=CELEX:52005DC0666&from=it.
- EC – European Commission, 2008. Directive 2008/98/EC of the European Parliament and of the Council of 19 November 2008 on waste and repealing certain Directives – Official Journal of the European Union L 312/3. http://eur-lex.europa.eu/legal-content/EN/TXT/PDF/?uri=CELEX:32008L0098&from=EN.
- EC – European Commission, 2011. DG ENV report: Guidelines on the preparation of food waste prevention programmes. http://ec.europa.eu/environment/waste/prevention/pdf/prevention_guidelines.pdf.
- EC – European Commission, 2012a. DG ENV Guidance on the interpretation of key provisions of Directive 2008/98/EC on waste. http://ec.europa.eu/environment/waste/prevention/pdf/Waste%20prevention%20guidelines.pdf.
- EC – European Commission, 2012b. DG ENV report: Preparing a Waste Prevention Programme – Guidance document http://ec.europa.eu/environment/waste/framework/pdf/guidance_doc.pdf.
- EC – European Commission, 2013. Commission Recommendation of 9 April 2013 on the use of common methods to measure and communicate the life cycle environmental performance of products and organisations. ANNEX II: Product Environmental Footprint (PEF) Guide. European Commission
- EC – European Commission, 2015a. Towards a circular economy. New package released on December 2nd, 2015. All documents included in the package are available online at http://ec.europa.eu/priorities/jobs-growth-investment/circular-economy/index_en.htm.
- EC – European Commission, 2015b. Communication COM(2015) 614/2: Closing the loop – An EU action plan for the Circular Economy. http://ec.europa.eu/priorities/jobs-growth-investment/circular-economy/docs/communication-action-plan-for-circular-economy_en.pdf.
- EC-JRC – European Commission - Joint Research Centre, 2011. International Reference Life Cycle Data System (ILCD) Handbook - Recommendations for Life Cycle Assessment in the European context - based on existing environmental impact assessment models and factors. ISBN 978-92-79-17451-3, doi: 10.278/33030. EC-JRC. Publications Office of the European Union, Luxembourg.
- EC-JRC – European Commission - Joint Research Centre, 2017. LC-IND: Life cycle indicators project. Information available at http://eplca.jrc.ec.europa.eu/?page_id=1517 (accessed September 2017).
- Eriksson M., Strid I., Hansson P.A. Carbon footprint of food waste management options in the waste hierarchy – a Swedish case study. J. Clean. Prod. 2015;93:115–125. [Google Scholar]
- FAO – Food and agriculture organization of the United Nations, 2011. Global food losses and food waste – Extent, causes and prevention. Rome.
- FAO – Food and agriculture organization of the United Nations, 2013. Food wastage footprint – Impacts on natural resources. Summary Report. Rome. http://www.fao.org/docrep/018/i3347e/i3347e.pdf.
- Finnveden G., Johansson J., Lind P., Moberg A. Life cycle assessment of energy from solid waste – part 1: general methodology and results. J. Clean. Prod. 2005;13:213–229. [Google Scholar]
- Gentil E.C., Gallo D., Christensen T.H. Environmental evaluation of municipal waste prevention. Waste Manage. 2011;31:2371–2379. doi: 10.1016/j.wasman.2011.07.030. [DOI] [PubMed] [Google Scholar]
- Gharfalkar M., Court R., Campbell C., Ali Z., Hillier G. Analysis of waste hierarchy in the European waste directive 2008/98/EC. Waste Manage. 2015;39:305–313. doi: 10.1016/j.wasman.2015.02.007. [DOI] [PubMed] [Google Scholar]
- Hamilton H.A., Peverill M.S., Müller S.B., Brattebo H. Assessment of food waste prevention and recycling strategies using a multilayer system approach. Environ. Sci. Technol. 2015;49(24):13937–13945. doi: 10.1021/acs.est.5b03781. [DOI] [PubMed] [Google Scholar]
- Huppes, G., van Oers, L., 2011. Background review of existing weighting approaches in life cycle impact assessment (LCIA). JRC Scientific and Technical Reports, Luxembourg: Publications Office of the European Union. http://bookshop.europa.eu/is-bin/INTERSHOP.enfinity/WFS/EU-Bookshop-Site/en_GB/-/EUR/ViewPublication-Start?PublicationKey=LBNA24997.
- ISO . International Organization for Standardization; Geneva, Switzerland: 2006. ISO 14040:2006 Environmental management – Life Cycle Assessment – Principles and framework. [Google Scholar]
- Jungbluth, N. (Ed.), Faist Emmenegger, M., Dinkel, F., Stettler, C., Doka, G., Chudakoff, M., Dauriat, A., Gnansounou, E., Spielmann, M., Sutter, J., Kljun, N., Keller, M., Schleiss, K., 2007. Life Cycle Inventories of Bioenergy, ecoinvent report no. 17, Zürich and Düβendorf, 2007.
- Laurent A., Baka I., Clavreul J., Bernstad A., Niero M., Gentil E., Hauschild M.Z., Christensen T.H. Review of LCA studies of solid waste management systems – Part I: Lessons learned and perspectives. Waste Manage. 2014;34:573–588. doi: 10.1016/j.wasman.2013.10.045. [DOI] [PubMed] [Google Scholar]
- Laurent A., Clavreul J., Bernstad A., Baka I., Niero M., Gentil E., Christensen T.H., Hauschild M.Z. Review of LCA studies of solid waste management systems – Part II: Methodological guidance for a better practice. Waste Manage. 2014;34:589–606. doi: 10.1016/j.wasman.2013.12.004. [DOI] [PubMed] [Google Scholar]
- Mourad M. Recycling, recovering and preventing “food waste”: competing solutions for food systems sustainability in the United States and France. J. Clean Prod. 2016;126:461–477. [Google Scholar]
- Nemecek, T., Kagi, T., 2007. Life cycle Inventories of Agricultural Production Systems, ecoinvent report no. 15, Zürich and Düβendorf, 2007.
- Notarnicola B., Tassielli G., Renzulli P.A., Castellani V., Sala S. Environmental impacts of food consumption in Europe. J. Clean. Prod. 2017;140(2):753–765. [Google Scholar]
- Pizzol M., Laurent A., Sala S., Weidema B., Verones F., Koffler C. Normalisation and weighting in life cycle assessment: Quo Vadis? Int. J. Life Cycle Assess. 2017;22:853–866. [Google Scholar]
- Priefer C., Jorissen J., Brautigam K.R. Food waste prevention in Europe – A cause-driven approach to identify the most relevant leverage points for action. Resour. Conserv. Recycl. 2016;109:155–165. [Google Scholar]
- ReFED, 2016. A roadmap to reduce US food waste by 20%. Technical Appendix. https://www.refed.com/downloads/ReFED_Technical_Appendix.pdf.
- Sala S., Benini L., Mancini L., Pant R. Integrated assessment of environmental impact of Europe in 2010: data sources and extrapolation strategies for calculating normalisation factors. Int. J. Life Cycle Assess. 2015;20:1568–1585. [Google Scholar]
- Salemdeeb R., Vivanco D.F., Al-Tabbaa A., Zu Ermgassen E.K.H.J. A holistic approach to the environmental evaluation of food waste prevention. Waste Manage. 2017;59:442–450. doi: 10.1016/j.wasman.2016.09.042. [DOI] [PubMed] [Google Scholar]
- Salemdeeb R., Zu Ermgassen E.K.H.J., Kim M.H., Balmford A., Al-Tabbaa A. Environmental and health impacts of using food waste as animal feed: a comparative analysis of food waste management options. J. Clean. Prod. 2017;140:871–880. doi: 10.1016/j.jclepro.2016.05.049. [DOI] [PMC free article] [PubMed] [Google Scholar]
- Schneider F. Review of food waste prevention on an international level. Waste Resour. Manage. 2013;166(WR4):187–203. [Google Scholar]
- Tuomisto H.L., Hodge I.D., Riordan P., Macdonald D.W. Exploring a safe operating approach to weighting in life cycle impact assessment – a case study of organic, conventional and integrated farming systems. J. Clean. Prod. 2012;37:147–153. [Google Scholar]
- Van Ewijk S., Stegemann J.A. Limitations of the waste hierarchy for achieving absolute reductions in material throughput. J. Clean. Prod. 2016;132:122–128. [Google Scholar]
- WRAP – Waste and Resources Action Program (UK), 2011. Applying the Waste Hierarchy: A Guide to Business, pp. 1–3. http://www.fccenvironment.co.uk/assets/files/pdf/content/wrap-applying-wastehierarchy.pdf.
Associated Data
This section collects any data citations, data availability statements, or supplementary materials included in this article.