Abstract
Unsupervised discovery of pulmonary emphysema subtypes offers the potential for new definitions of emphysema on lung computed tomography (CT) that go beyond the standard subtypes identified on autopsy. Emphysema subtypes can be defined on CT as a variety of textures with certain spatial prevalence. However, most existing approaches for learning emphysema subtypes on CT are limited to texture features, which are sub-optimal due to the lack of spatial information. In this work, we exploit a standardized spatial mapping of the lung and propose a novel framework for combining spatial and texture information to discover spatially-informed lung texture patterns (sLTPs). Our spatial mapping is demonstrated to be a powerful tool to study emphysema spatial locations over different populations. The discovered sLTPs are shown to have high reproducibility, ability to encode standard emphysema subtypes, and significant associations with clinical characteristics.
1 Introduction
Pulmonary emphysema overlaps considerably with chronic obstructive pulmonary disease (COPD), and is traditionally subcategorized into 3 standard subtypes: centrilobular emphysema (CLE), panlobular emphysema (PLE) and paraseptal emphysema (PSE). These subtypes were initially defined on autopsy. Radiologists’ labeling of these subtypes on CT is labor-intensive, with substantial intra- and inter-rater variability [1]. Moreover, pathologists have disagreements on the very existence of such pure subtypes.
CT-based automated emphysema labeling has received increasing interest recently, in both supervised manners for replicating standard subtyping [2,3], and unsupervised manners to discover new subtypes [4–6]. Preliminary CT-based clinical studies suggest that regional analysis will be instrumental in advancing the understanding of multiple pulmonary diseases [7]. Most existing approaches for learning emphysema subtypes on CT are limited to texture-based features, which are sub-optimal due to the lack of spatial information. Previous studies [5,6] proposed to generate unsupervised lung texture patterns (LTPs) based on texture appearance, and to group them based on their spatial co-occurrence. However, such approaches only account for relative spatial occurrence at the scale of local regions of interest (ROIs). Also, post-grouping could not guarantee spatial homogeneity of the generated LTPs. Regarding spatial lung partitioning, using lung lobes leads to coarse spatial precision while using subdivisions of Cartesian coordinates lacks relative information such as peripheral versus central positioning which is important in defining PSE. Therefore a dedicated lung shape spatial mapping is designed in this work that adapts to individual shapes while enabling cross-subject comparison without registration. We then introduce an unsupervised framework for combining spatial and texture information to discover localized emphysematous LTPs, which we call the spatially-informed LTPs (sLTPs). We evaluate our lung shape spatial mapping for studying emphysema spatial patterns on CLE/PLE/PSE-predominant populations, and evaluate the discovered sLTPs in terms of reproducibility, ability to encode standard emphysema subtypes, and association with clinical characteristics.
2 Method
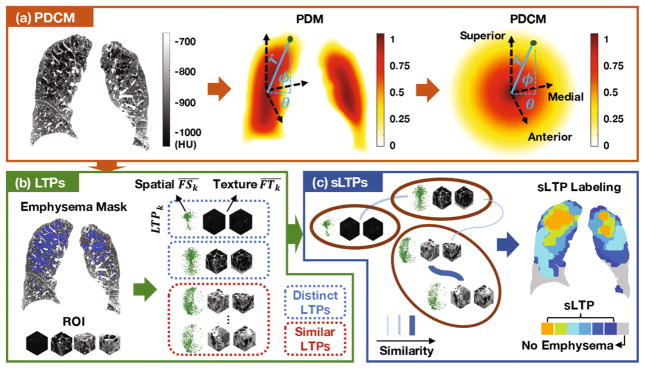
The pipeline for generating sLTPs, illustrated in Fig. 1, consists of the following three steps: (1) generate spatial mapping of the lungs; (2) generate LTPs using texture-based features and augment them with spatial features; (3) discover a distinct set of sLTPs.
Fig. 1.
Framework overview: (a) Poisson distance maps (PDMs) and conformal mapping are used to generate spatial maps (PDCMs) of the lungs; (b) Lung texture patterns (LTPs) are generated using texture and spatial features from emphysematous training ROIs; (c) Final set of spatially-informed LTPs (sLTPs) is generated via graph partitioning on LTP similarity.
2.1 Spatial Mapping of the Lung Shape
We use Poisson distance map (PDM) [8] to encode the shapes of individual lungs V, and label voxel positions in the range of [0, 1], measuring the “peel to core” distance between a given voxel and the external lung surface V. Formally, we compute the Poisson solution U on the binary segmentation V using the following diffusion conditions:
| (1) |
where ΔU = Uxx +Uyy +Uzz. We further compute U* as the post-relaxed version of U to ensure robustness [8].
To uniquely encode 3D voxel positions, we add conformal mapping of the PDM solution onto a sphere, which we call the Poisson distance conformal map (PDCM). We define r = 1 − U*, and encode superior versus inferior, anterior versus posterior and medial versus lateral voxel positioning via latitude and longitude angles (θ, ϕ) with respect to the PDM core position (r = 0) and standard image axis.
2.2 Augmented Lung Texture Patterns
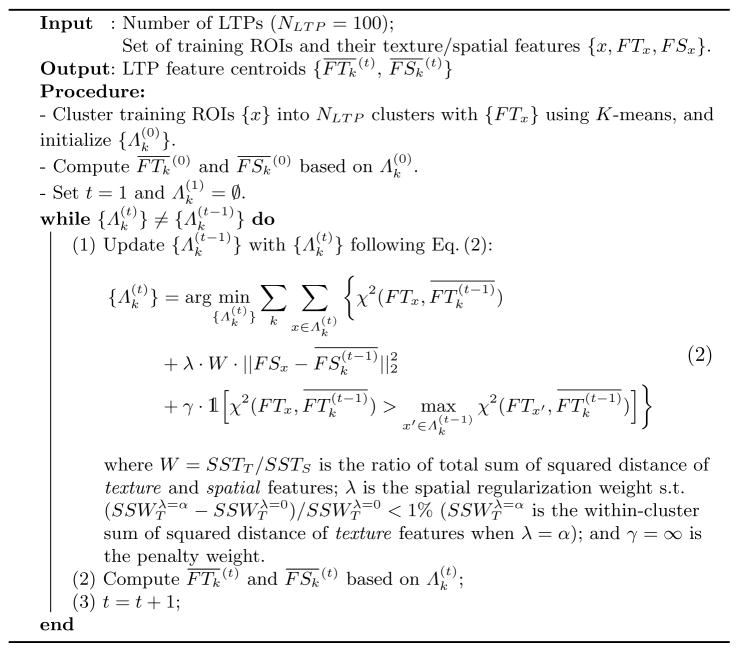
First, voxels are labeled as emphysema if they have intensity values below −950 HU [9] or are selected by the hidden Markov measure field [10] segmentation method, with parameters adapted to the scanner type. Then emphysema-specific LTPs are generated on ROIs with volumetric percentage of emphysema (%emph) above 1%. We first generate an initial set of 100 LTPs {LTPk}k=1,..,100 with texture features, and then augment them iteratively via spatial regularization as detailed in Algorithm 1. The texture features are texton-histogram features with pre-learned textons, which were shown to be superior in a similar task in [6]. We follow the parameter settings in [6], with a codebook of 40 textons (defined as centers of clusters of 3×3×3 pixels patches). ROIs size is set to 25mm3 (approximating the size of secondary pulmonary lobules). The texture centroid of LTPk is where FTx is the texture feature of a ROI x, and Λk denotes the set of ROIs that are labeled as LTPk.
Algorithm 1.
Augmenting Lung Texture Patterns
The spatial centroid of LTPk can be modeled as the average spatial density of ROIs in Λk. Computationally, we define lung sub-regions by dividing r ∈ [0, 1], θ ∈ [0, 2π] and φ ∈ [−π/2, π/2] into 3, 4 and 3 regular intervals to distinguish core to peel, anterior/medial/posterior/lateral, and inferior to superior regions. The spatial feature FSx of a ROI x is a one-hot vector of length 3×4×3 indicating the sub-region to which x belongs. The spatial centroid of LTPk is computed as . To augment LTPs with spatial features, dedicated metrics are used to enforce intra- and inter-class similarity constraints. The spatial histogram bins are well-aligned given the spatial sub-divisions while the texture histogram bins are more ambiguous. We therefore propose in Algorithm 1 a mixed χ2-ℓ2 similarity metric to enforce spatial regularity while preserving textural intra-class similarities. Spatial regularization will inevitably decrease the textural homogeneity of individual LTPs. Given no ground-truth justification, we hereby tune a regularization weight λ with an empirically acceptable decrease in texture homogeneity. A penalty term is added with γ = ∞ to prevent a ROI from being labeled as a spatially preferred but texturally dissimilar LTP.
2.3 Final Spatially-Informed LTPs
The final set of sLTPs is expected to preserve distinct augmented LTPs and discard redundant ones. We generate sLTPs by partitioning a weighted undirected graph with similarity weights G defined as:
| (3) |
where Ni→j denotes |Λj | when removing LTPi, and Ni denotes |Λi| when all LTPs exist. A ROI with a texture distance to its alternative LTP label LTPk exceeding the maximum texture within-cluster distance of LTPk is not relabeled, which makes (Σk Ni→k)/Ni ≤ 1. The indicator function 𝟙(·) is designed to preserve distinct patterns, and the threshold T is set to 0.5. In contrast to previous unsupervised emphysema subtyping algorithms [4–6] that rely on an arbitrarily pre-defined number of subtypes, we use Infomap [11] for the partition of G. Infomap is a community detection method that efficiently describes information flow on a network graph through Huffman coding, and returns a final number of sLTPs with guaranteed global optimality.
3 Experimental Results
3.1 Data
The data consists of 321 full-lung CT scans from MESA COPD study [1] (4 scans are discarded due to excessive noise [6]). The global extents of the three standard emphysema subtypes (%CLE, %PLE and %PSE over the total lung volume per scan) are available, corresponding to the average of visually assessed scores by four experienced radiologists. All scans were acquired at full inspiration, using either a Siemens 64-slice scanner or a GE 64-slice scanner, and were reconstructed using B35/Standard kernels. The slice thickness was 0.625 mm, and isotropic in-plane resolution was in the range [0.58, 0.88] mm.
3.2 Population Evaluation Using PDCM
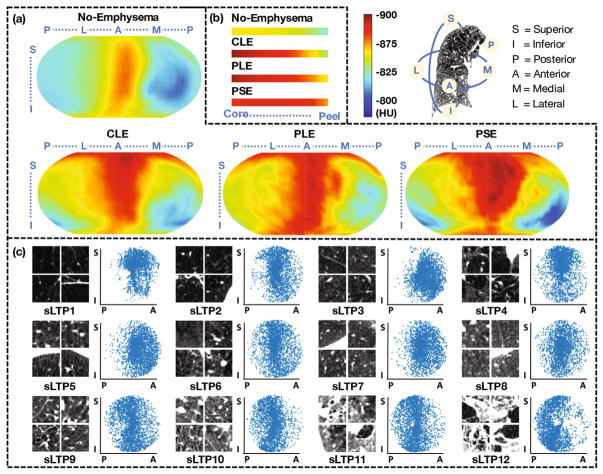
We first demonstrate the ability of PDCM to study population-level emphysema spatial patterns. In Fig. 2(a) the average lung field intensity per angle (θ, ϕ) is projected onto each individual PDCM surface, and then averaged on normal subjects without emphysema and CLE-, PLE-, and PSE-predominant subjects with %emph > 5%. Similarly, averaged intensity across r from core to peel are visualized in Fig. 2(b). From Fig. 2(a), attenuation values for all groups are higher in anterior versus posterior regions, which agrees with the gravity effect. Maps of CLE- and PSE-predominant subjects appear to have lower attenuation (more emphysema) in superior versus inferior regions, while this is not obvious for PLE-predominant subjects. This agrees with the observation in [1] on this dataset that CLE and PSE severity were greater in higher versus lower lung zones, whereas severity of PLE did not vary by lung zone. Furthermore, low attenuation regions are more diffused, and clear regions of normal attenuation (blue) are absent for PLE-predominant subjects, which agrees with the definition of PLE. From Fig. 2(b), PSE-predominant subjects appear to have higher attenuation in the core and lower attenuation on the peel than CLE- and PLE-predominant subjects, which agrees with the definition of PSE. Attenuation values appear to be higher in the peel versus core, which is likely due to the presence of mediastinal/costal pleura.
Fig. 2.
(a) Average intensity (HU) mapped onto PDCM surfaces for no-emphysema, CLE-, PLE- and PSE-predominant subjects (N = 205, 37, 12 and 10 respectively). (b) Core to peel average intensity for the same population. (c) Random ROI samples (axial cut) and sagittal spatial scatter plots of 12 sLTPs learned on the full training set.
3.3 Qualitative and Quantitative Evaluations of sLTPs
A random 3/4 of the total dataset is used as training scans (N = 238), while the others (N = 79) are used for testing. An average of 2,726 ROIs are extracted per scan to densely (with overlap) cover the emphysematous areas. A final set of 12 sLTPs is discovered using the full training set, and are illustrated in Fig. 2(c). ROIs belonging to the same sLTP appear to be textually homogeneous, and each sLTP appears to have a distinct pattern, either textually or spatially. Since we jointly enforce spatial prevalence and textural homogeneity, a sLTP can have spatial “outliers” that were texturally favored.
Reproducibility
Four training subsets are generated by randomly eliminating 25% of the training scans. Reproducibility of sLTPs is measured by computing the overlap of test ROI labels using the Hungarian method for optimal sLTP matching [12], and the sLTPs learned from the full training set as the ground-truth. We discovered 12, 12, 13, and 13 sLTPs on training subsets. The average labeling Dice ratio is 0.91, which corresponds to a very high reproducibility level. The number of discovered sLTPs varies slightly between training subsets. This can be caused by a large change in the proportion of certain rare LTPs within the subsets, which modifies the weights of the similarity graph.
Ability to Encode Standard Subtypes
We expect the 12 learned sLTPs to be able to encode the standard emphysema subtypes. We evaluate here the prediction ability using a constrained multivariate regression [6], and compare our method with two previous algorithms [5,6] (implemented with our training data, and setting the numbers of LTPs to 12 for comparison with a constant number of CT-based predictors). Intraclass correlation (ICC) values between predicted standard emphysema subtype scores and ground truth on the full dataset (N = 317), computed in a 4-fold cross validation manner, are reported in Table 1. Our sLTP model returns comparable ICC values and even higher for CLE and PSE standard subtypes.
Table 1.
ICC and 95% confidence interval between predicted standard emphysema subtype scores and ground truth.
Clinical Significance
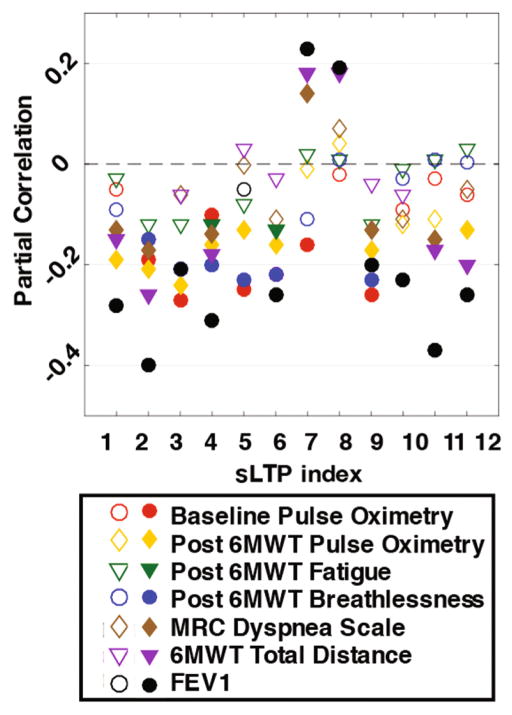
Spearman’s partial correlations between sLTP percentage within the lung and clinical characteristics [1] after adjusting for demographical factors (age, race, gender, height and weight) are visualized in Fig. 3. Correlation values for MRC dyspnea scale, post six minute walk test (6MWT) breathlessness and fatigue are flipped so that a negative correlation always corresponds to more symptoms. Strong partial correlations were present for FEV1, 6MWT total distance, MRC dyspnea scale, and pre (baseline) and post 6MWT oxygen saturation. While sLTP 7 and sLTP 8 seem to be associated with healthier subjects (positive correlations), the other sLTPs are present often together with symptoms (negative correlations). We then additionally adjusted for %emph−950 in the partial correlation (not shown in the figure), and found that 12 sLTPs, 7 sLTPs, 6 sLTPs, and 5 sLTPs remain significantly correlated with FEV1, 6MWT total distance, post 6MWT oxygen saturation and MRC dyspnea scale respectively. These results indicate that the clinical relevance captured by the sLTPs would not be available when using the standard measure of %emph−950.
Fig. 3.
Partial correlations between %sLTP and clinical measures (shaded: statistically significant with p < .05).
4 Discussions and Conclusions
In this work, we exploit a conformal spatial mapping of the lung shape to uniquely encode 3D voxel position in unregistered CT scans. We propose an unsupervised learning framework for discovering lung texture patterns of emphysema that incorporates spatial information. Algorithmic designs include an original similarity metric of spatio-textural features combining χ2-ℓ2 distances, data-driven weight parameters, and Infomap graph partitioning. Lung shape spatial mapping enables straightforward population-wide discovery of emphysema spatial patterns in CLE/PLE/PSE-predominant subjects. Spatially-informed emphysema lung texture patterns (sLTPs) generated in this study are reproducible, able to encode standard emphysema subtypes, and have significant correlations with clinical characteristics. In the future, the proposed method will be applied on a cohort of COPD patients for longitudinal progression analysis.
Acknowledgments
Thanks NIH/NHLBI R01-HL121270, R01-HL077612, RC1-HL100543, R01-HL093081 and N01-HC095159 through N01-HC-95169, UL1-RR-024156 and UL1-RR-025005 for funding.
References
- 1.Smith BM, Austin JH, et al. Pulmonary emphysema subtypes on computed tomography: the MESA COPD study. Am J Med. 2014;127(1):94.e7–94.e23. doi: 10.1016/j.amjmed.2013.09.020. [DOI] [PMC free article] [PubMed] [Google Scholar]
- 2.Sørensen L, Shaker SB, et al. Quantitative analysis of pulmonary emphysema using local binary patterns. IEEE Trans Med Imaging. 2010;29(2):559–569. doi: 10.1109/TMI.2009.2038575. [DOI] [PubMed] [Google Scholar]
- 3.Gangeh MJ, Sørensen L, Shaker SB, Kamel MS, Bruijne M, Loog M. A texton-based approach for the classification of lung parenchyma in CT images. In: Jiang T, Navab N, Pluim JPW, Viergever MA, editors. MICCAI 2010. LNCS. Vol. 6363. Springer; Heidelberg: 2010. pp. 595–602. [DOI] [PubMed] [Google Scholar]
- 4.Binder P, Batmanghelich NK, Estepar RSJ, Golland P. Unsupervised discovery of emphysema subtypes in a large clinical cohort. In: Wang L, Adeli E, Wang Q, Shi Y, Suk H-I, editors. MLMI 2016. LNCS. Vol. 10019. Springer; Cham: 2016. pp. 180–187. [DOI] [PMC free article] [PubMed] [Google Scholar]
- 5.Hame Y, et al. Sparse sampling and unsupervised learning of lung texture patterns in pulmonary emphysema: MESA COPD study. IEEE ISBI. 2015:109–113. [Google Scholar]
- 6.Yang J, et al. Explaining radiological emphysema subtypes with unsupervised texture prototypes: MESA COPD study. In: Müller H, et al., editors. MCV 2016, BAMBI 2016. LNCS. Vol. 10081. Springer; Cham: 2016. pp. 69–80. [DOI] [PMC free article] [PubMed] [Google Scholar]
- 7.Murphy K, et al. Toward automatic regional analysis of pulmonary function using inspiration and expiration thoracic CT. Med Phys. 2012;39(3):1650–1662. doi: 10.1118/1.3687891. [DOI] [PubMed] [Google Scholar]
- 8.Gorelick L, et al. Shape representation and classification using the poisson equation. IEEE Trans Pattern Anal Mach Intell. 2006;28(12):1991–2005. doi: 10.1109/TPAMI.2006.253. [DOI] [PubMed] [Google Scholar]
- 9.Yang J, Angelini ED, Balte PP, Hoffman EA, Wu CO, Venkatesh BA, Barr RG, Laine AF. Emphysema quantification on cardiac CT scans using hidden markov measure field model: the MESA lung study. In: Ourselin S, Joskowicz L, Sabuncu MR, Unal G, Wells W, editors. MICCAI 2016. LNCS. Vol. 9901. Springer; Cham: 2016. pp. 624–631. [DOI] [PMC free article] [PubMed] [Google Scholar]
- 10.Hame Y, Angelini ED, et al. Adaptive quantification and longitudinal analysis of pulmonary emphysema with a hidden markov measure field model. IEEE Trans Med Imaging. 2014;33(7):1527–1540. doi: 10.1109/TMI.2014.2317520. [DOI] [PMC free article] [PubMed] [Google Scholar]
- 11.Rosvall M, Bergstrom CT. Maps of random walks on complex networks reveal community structure. Proc Nat Acad Sci. 2008;105(4):1118–1123. doi: 10.1073/pnas.0706851105. [DOI] [PMC free article] [PubMed] [Google Scholar]
- 12.Roth V, Lange T, Braun M, Buhmann J. A resampling approach to cluster validation. In: Härdle W, Rönz B, editors. Compstat. Physica; Heidelberg: 2002. pp. 123–128. [Google Scholar]


