Abstract
Cancer results from a complex interplay of different biological, chemical, and physical phenomena that span a wide range of time and length scales. Computational modeling may help to unfold the role of multiple evolving factors that exist and interact in the tumor microenvironment. Understanding these complex multiscale interactions is a crucial step towards predicting cancer growth and in developing effective therapies.
We integrate different modeling approaches in a multiscale, avascular, hybrid tumor growth model encompassing tissue, cell, and sub-cell scales. At the tissue level, we consider the dispersion of nutrients and growth factors in the tumor microenvironment, which are modeled through reaction-diffusion equations. At the cell level, we use an agent based model (ABM) to describe normal and tumor cell dynamics, with normal cells kept in homeostasis and cancer cells differentiated apoptotic, hypoxic, and necrotic states. Cell movement is driven by the balance of a variety of forces according to Newton’s second law, including those related to growth-induced stresses. Phenotypic transitions are defined by specific rule of behaviors that depend on microenvironment stimuli. We integrate in each cell/agent a branch of the epidermal growth factor receptor (EGFR) pathway. This pathway is modeled by a system of coupled nonlinear differential equations involving the mass laws of 20 molecules. The rates of change in the concentration of some key molecules trigger proliferation or migration advantage response. The bridge between cell and tissue scales is built through the reaction and source terms of the partial differential equations.
Our hybrid model is built in a modular way, enabling the investigation of the role of different mechanisms at multiple scales on tumor progression. This strategy allows representating both the collective behavior due to cell assembly as well as microscopic intracellular phenomena described by signal transduction pathways. Here, we investigate the impact of some mechanisms associated with sustained proliferation on cancer progression. Specifically, we focus on the intracellular proliferation/migration-advantage-response driven by the EGFR pathway and on proliferation inhibition due to accumulation of growth-induced stresses. Simulations demonstrate that the model can adequately describe some complex mechanisms of tumor dynamics, including growth arrest in avascular tumors. Both the sub-cell model and growth-induced stresses give rise to heterogeneity in the tumor expansion and a rich variety of tumor behaviors.
Keywords: Hybrid multiscale model, Cell-agent based model, Signaling pathway
1. Introduction
Cancer is a complex biological multiscale phenomena, consisted of multiple inter-acting phenomena that are usually nonlinear and subject to different levels of regulation. A comprehensive understanding of cancer evolution and control requires the description and integration of events at multiple spatial scales, including the tissue, cellular, and molecular levels. The events are often embodied in intricate sequences of regulatory inter- and intracellular signaling pathways which are initiated through extracellular biochemical and biophysical cues from the microenvironment. These interconnected phenomena can only be captured by using multiscale models that integrate quantitative information at a variety of time and length scales22,26,41,46.
There is now an established literature on mathematical and computational models for representing the hallmarks of cancer5,14,20,33. In general, the modeling approach depends on the desired mechanisms or processes and the scales at which they take place. Most models of tumor growth that consider spatial heterogeneity are continuum cell population or discrete cell models2. Continuum approach captures the average of the global cell population behavior while the discrete approach allows the tracking of individual cell dynamics. There have been many hybrid models of tumor growth which integrate both continuum and discrete approaches7,11,33,41. Benefits of hybrid models include, for example, the ability to model the diffusion of nutrients and growth factors at the tissue level using partial differential equations while cell heterogeneity may be tracked through an agent based or cellular automata model1,9,31,35. Cellular automata are discrete models consisting of a large number of individuals that interact with each other through well-defined rules. For the specific case of modeling cancer, the individuals are normal or tumor cells, arranged in a regular spatial grid, and each site of the grid is associated with a specific cell. The neighborhood of each cell is defined a priori, according to a uniform pattern43. In uniform cellular automata models (CAM), interactions between neighboring cells occur synchronously, from common transition rules31,32. On the other hand, agent-based models (ABM) are similar to CAM, but more flexible. In the literature, it is common to differentiate them by two main properties, determined by the mobility and the type of agent. An ABM is not restricted to just identical individuals, and there may be more than one type of individual in space. In addition, the individuals (or agents) of an ABM are not necessarily dependent on a network. Thus, the modeling of the interactions is much more versatile; in particular, it is not restricted to local interactions. From a practical perspective, ABM presents greater flexibility in modeling cellular mechanisms. For example, because the ABM has no grid dependency, the positions of daughter cells in a mitosis and cell movement are not biased by specific routes due to lattice patterns, and can be better represented. Additionally, ABM allows for explicitly defining different interactions between agents so that there is no need to assign a single set of rules for all agents. Using this kind of approach for describing tumor cell behavior, Macklin et al.27,28,29 has improved the multi-cellular growth model presented in Ref. 12, developing the first patient-calibrated model of ductal carcinoma in situ.
The fundamental advantage of combining continuum and discrete modeling approaches is the ability to span multiscale phenomenon. Coupling signal-transduction pathways to an agent based model at the cellular scale which is then coupled to reaction-diffusion equations at the tissue scale provides new avenues for investigating the complex interplay of events occurring at tissue, cellular and sub-cellular scales. Desboeick and coworkers3,10,42 provided initial investigations in this direction. In particular, they developed classes of hybrid models integrating the epidermal growth factor and/or transforming growth factor α signaling pathways to investigate non-small cell lung cancer and brain tumors. However, these efforts do not explicitly account for cell interactions with the microenvironment and with other cells, or consider microenvironment heterogeneity.
In this contribution, we develop a complete hybrid framework to address significant physical and biological mechanisms of tumor progression acting from sub-cell to tissue scales. We develop consistent mathematical and computational approaches to extend the model developed in Ref. 29. In particular, we consider masses of tumors growing within healthy tissue and we model the effects of compressive stresses that accumulate within the tumor due to growth. We integrate the intracellular EGFR signaling pathway developed in Ref. 42, which allows us to investigate the effects of the downstream regulatory cell responses on tumor progression due to extracellular stimuli. We assume that individual cells may acquire proliferation or migration advantage, and we consider that haptotaxis drives migratory cells. The integration of these processes are able to describe a rich variety of avascular tumor dynamics. The developed multiscale platform is modular, allowing for the easy exchange or integration of new features.
The remainder of this manuscript is organized as follows. Section 2 describes the main biological assumptions on which the hybrid framework is built. We then present the tissue, cellular, and intracellular models and how information is translated between these three scales. In Section 3 we present a variety of simulations to highlight the main new features of the proposed framework. Our concluding remarks and perspective of future developments are presented in Section 4.
2. Model development
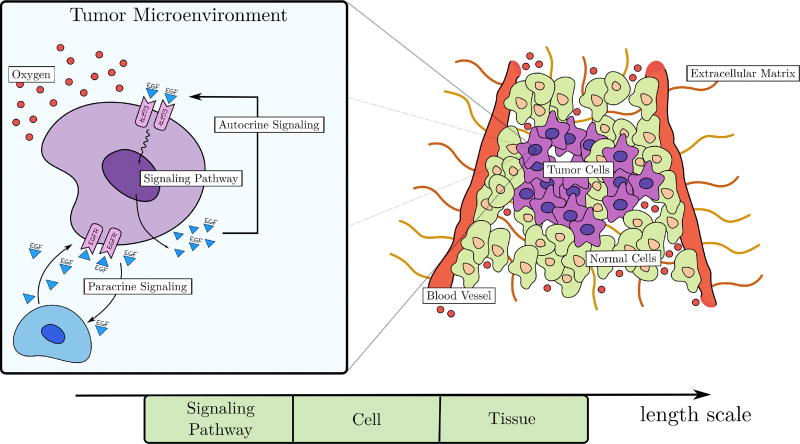
Our model captures key feature of several of the hallmarks of cancer20,21 including the ability of tumor cells to stimulate their own growth, replicate indefinitely, resist apoptosis, evade growth suppressors, and invade local tissue. (See Figure 1.)
Fig. 1.
Schematic description of the key biological characteristics included in the model. The tumor microenvironment is highly heterogeneous, consisting of normal and cancer cells, extracellular matrix, and blood vessels. Original blood vessels provide oxygen that maintains cell viability. The box on the left presents an enlargement of an individual tumor cell indicating its interactions with the surrounding mileau via autocrine and paracrine signaling as well uptake of oxygen.
At the tissue scale, we consider a heterogeneous microenvironment consisting of normal and tumor cells, extracellular matrix, and a pre-existing network of blood vessels. Oxygen released by the blood vessels diffuses in the microenvironment, providing the only source of nutrients to maintain cellular functions. Although not shown in Figure 1, tumor cells are further differentiated into a variety of phenotypes including quiescent, proliferative, migrating, hypoxic, apoptotic, and necrotic. In particular, proliferative and migratory phenotypes are orchestrated by complex signaling networks that integrate extracellular stimuli to produce regulatory responses20,25. Here we consider the epidermal growth factor receptor (EGFR) pathway which is known to be upregulated in about 30% of all cancers36. EGF is a protein that regulates a variety of cell functions, including cellular proliferation, differentiation, and survival. We assume that EGF is released by a quiescent tumor cell through autocrine signaling, so that it binds to surface receptors (EGF receptors - EGFR) on that same cell, triggering a cascade of protein interactions within the cell to produce a regulatory response that may give a cell proliferation or migration advantage. EGF also diffuses to nearby tumor cells. In this way, the macroscopic structure of tumor progression depends on the collective behavior of individual cells, each responding to external stimuli through sub-cellular events, governed by the supply of local oxygen and EGF availability.
Another important phenomenon considered in this model is the effect of the compressive stress accumulation within the growing tumor. These stresses play an important role on tumor evolution, regulating a variety of pathologies such as the collapse of blood and lymphatic vessels37,40. Higher compressive stresses are known to inhibit cell mitosis and stimulate metastasis23,40. Here we model proliferation inhibition induced by tumor growth. Thus, our hybrid model aims to integrate mechanisms from sub-cell (nm) to tissue (mm, cm) scales.
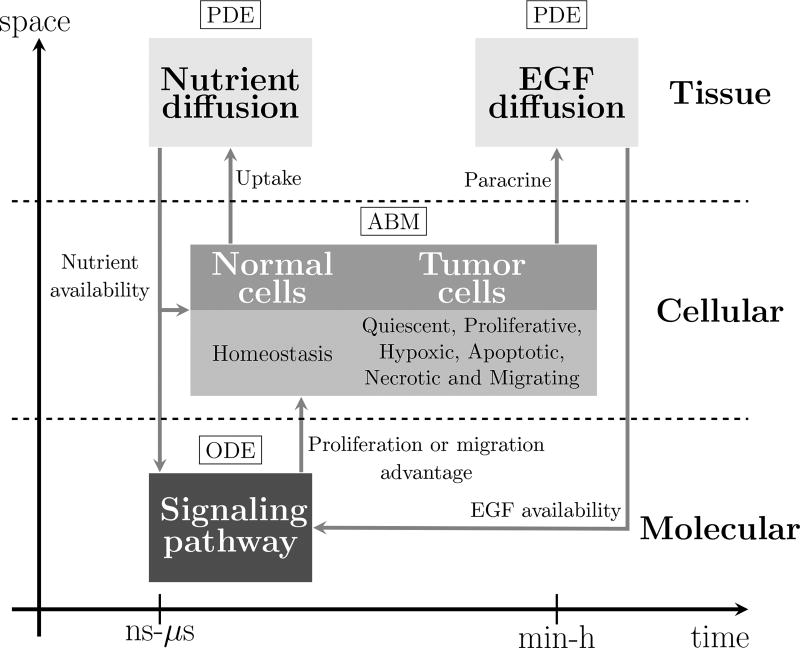
The three-scale avascular hybrid model developed here is depicted schematically in Figure 2. The ABM that describes the dynamics and movements of the normal and tumor cells is the core of the model. For simplicity, normal cells are kept in a state of homeostasis while cancer cells are differentiated into quiescent, proliferative, hypoxic, necrotic, apoptotic, and migrating phenotypes. Cell proliferation and migration are controlled by an intracellular signaling pathway in response to the availability of oxygen and EGF as well as by compressive stresses accumulated inside the tumor. The EGFR signaling pathway is modeled by a system of ordinary differential equations (ODEs) describing the stoichiometry of reactant and product protein complexes. The change in concentration of intracellular signal transducers triggers a cell proliferation or migration advantage. The biochemical cascade begins by activating the EGFR. This mechanism is modeled by a parabolic diffusion equation. The nutrient concentration also plays a key role on cell dynamics. In the present model, oxygen is considered the single source of nutrients, which is transported by diffusion from the original vascular network. Since oxygen transport is much faster than the cell cycle, it is modeled by a steady-state diffusion-reaction equation. We describe each of these models, as well as how they are coupled, in the following sections.
Fig. 2.
Schematic description of the model. The nutrient and EGF dispersions that occur at the tissue scale are modeled by partial differential equations. At the cell scale, healthy and cancer cells are described using an agent based model. The intracellular phenomena that regulate cell proliferation and cell migration are described by a mass action model of the biochemical signaling pathway through a system of ordinary differential equations.
2.1. The Cell/Agent Based Model
The cellular scale is described through a lattice-free ABM, which allows for the tracking of each cell individually and describes the cell behavior in the microenvironment. The basic structure of the model has been inspired by that developed in Ref. 29 for the ductal carcinoma in situ. However, unlike Ref. 29, we consider both healthy (normal) and cancer cells which give rise to important mechanical interactions such as growth-induced stresses.
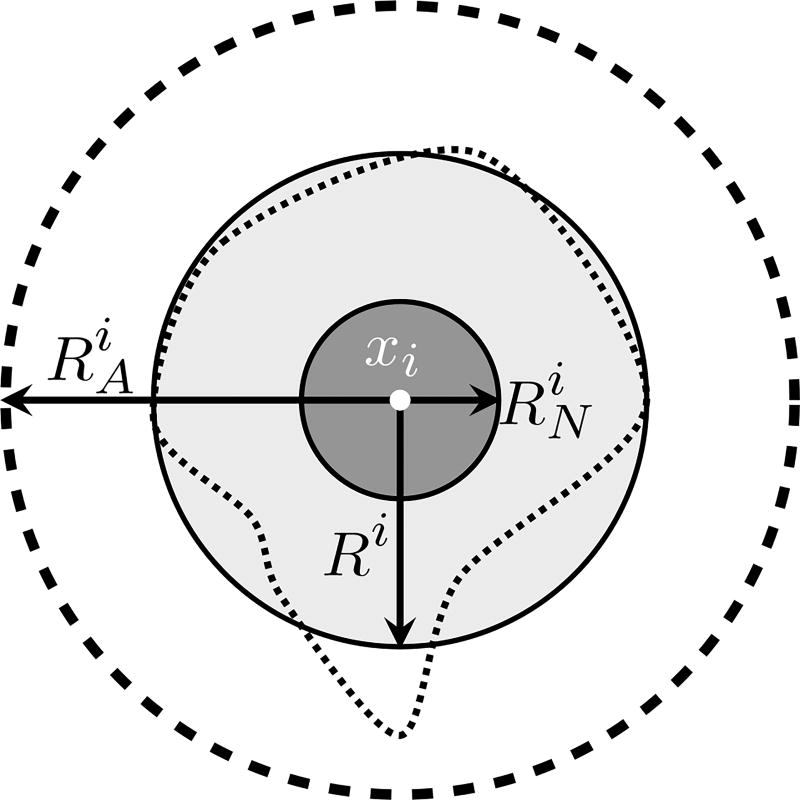
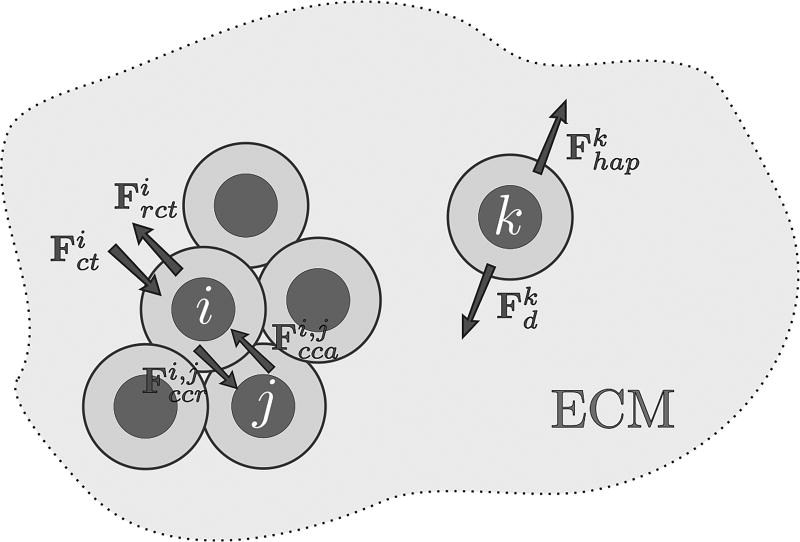
At time t, and position xi lies the ith cell, which is a physical object (an agent) that may interact with other cells and with the microenvironment through a variety of mechanical and chemical-driven forces (adhesion, repulsion, chemical attraction, etc.) which ultimately define the cell’s lattice-free movement. Like many agent models12,13,29, the cell geometry is quite simple: the ith cell has a circular shape of radius Ri with a quasi-incompressible nucleus of radius , as depicted in Figure 3. Cells are allowed to overlap their cytoplasms, mimicking a possible cell deformation due to interactions with other cells and with the microenvironment. Here, cell-cell adhesion and cell-cell repulsion are short-range interactions specified by an action radius . Cell movement also depends on forces resulting from the interstitial fluid drag resistance and the haptotaxis towards extracellular matrix degradation. The effects of the compressive stresses that accumulate inside the tumor due to growth are also modeled, providing a feedback control mechanism on mitosis.
Fig. 3.
Geometric cell description of the ith cell, in which Ri is the cell radius, is the nuclear radius, and is the action radius. The irregular dashed curve represents one possible cell geometry which is simplified by the assumption of the circular cell shape. This approach is inspired by Ref. 29.
2.1.1. Cell Movement
The movement of each cell is driven by the force balance among cells, which depends on the cell position, time, and the microenvironment condition. The dynamic composition and structure of the extracellular matrix (ECM) and a variety of cell adhesion molecules mediate cell binding and migration. For simplicity, we do not consider ECM degradation and regeneration, ECM receptors and cell adhesion molecules, among other components that ultimately regulate cell-substrate adhesion. We simply assume that ECM composition and organization is heterogeneous, which yields haptotaxis. Since EGF is the only extracellular growth factor considered in the model, there is no cell movement due to chemotaxis (though it may be easily integrated in the present modeling framework). We consider that cell movement is determined by the action of the following four mechanisms:
cell-cell adhesive and cell-cell repulsive forces (denoted by Fcca and Fccr, respectively),
compression and resistance to compression forces (denoted by Fct and Frct, respectively) due to growth-induced stress,
force driven by haptotaxis (Fhap),
drag force of interstitial fluid flow (Fd).
Disregarding gravity, in a low speed interstitial flow the linear drag is given by Fd = −ηυ, where υ is the cell velocity, and the constant η depends on the fluid viscosity. The forces Fcca and Fccr depend on cell position and are defined through two interaction potentials (φ for adhesion, and ψ for repulsion6,12,27,29,35). The adhesive and repulsive forces between the ith and jth cells are, respectively, given by
| (2.1) |
| (2.2) |
in which dij = xj − xi is the distance between the ith and jth cells. The gradients of the potentials φ(d; RA) and ψ(d; RN, R) are simplified versions of those defined in Ref. 29, given by
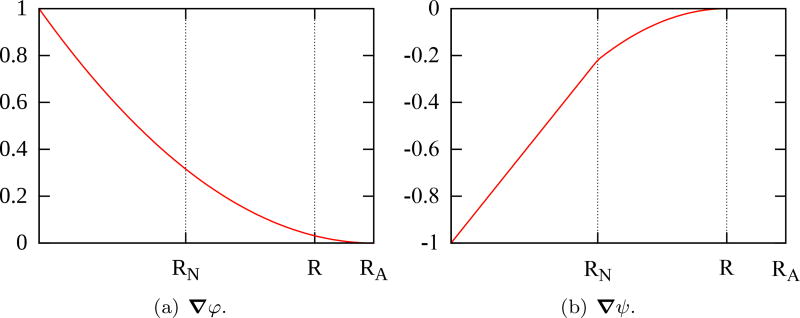
To illustrate, Figure 5 shows ∇φ and ∇ψ with respect to the distance from the center of the cell for RN = 5.295 µm, R = 9.953 µm and RA = 12.083 µm. Both have compact support defined by RA and R, respectively. The adhesion between cells increases with their proximity and highest repulsive interaction takes place when |d| < RN, due to the small compressibility of cell nuclei. To avoid cell nuclei overlapping, the balance between ∇φ and ∇ψ must occur in the cytoplasm so that they are scaled by parameters ccca and cccr. We assume that ccca = γcccr, where γ is the coefficient of proportionality.
Fig. 5.
Gradients of potential functions φ (a) and ψ (b) with respect to the distance from the center of the cell for RN = 5.295 µm, R = 9.953 µm and RA = 12.083 µm. Both cancel out for distances greater than the action radius RA.
We define the forces Fct and Frct to model the effects of the compressive stress accumulation within the growing tumor. Higher compressive stresses are known to inhibit cell mitosis and stimulate invasion23,40. In vitro experiments conducted in Ref. 8 correlate stress accumulation with proliferation inhibition and an increase of apoptosis. We assume that the number of cells that leave the computational domain, denoted by Nout(t), directly correlates with the growth-induced stress. In this way, Nout(t) is used to regulate cell proliferation, as shown in the next section. Here, we define
| (2.3) |
| (2.4) |
which are measures of stress accumulation within the tumor. In definitions (2.3) and (2.4), is the normal distance between the center of the cell and the domain boundary, and the real-valued function K(V, t) ∈ [0, 1] depends on the tumor volume at time t. We highlight two limiting cases:
K = 0: there is no stress accumulation and the tumor evolution does not depend on the medium deformation,
K = 1: the boundary behaves like a non-permeable incompressible membrane.
In this work, we set K = 0.1, cccr = cct, crct = 10ccca = 10γcccr for simplicity. (A detailed calibration procedure is the focus of a forthcoming effort.)
Migrating cells undergo haptotaxis towards the degradation of the ECM density, denoted by f. Given a heterogeneous field for f and the adhesion coefficient χ between the ith migrating tumor cell and the ECM, the haptotatic force is defined as
| (2.5) |
The equation of motion of each cell is obtained by summing the contribution of forces from all other cells, disregarding the inertial effects since the equilibrium is reached in a time frame much smaller than the cell cycle. Thus, with no chemical attractant and interaction with the ECM, and denoting by N (t) the total number of cells, Newton’s second law applied to the ith cell yields
| (2.6) |
The term under summation evaluates the cell-cell interactions while the last three terms represent the cell-microenvironment interactions. As in Refs. 13,29,35, given the drag force of interstitial fluid flow , we obtain
| (2.7) |
In Appendix A we present the overall steps to evaluate the force balance, the cellular velocities and their final positions.
2.1.2. Phenotypic heterogeneity
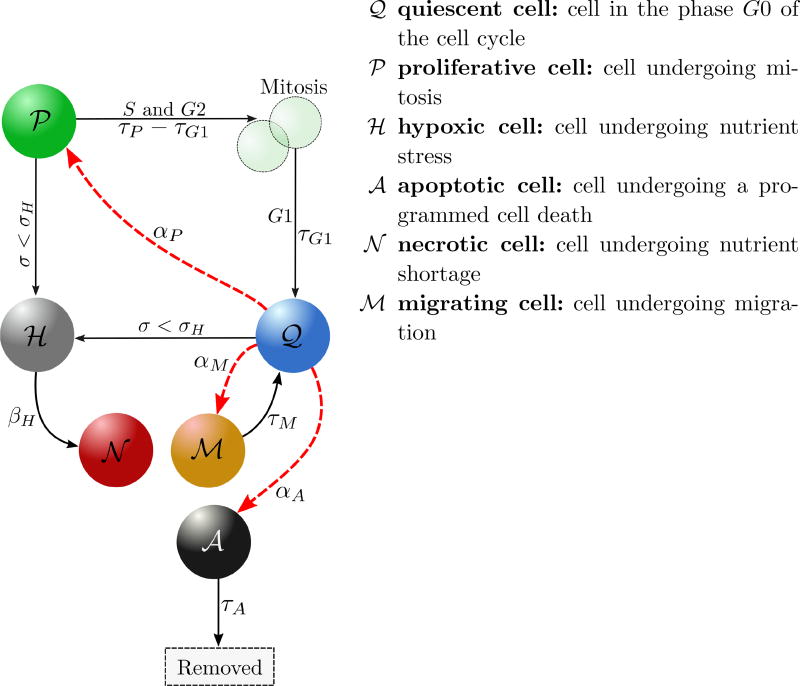
Every normal or tumor cell is an agent that may interact with the microenvironment and with other cells. We consider that normal cells are in homeostasis. As in Ref. 29, phenotypic heterogeneity in cancer cells is here characterized by the five states illustrated in Figure 6. These cell states result from an intricate interplay of nutrient availability, stimuli from the microenvironment, and interactions between the cells themselves. We also integrate negative proliferation feedback due to the accumulation of growth induced compressive stress, and we consider the intracellular decision process that gives a cell proliferation or migration advantage.
Fig. 6.
Schematic illustration of cancer cell transitions, that can be deterministic (black arrows) or stochastic (red arrows). αP, αM and αA are intensity functions of the stochastic processes. Cells become hypoxic if the nutrient concentration σ drops bellow the threshold σH. Hypoxic cells become necrotic automatically (at a rate βH → ∞) since we are considering an avascular model. Apoptotic cells are removed from the simulation after τA, time at which the processes of organized cell degradation and phagocytosis take place. Quiescent cells may achieve proliferation or migration advantage. Once a cell receives the proliferation signal, the cell cycle begins, lasting a time τP, in which mitosis (M) takes place after the S and G2 phases. The daughter cells enter the quiescent state (G0) after the growth phase G1, that lasts a time τG1. Migration proceeds for a time τM after which cells return to the quiescent state.
Cell-state changes from quiescent and proliferative states to hypoxic state occur only in response to a decrease in the availability in oxygen below the threshold, σH For the present avascular model, hypoxic cells eventually die, entering the necrotic state at a rate βH → ∞. The transitions from the quiescent state to proliferative, migratory and apoptotic phenotypes are stochastic and driven by Poisson processes29. By allowing interconversions to transition between any two phenotypic states, it was shown in19 that stochastic state changes promote an equilibrium of phenotypic proportions of cancer cells observed in vivo.
For small time intervals [t, t + Δt], a cell in a quiescent state 𝒬 has the following probability to change to the state 𝒫, ℳ or 𝒜:
| (2.8) |
| (2.9) |
| (2.10) |
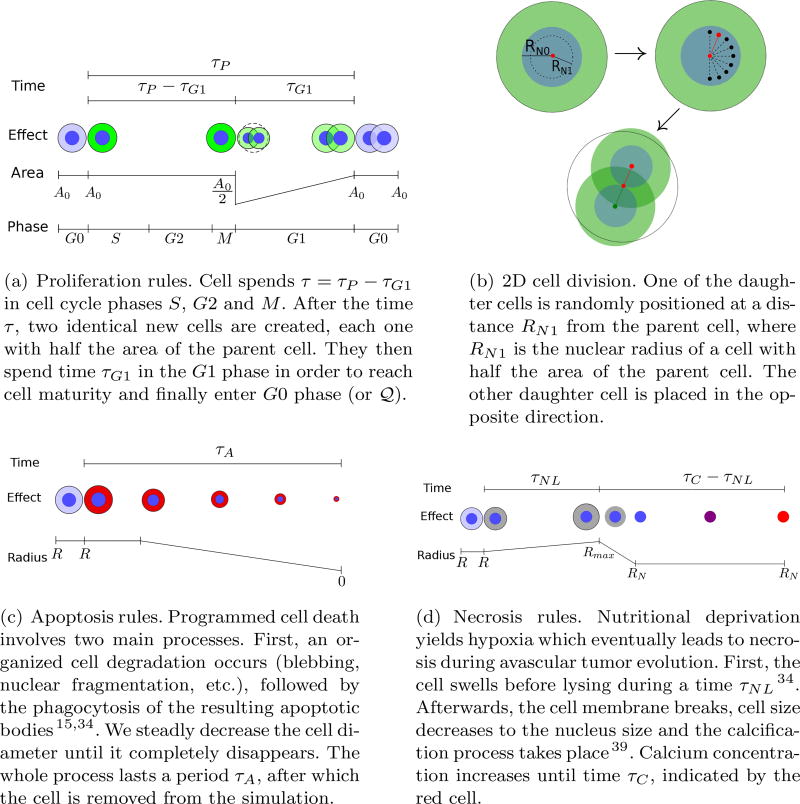
The availability of oxygen in the microenvironment regulates cell migration and proliferation up to the threshold σH, below which the cell does not have enough oxygen to neither undergo mitosis nor migrate. The third term in (2.8) models the influence of compressive stress accumulation on cell proliferation8,40. Recall that we assume that the accumulation of growth-induced stresses within the tumor positively correlates with the number of cells that leave the computational domain, Nout(t), provided K(V, t) ≠ 1. Thus, as Nout(t) grows, the compressive stress increases yielding a negative feedback on the cell proliferation. As Nout(t) increases towards a certain threshold , cell proliferation is increasingly inhibited until eventually preventing cell mitosis. Proliferation and migration advantage is controlled by the cell response to the intracellular biochemical cascade (i.e., the EGFR signaling pathway) through the parameters ᾱP and ᾱM, respectively. These parameters are usually null, except when the cell acquires proliferative or migratory advantage, when they become equal to one. Since we focus on the role of the intra-cellular pathway on cell proliferation and migration, we assume for simplicity that αA is constant. The rules that define the proliferative, necrosis, and apoptosis transitions are given in Figure 7. Once a tumor cell acquires the migratory phenotype, it is kept activated during a time τM after which the cell returns to the quiescent state.
Fig. 7.
Cell transition rules (inspired by Ref. 29) and 2D cell division. The corresponding algorithms are shown in Appendix A.
2.2. The Intracellular Model
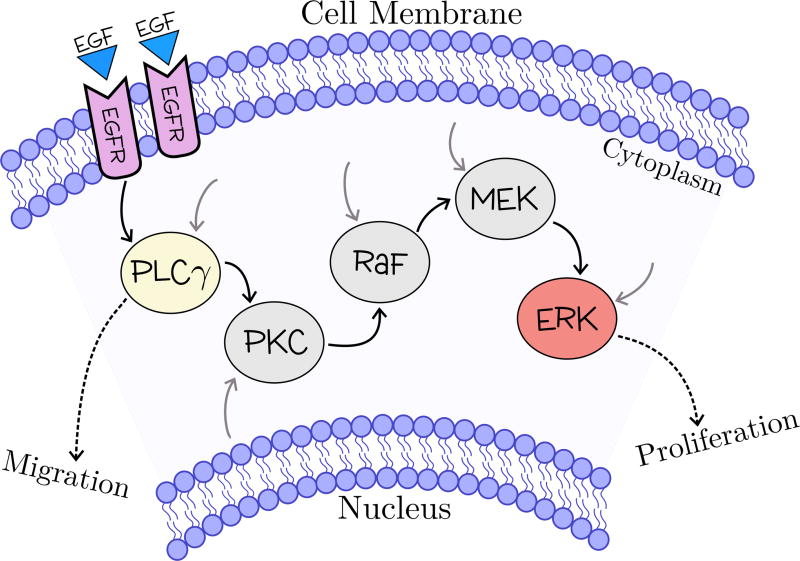
We focus on developing a multiscale framework that integrates a branch of the EGFR signaling pathway. EGF is a mitogen that regulates a variety of cell functions, having a distinguished role on cell proliferation and migration. We consider that EGF is secreted by quiescent cells and diffuses into the microenvironment where it reaches neighboring cells. We also assume that each cell is endowed with the intracellular model presented in Ref. 42, schematically illustrated in Figure 8. The pathway activation begins with the EGF binding to EGF receptors (EGFR), triggering a cascade of interactions involving 20 different molecules, leading to a regulatory response.
Fig. 8.
Schematic illustration of a simplified version of the EGFR signaling pathway, in which only the key molecules included in the model are displayed. The EGF binds to the cell surface EGFR, triggering a biochemical cascade involving key signaling molecules: enzyme PLCγ and protein quinases PKC, Raf, MEK and ERK. The black, grey and dashed arrows indicate the signaling pathway, the cross-talk junctions with other pathways and the biological regulatory response, respectively.
The signaling pathway model is mathematically described by a system of 20 coupled ordinary differential equations. The change in concentration of the ith molecule, Xi, i = 1, …, 20, results from the mass-balance between all reactions producing and consuming Xi42. For example, the reactions of the binding of EGF (X1) to the cell surface receptor EGFR (X2) that produces the complex EGF-EGFR (X3), and the EGF-EGFR dimerization to (EGF-EGFR)2 are respectively given by
in which ki and k−i are the forward and backward rate constants for reaction i defined as
Assuming that these reactions are the only causes of the change in the concentration of X3, we obtain
Likewise, the balance equations describing the production and consumption of the EGFR pathway molecules are described by the system of ODEs presented in Ref. 42. Two key molecules, ERK (extracellular signal-regulated kinase) and PLCγ (phospholipase C-gamma), play crucial roles on regulating proliferation and migration. Migration and proliferation cannot occur simultaneously16. Indeed, it has recently shown that proliferative signaling and activation of migration are organized into two different meta-pathways, requiring distinct cell investment strategies30. Given the thresholds TPLC and TERK, the signaling pathway control process may give a cell an advantage to proliferate or to migrate, according to the rule defined in Table 1. Otherwise, both ᾱP and ᾱM are null.
Table 1.
Downstream response induced by the EGFR signaling pathway; [ERK] and [PLCγ] indicate the concentrations of ERK and PLCγ, respectively.
| Proliferation advantage (ᾱP = 1) | Migration advantage (ᾱM = 1) | ||
|---|---|---|---|
|
|
|
The choice of the decision thresholds, TPLC and TERK, must be calibrated to represent the desired tumor expansion pattern. For a given TPLC, decreasing TERK would lead to a faster growth. However, this behavior may not be smooth, as indicated in Ref. 4, and may depend on other extracellular cues. This is an issue that deserves further investigation.
2.3. Macroscopic models: oxygen and EGF transport
At the macroscopic scale, the constituents of heterogeneous tissues are usually described by a set of scalar fields representing the volume fractions of each constituent. Their evolution is governed by mass balance equations and equations describing mechanical deformation and stress. In the present formulation, only the evolutions of oxygen (σ), and EGF concentrations at the tissue scale are modeled.
To define the tissue-scale model, let Ω denote an open bounded, Lipschitz domain in ℝd with smooth boundary ∂Ω in which living tissue evolves due to the supply of oxygen from the original vascular system. Let the time t be defined in the interval (0, Ttissue], in which Ttissue is the maximum evolution time at the tissue scale. Oxygen dispersion in the tumor microenvironment is much faster than tumor growth dynamics5,17 so it is considered a quasi-stationary process. The oxygen concentration at a point x ∈ Ω at a time t ∈ (0, Ttissue] is governed by a mass conservation condition of the form,
| (2.11) |
in which ∇x is the tissue-level gradient operator, D is the oxygen diffusion coefficient and Λ(x, t) > 0 is the oxygen uptake rate, which depends on averages of sub-scale events. Tumor and healthy cells have different oxygen uptake rates, denoted by λ and λb, respectively. General boundary conditions are
| (2.12) |
with , and n an exterior unit normal vector to ∂Ω2. With these definitions, we assume that an original blood vessel lines the boundary ∂Ω1 and there is no oxygen flux on ∂Ω2.
We assume that EGF is secreted by quiescent cells and diffuses in the microenvironment according to
| (2.13) |
in which DEGF is the EGF diffusion coefficient and FEGF is the autocrine EGF source term. The EGF diffusion coefficient is very small, much smaller than the oxygen diffusion coefficient (DEGF << D), so that the EGF stimulus reaches only neighboring cells, representing the cell-cell and cell-extracellular matrix (juxtacrine/paracrine) communication. We assume that the concentration of EGF in the boundary is zero.
Both Λ and FEGF link the tissue and cell scales. We transfer information between these two scales with the help of two nested square lattices. Let the coarser grid ℳH, with characteristic length H, be used to solve the tissue scale models (2.11) and (2.13). We define an auxiliary and more refined grid ℳh, with characteristic length h such that h = H/N, in which N is an integer and even number. In all experiments performed here, we use N = 10. At each node p of ℳH that lies at xp = (xp, yp), we define a Moore neighborhood of range N/2, denoted by 43. Thus, defines the square-shaped region of ℳh containing the grid points x ∈ {(x, y) : |x − xp| < Nh/2, |y − yp| < Nh/2}. We evaluate Λ(xp, t) and FEGF(xp, t) by upscaling cell data of all cells belonging to through averaging the cell properties. To translate information from the tissue scale to cell scale, we first identify the location of each cell with respect to the partition of ℳH. Then, given the four nodes of ℳH surrounding each cell, we linearly interpolate the oxygen and EGF concentrations at these nodes to the cell position.
3. Simulations
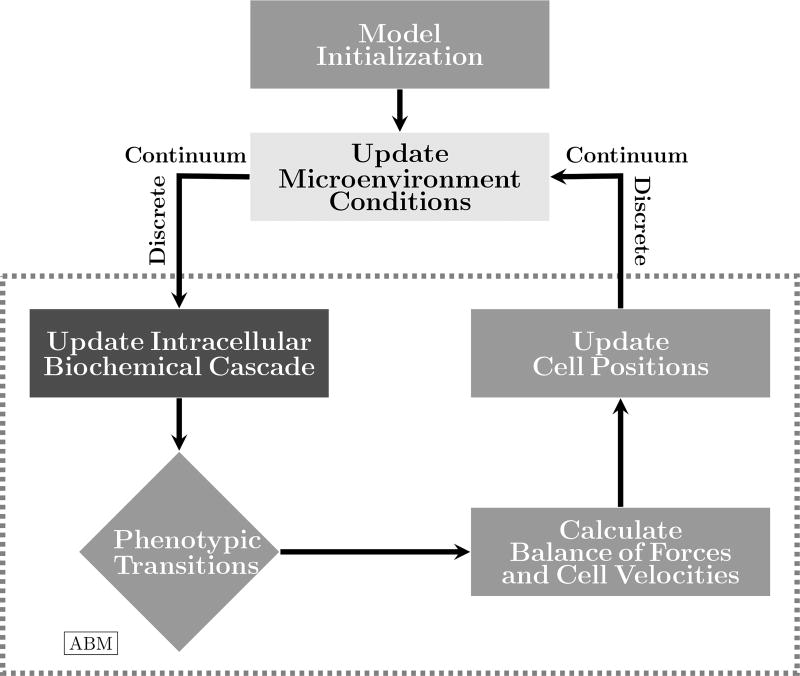
We investigate the behavior of the multiscale model, and, in particular, the effects of EGF dispersion and intracellular control on tumor growth. The solution process of the hybrid model is schematically shown in Figure 9. After initializing the ABM, the oxygen and EGF concentrations are updated and translated to each tumor cell afterwards. The signaling pathway model is solved for each cell in accordance with external cues. The cell model performs phenotypic transitions, if needed, and updates the ongoing apoptosis, necrosis, migration, and proliferation processes. The balance of forces is carried out for every cell (which is the more computationally expensive part of the model), yielding updated cell velocities and positions. Then, new representative values of oxygen uptake rate and EGF production are translated back to each macroscopic grid point, yielding a new configuration of oxygen and EGF dispersion. The time evolution continues until the end of the predetermined length of time is reached. All these modules are implemented in C++. The partial differential equations are solved using a finite difference model (central differences) and the signaling pathway model is solved using a fourth-order Runge-Kutta method.
Fig. 9.
Schematic representation of the model solution process. Given an initial configuration of the ABM, the microenvironment conditions are updated by solving the reaction-diffusion models. Oxygen and EGF concentrations are translated to the cell scale, and the intracellular model is solved to determine whether each cell has achieved a proliferation or migration advantage. Phenotypic transitions are carried out according to the ABM rules. Cell forces are updated and their balances lead to new cell positions. Cell attributes are translated back to the tissue scale, completing the time-step evolution.
In all numerical experiments, we consider normal cells randomly placed in a circular tissue substrate of radius equal to 250 µm, with two proliferative and two quiescent cells at the center. The computational domain for the (continuum) macroscale tissue environment is quadrangular with side 500 µm. We assume that there is a basal vasculature at the boundary providing a constant source of oxygen (∂Ω ≡ ∂Ω1). Since EGF is assumed to be released by quiescent cells, its concentration vanishes on the boundary where there are only healthy cells. We use the notation depicted in Figure 10 to display cell differentiation obtained with the ABM. Model parameters are defined in Tables 2–4. We use the ABM parameters defined in Ref. 29. For the signal transduction pathway, the parameters were extracted from Ref. 42. In all the following experiments we solve the partial differential equations on a regular grid with 50 divisions in each direction (H = 10µm), and time step Δt = 1 h.
Fig. 10.
Notation used in the simulations. Healthy cells are denoted by 𝒩ormal, and tumor cells are differentiated by phenotype: quiescent (𝒬), proliferative (𝒫), migrating (ℳ), apoptotic (𝒜), early stages of necrosis (𝒩) and three increasingly higher levels of calcification.
Table 2.
Model parameters.
| Parameter | Meaning | Value | Ref. | |
|---|---|---|---|---|
| R, RN | cell radius and cell nuclear radius | 9.953 e 5.295 µm | 29 | |
| RA | action radius | 1.214R | 29 | |
| cccr | cell-cell repulsion coefficient | 5η µm/min | estimated | |
| γ | cell-cell adhesion scale | 0.0488836 | 29 | |
|
|
maximum number of cells that leave the domain | 1500 | estimated | |
| σB | oxygen concentration at the boundary | 0.6 | estimated | |
| σH | hypoxic threshold | 0.2 | 29 | |
| αA | 𝒬 → 𝒜 transition intensity | 0.0012728 h−1 | 29 | |
| τP | cell cycle time | 18 h | 29 | |
| τG1 | G1 cell cycle phase time | 9 h | 29 | |
| τA | apoptosis time | 8.6 h | 29 | |
| τNL | lysing time | 6 h | 29 | |
| τC | necrosis time | 360 h | 29 | |
| τM | maximum motility time | 1 h | estimated | |
| χ | haptotaxis coefficient | 25η µm/min | estimated | |
| D | oxygen diffusion coefficient | 1000 µm2/h | 29 | |
| λ | oxygen uptake rate of tumor cells | 0.1 min−1 | 29 | |
| λb | oxygen uptake rate of healthy cells | 0.01λ | 29 | |
| Degf | EGF diffusion coefficient | 1 × 10⁻¹² µm2/h | estimated | |
| Fegf | EGF concentration secreted by quiescent cells | 2.65 nM/s | 42 | |
| TPLC | threshold for proliferation advantage | −1 × 10⁻⁴ nM/s | estimated | |
| TERK | threshold for migration advantage | 1.2 × 10⁻⁵ nM/s | estimated |
Table 4.
Reaction and parameter definitions. Concentrations and the Michaelis-Menten constants (K) are given in [nM]. First- and second-order rates are given in [s−1] and [nM−1s−1], respectively, and V are given in [nMs−1]. (Extracted from42.)
| Reaction | Equation | Kinetic parameters | Ref. | |
|---|---|---|---|---|
| υ1 | k1X1X2 − k−1X3 | k1 = 0.003 | k−1 = 0.06 | 24 |
| υ2 | k2X3X3 − k−2X4 | k2 = 0.01 | k−2 = 0.1 | 24 |
| υ3 | k3X4 − k−3X5 | k3 = 1 | k−3 = 0.01 | 24 |
| υ4 | V4X5/(K4+ X5) | V4 = 450 | K4 = 50 | 24 |
| υ5 | k5X5X6 − k−5X7 | k5 = 0.06 | k−5 = 0.2 | 24 |
| υ6 | k6X7 − k−6X8 | k6 = 1 | k−6 = 0.05 | 24 |
| υ7 | k7X8 − k−7X5X9 | k7 = 0.3 | k−7 = 0.006 | 24 |
| υ8 | V8X9/(K8+ X9) | V8 = 1 | K8 = 100 | 24 |
| υ9 | k9X9 − k−9X10 | k9 = 1 | k−9 = 0.03 | 24 |
| υ10 | k10X9X11 − k−10X12 | k10 = 0.214 | k−10 = 5.25 | 42 |
| υ11 | V11X12X13/(K11+ X13) | V11 = 4 | K11 = 64 | 42 |
| υ12 | V12X14X15/[K12(1 + X16/K14) + X15] | V12 = 3.5 | K12 = 317 | 42 |
| υ13 | V13X16/[K13(1 + X17/K15) + X16] | V13 = 0.058 | K13 = 2200 | 38 |
| υ14 | V14X14X16/[K14(1 + X15/K12) + X16] | V14 = 2.9 | K14 = 317 | 38 |
| υ15 | V15X17/[K15(1 + X16/K13) + X17] | V15 = 0.058 | K15 = 60 | 38 |
| υ16 | V16X17X18/[K16(1 + X19/K18) + X18] | V16 = 9.5 | K16 = 1.46105 | 38 |
| υ17 | V17X19/[K17(1 + X20/K19) + X19] | V17 = 0.3 | K17 = 160 | 38 |
| υ18 | V18X17X19/[K18(1 + X18/K16) + X19] | V18 = 16 | K18 = 1.46105 | 38 |
| υ19 | V19X20/[K19(1 + X19/K17) + X20] | V19 = 0.27 | K19 = 60 | 38 |
To investigate the effects of the intracellular phenotypic and proliferation inhibition (due to the accumulation of compressive stresses) on the spatiotemporal development of the tumor, we designed three numerical experiments:
- Experiment 1: Cells may acquire a proliferation advantage and there is no proliferation inhibition due to accumulation of compressive stresses inside the tumor. Mathematically, these assumptions affect the ability to change its state in the following manner:
- Experiment 2: Cells may acquire a proliferation advantage, which is inhibited due to accumulation of compressive stresses inside the tumor. These assumptions amount to set
- Experiment 3: Cells may acquire a proliferation or migration advantage, and proliferation is inhibited due to accumulation of compressive stresses inside the tumor, yielding
In all experiments, we perform 100 realizations using the initial conditions shown in Figure 11, which represent a small tumor in the center of the domain. As experiment 3 requires the definition of the ECM density, we assume that f ∈ 𝒰[0, 5; 1] is the non-dimensional ECM density.
Fig. 11.
Initial condition: (left) normal cells randomly placed, and four tumor cells at the center (two proliferative and two quiescent cells); (center) uniform oxygen field; (right) EGF released by the quiescent cells.
3.1. Experiment 1
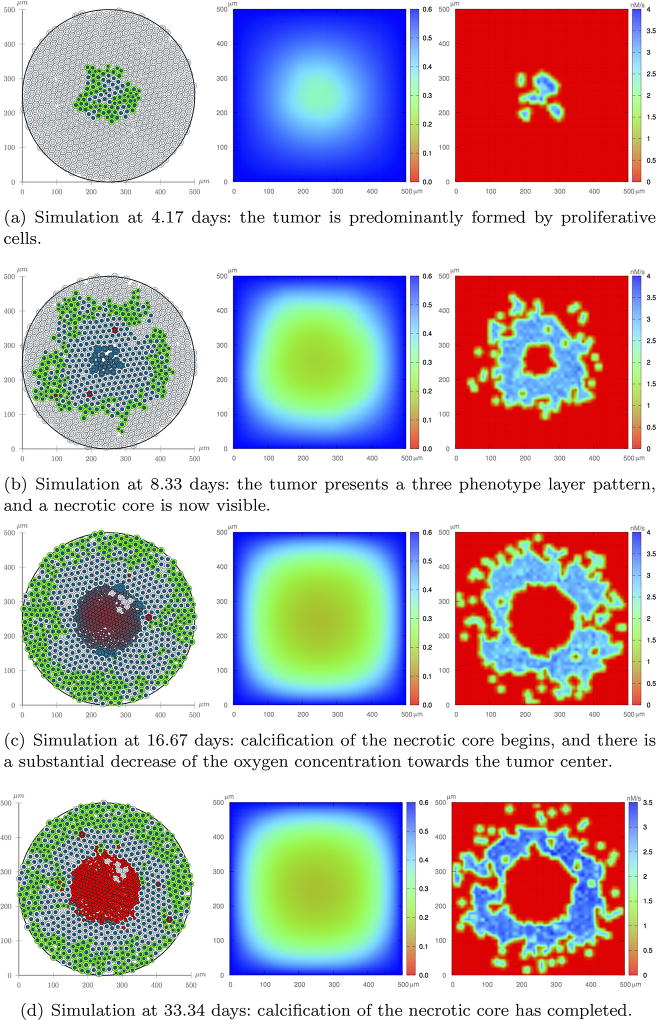
Figure 12 shows one realization of the tumor evolution without feedback from the microenvironment stresses. Beginning with a small tumor at the center of the tissue substrate and a uniform oxygen distribution, the tumor develops and gradually uptakes the available oxygen. At t = 4.17 days, the tumor is mainly composed of proliferative cells, which represents the early stages of an avascular tumor. The high growth rates yield a rapid decrease of the oxygen concentration towards the tumor center, where the oxygen level is not sufficient to maintain cell viability. At t = 8.33 days, a necrotic core begins to develops so that a three layer phenotype pattern is formed: an internal region representing the necrotic core, surrounded by quiescent cells, and a proliferative external rim18. Because the EGF released by quiescent cells is transported by a small diffusion coefficient, it only reaches neighboring cells. At t = 16.67 days, tumor cells occupy the whole domain, and a calcified necrotic core is visible. At t = 33.34 days, the red core indicates that the calcification process has completed.
Fig. 12.
Experiment 1: One realization of the ABM model (left column), oxygen dispersion (middle column), and EGF dispersion (right column). Cells are subject to pathway proliferation control and no negative feedback from compressive stress accumulation due to growth.
3.2. Experiment 2
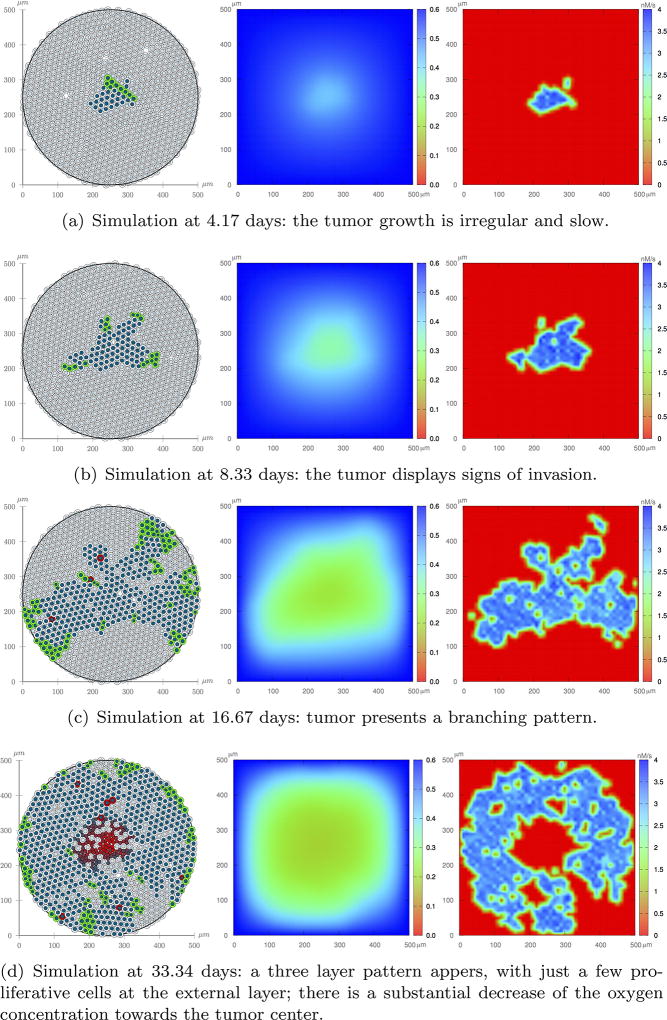
Figure 13 shows one realization of the tumor evolution with feedback from the microenvironment stresses. The negative feedback has a strong impact on tumor development. In particular, by comparing Figures 12 and 13 it is readily apparent that the growth is much slower and more heterogeneous as areas that experience an accumulation of stress have a reduction in proliferation. This negative feedback ultimately disrupts the rounded tumor growth pattern, so that at 8.33 days the tumor displays signs of invasion, which can be viewed as a strategy to increase oxygen contact area. However, as the tumor grows, a more intense negative feedback on the proliferation may eventually prevent growth, which has been observed experimentally37,40. At t = 33.34 days, there are just a few proliferative cells in the domain and the tumor morphology still shows some branching.
Fig. 13.
Experiment 2: One realization of the ABM model (left column), oxygen dispersion (middle column), and EGF dispersion (right column). Cells subject to the pathway proliferation control and negative feedback from compressive stress accumulation due to growth.
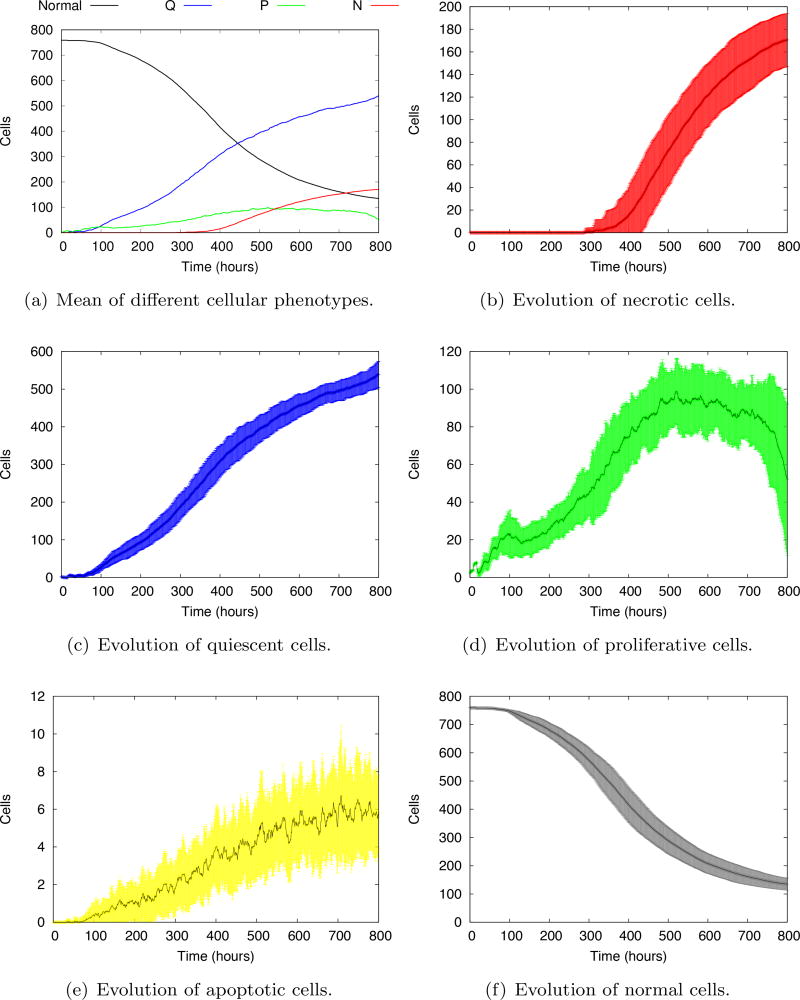
Figure 14a shows the evolution of the mean of all tumor phenotypes after 100 model realizations. In general, as the tumor cells multiply, they take the place of the normal cells. The number of proliferative cells reaches a plateau and decreases at the end of the simulation. With the decrease of oxygen concentration, the necrotic core appears around 350 h and grows slowly, eventually overcoming the number of proliferative cells in less than 200 h. The evolution of individual phenotypes are shown in Figure 14b–f. The evolution of necrotic, quiescent and normal cells show quite regular standard deviations. The stochastic transitions to proliferative and apoptotic states give rise to a high variability of the evolution, which steadily grows in time. The decrease of the number of proliferative cells at the end of the simulation is more visible in Figure 14d, showing a sharp tendency towards growth arrest, typical of avascular tumors.
Fig. 14.
Evolution of the mean of individual cell phenotypes. 𝒩, 𝒬, 𝒫 and ℋ stand for the number of cells in the necrotic, quiescent, proliferative and healthy phenotypes, respectively. The shaded areas represent the standard deviations at each evolution time.
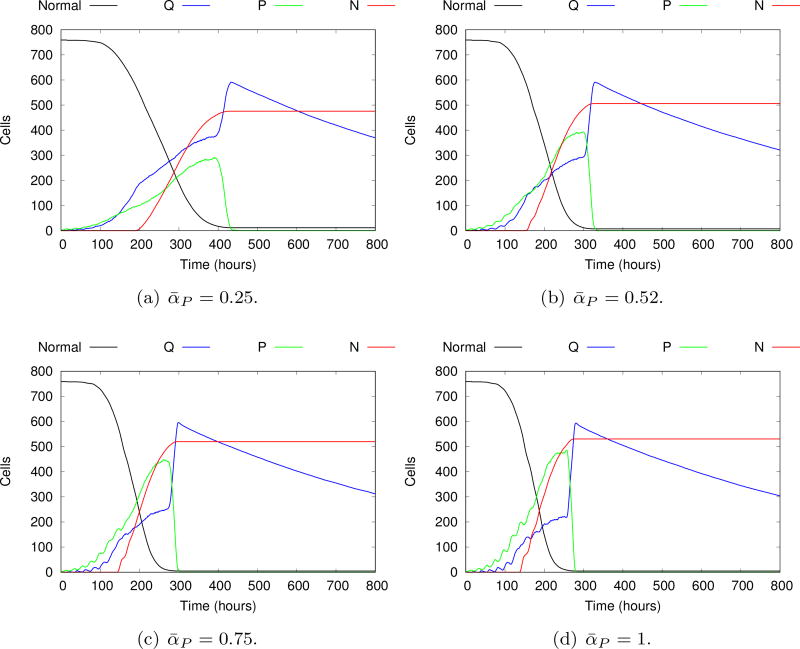
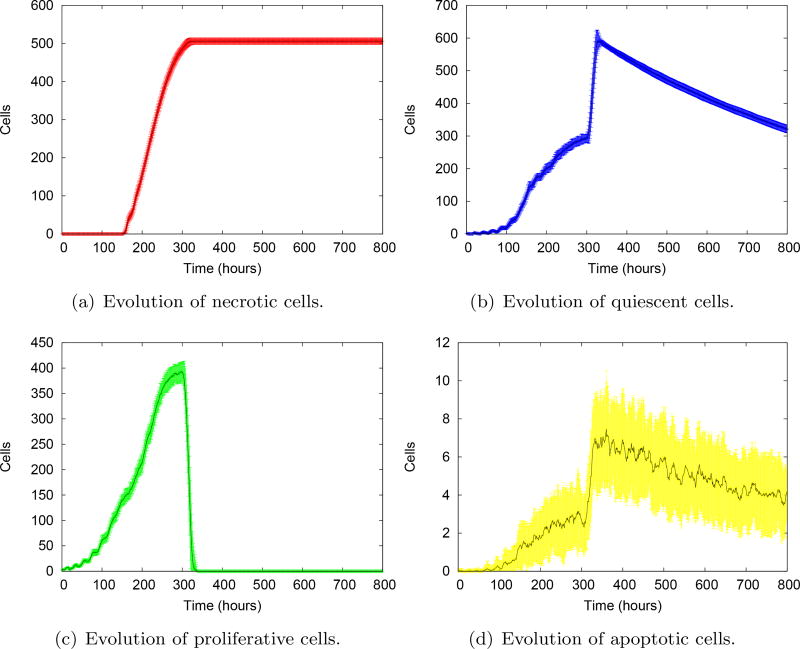
In Figure 15 we compare the evolution of the mean of the cellular phenotypes obtained by fixing ᾱP at four different values (0.25; 0.52; 0.75; 1.0), i.e., without considering any proliferation advantage/disadvantage provided by the intracellular model. Higher ᾱP yields a higher maximum mean value of proliferative cells, as expected. In all cases, the number of proliferative cells eventually vanishes, characterizing the growth arrest. The higher peak of proliferative cells obtained with ᾱP = 1 yields a faster growth arrest and a slightly larger necrotic core. Overall, the evolution pattern obtained without the intracellular control is qualitatively similar, with a stable necrotic core and no proliferative cells (growth arrest) after 500h. In particular, Figure 16 shows a detailed evolution of necrotic, quiescent, proliferative and apoptotic cells for ᾱP = 0.52 using 100 realizations, together with the corresponding standard deviations. By comparing with Figure 14, it is remarkable that the proliferation advantage introduced by the signaling pathway also yields a higher variance of the number of proliferative cells. This ultimately leads to a more irregular and heterogeneous tumor evolution branching pattern, keeping the three layer structure typical of avascular tumors, as displayed in Figure 13.
Fig. 15.
Evolution of the mean of individual phenotypes without considering the signaling pathway, and setting ᾱP to different values. Although the general behavior is quite similar, some differences in the growth dynamics are visible. Higher ᾱP values lead to faster and greater growth of proliferative cells. As the availability of oxygen is limited, a greater number of proliferative cells cause a faster consumption of the oxygen supply, leading to faster stagnation of tumor growth.
Fig. 16.
Evolution of the mean of individual cell phenotypes for ᾱP = 0.52. The shaded areas represent the standard deviations at each evolution time. These variabilities are remarkably smaller than those that emerge from the intracellular control (see Figure 14).
3.3. Experiment 3
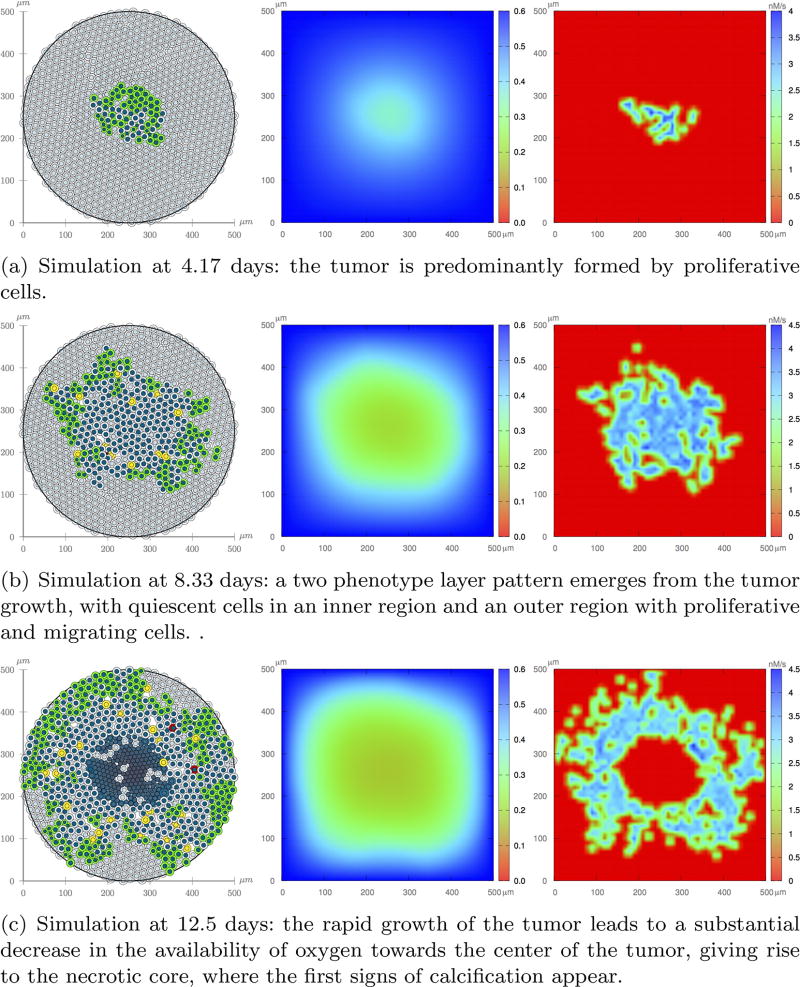
Figure 17 shows one realization of the tumor evolution at t = 4.17, 8.33, and 12.5 days, in which tumor cells may acquire a proliferation or migration advantage, and are subject to the proliferation negative feedback from the microenvironment stresses. As the tumor grows, it gradually consumes the oxygen available in the microenvironment, and EGF dispersion is restricted to the vicinity of the cells that release the growth factor. At t = 8.33 days, a two layer pattern emerges: an inner region of quiescent cells and an outer layer where most cells are proliferative (green) and migratory (yellow). The migration process favors a high mobility tumor expansion. At t = 12.5 days the oxygen concentration towards the center of the domain is not enough to sustain cell viability so that the necrotic core emerges. Eventually, necrotic cells undergo calcification. The simulation is halted at this time since the tumor mass now occupies the whole domain. Comparing with Experiment 2, tumor growth is much faster, its growth pattern is more rounded, and the tumor mass is also interleaved with normal cells. Overall, the migration process has a substantial impact on tumor invasiveness and shape.
Fig. 17.
Experiment 3: One realization of the ABM model (left column), oxygen dispersion (middle column), and EGF dispersion (right column). Cells are subject to the pathway control and negative proliferation feedback from compressive stress accumulation due to growth.
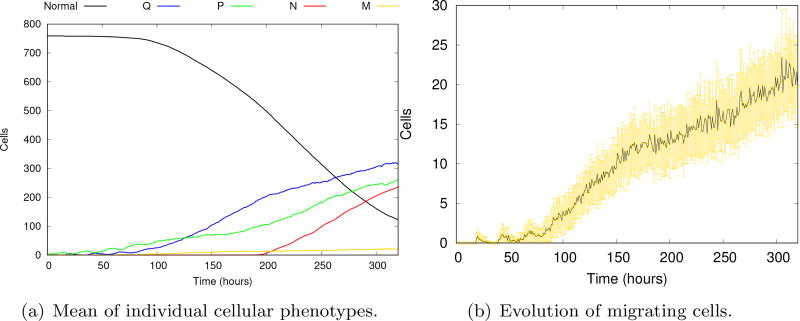
Figure 18 shows the evolution of the mean of all individual tumor phenotypes and of the migrating cells after 100 model realizations. Comparing Figures 14a and 18a, we notice that the absence of the migration process yields a longer tumor growth. Even in small quantities, the number of migrating cells grows steadily, speeding up the tumor growth which eventually halts due to the lack of additional oxygen source.
Fig. 18.
Evolution of individual cell phenotypes (a). The vertical axis display the number of cells in the normal, quiescent (Q), proliferative (P) and necrotic (N) phenotypes. The details of the evolution of the mean of the number of migrating cells and corresponding standard deviations at each evolution time (b). Although the number of migratory cells is small, the tumor dynamics are greatly accelerated.
4. Conclusions
We have developed a hybrid three-scale avascular tumor growth model which integrates phenomena occurring at the tissue, cell and intracellular scales. We model each spatial scale with different mathematical/computational formalism yielding a modular framework in which each module can be easily exchanged or expanded. With this approach we are able to track how cells process microenvironment stimuli and produce regulatory responses, which eventually give rise to a more heterogeneous tumor expansion.
At the cellular level, the agent-based model describes cell mobility, mitosis, apoptosis, necrosis, cell-cell adhesion and repulsion, cell compression due to growth, and cell contact with surrounding microenvironment. At the tissue scale, oxygen and epidermal growth factor concentration are modeled through reaction-diffusion equations. Those microenvironment stimuli are translated to cell scale, driving a variety of phenomena that ultimately regulate cell phenotypes and tumor expansion. A specific sub-cell model is introduced to regulate cell proliferation or migration advantage. The EGFR signaling pathway describes a cascade of biochemical reactions, which is modeled by a system of ordinary equations. Solution of these equations defines the decision process that confers (or does not) the proliferation or migration advantage to the cell. Thus, the final regulation of the proliferative phenotype depends on the intracellular driven proliferation advantage, and the inhibition due to both nutritional stress and cell compression. Likewise, the migrating phenotype results from the integration of the intracellular driven migration advantage and the nutritional stress.
Simulations have shown that the inhibition of proliferation due to the accumulation of growth-induced compressive stresses within the tumor may give rise to a branching tumor growth morphology, with fingers appearing at the earliest stages of the tumor expansion. Likewise, the integration of the EGFR signaling pathway to drive cell proliferation or migration advantages provides a substantial change on the overall phenotypic heterogeneity of the tumor. In this way, the developed hybrid framework that integrates intracellular, cellular, and tissue scales is able to produce a rich variety of tumor behaviors.
We believe that our multiscale model is a start and fundamental platform that will allow to investigate a variety of cancer mechanisms occurring at molecular, cell or tissue level as well as potential target specific therapies and their effects through other pathways. There are many avenues of investigation to this end. Among them we highlight the calibration and validation of the present multiscale avascular model by integrating in vivo and in vitro experiments for a selected type of cancer. To test different in silico scenarios, the present model could be extended to integrate angiogenesis, extracellular matrix heterogeneity, stem cells, explicit mechanical deformation, metabolic networks and other signaling pathways, among other features recognized to play important roles in tumor expansion.
There is a clear need for reliable quantitative methods that can predict and assess the response of tumors to therapy44,45, and to do so with great sensitivity and specificity, earlier in clinical follow-up; such an approach would have profound implications for diagnosis, therapy, and prognosis. We believe that the present effort is a step towards enhancing computational and mathematical model framework with the potential to unfold complex multiscale phenomena in cancer.
Fig. 4.
Cell-cell adhesion and repulsion are represented by pairwise forces and , respectively. Tumor growth gives rise to compression and resistance to compression forces ( and , respectively), and all moving cells undergo a drag force of interstitial fluid flow (Fd). ECM heterogeneity may yield haptotaxis to migrating cells (Fhap). This approach is inspired by Ref. 29.
Table 3.
Kinetic equations and initial conditions (extracted from42). Reaction and parameter definitions are given in Table 4.
| Reactant | Molecule | Initial condition | kinetic equation |
|---|---|---|---|
| X1 | EGF | tissue scale PDE | d(X1)/dt = −υ1 |
| X2 | EGFR | 80 | d(X2)/dt = −υ1 |
| X3 | EGF-EGFR | 0 | d(X3)/dt = υ1 − 2υ2 |
| X4 | (EGF-EGFR)2 | 0 | d(X4)/dt = υ2 + υ4 − υ3 |
| X5 | EGF-EGFR-P | 0 | d(X5)/dt = υ3 + υ7 − υ4 − υ5 |
| X6 | PLCγ | 10 | d(X6)/dt = υ8 − υ5 |
| X7 | EGF-EGFR-PLCγ | 0 | d(X7)/dt = υ5 − υ6 |
| X8 | EGF-EGFR-PLCγ-P | 0 | d(X8)/dt = υ6 − υ7 |
| X9 | PLCγ-P | 0 | d(X9)/dt = υ7 − υ8 − υ9 − υ10 |
| X10 | PLCγ-P-I | 0 | d(X10)/dt = υ9 |
| X11 | PKC | 10 | d(X11)/dt = −υ10 |
| X12 | PKC* | 0 | d(X12)/dt = υ10 − υ11 |
| X13 | Raf | 100 | d(X13)/dt = −υ11 |
| X14 | Raf* | 0 | d(X14)/dt = υ11 − υ12 − υ14 |
| X15 | MEK | 120 | d(X15)/dt = υ13 − υ12 |
| X16 | MEK-P | 0 | d(X16)/dt = υ12 + υ15 − υ13 − υ14 |
| X17 | MEK-PP | 0 | d(X17)/dt = υ14 − υ15 − υ16 − υ18 |
| X18 | ERK | 100 | d(X18)/dt = υ17 − υ16 |
| X19 | ERK-P | 0 | d(X19)/dt = υ16 + υ19 − υ17 − υ18 |
| X20 | ERK-PP | 0 | d(X20)/dt = υ18 − υ19 |
Acknowledgments
Rocha, Resende and Almeida acknowledge the support of The Coordination for the Improvement of Higher Education Personnel - CAPES and of The Brazilian Council for Scientific and Technological Development - CNPq (132591/2014-6 and 305612/2013-1). Oden and Lima acknowledge support of their work by the National Science Foundation under grant DMS 1115865. The authors thank the Center Prevention Research Institute of Texas (CPRIT) for funding through RR160005 and the National Cancer Institute for funding through U01CA174706 and R01CA186193.
Appendix A
ABM algorithms
Algorithm 1.
Cell Apoptosis
| Input: i, , τA | |
| Result: Update of cellular apoptosis | |
| if t > τA/2 then | |
|
|
# decreasing cell area; |
| end if | |
| if t = τA then | |
|
|
Cell is removed from the simulation; |
| end if | |
Algorithm 2.
Force balance, cellular velocity and position
| Result Update cell positions | ||||
| while t ≤ 60 min do | ||||
|
|
for i = 1 to N(t) do | |||
|
|
for j = 1 to N(t) do | |||
|
|
if i = j then | |||
|
|
continue; | |||
| end if | ||||
|
| ||||
|
| ||||
|
| ||||
| end for | ||||
|
| ||||
|
| ||||
|
| ||||
|
| ||||
| end for | ||||
| for i = 1 to N(t) do | ||||
|
|
υi ← Fi; | |||
| end for | ||||
| ; | ||||
| for i = 1 to N(t) do | ||||
|
|
xi ← xi + υi · Δt; | |||
| end for | ||||
| t ← t + Δt | ||||
| end while | ||||
Algorithm 3.
Cell Necrosis
| Input i, (cell nucleus area), τNL, τC | |
| Result Update of cellular necrosis | |
| if t < τNL then | |
|
|
# cell swelling; |
| end if | |
| if t = τNL then | |
|
|
# cell lysing; |
| end if | |
| if t > τNL and t ≤ τC then | |
|
|
# cell calcification; |
| end if | |
| if t > τC then | |
|
|
C = 1; |
| end if | |
Algorithm 4.
Cell Mitosis
| Input: i, , xi, , τP, τG1 | |
| Result: Update cellular mitosis | |
| if t = (τP − τG1) then | |
|
|
# daughter cells have half area of the parent cell; |
| ; | |
| Sample a vector V centered on xi and modulus | |
| xi ← xi + V; | |
| xk ← xi − V; | |
| Si ← G1 # daughter cells enter G1 cell-cycle phase; | |
| Sk ← G1; | |
| end if | |
| if Si = G1 e t ≤ τP then | |
|
|
; |
| end if | |
| if Si = G1 e t = τP then | |
|
|
Si ← 𝒬 # cell enter G0 cell-cycle phase; |
| end if | |
References
- 1.Anderson ARA. A hybrid multiscale model of solid tumour growth and invasion: evolution and the microenvironment. chapter I.1. Birkháuser; 2007. pp. 3–28. [Google Scholar]
- 2.Anderson Alexander RA, Chaplain Mark AJ, Rejniak Katarzyna A. Single-cell-based models in biology and medicine. Birkhäuser Verlag AG; 2007. [Google Scholar]
- 3.Athale Chaitanya, Deisboeck Thomas S. The effects of egf-receptor density on multiscale tumor growth patterns. Journal of Theoretical Biology. 2006;238:771–779. doi: 10.1016/j.jtbi.2005.06.029. [DOI] [PubMed] [Google Scholar]
- 4.Athale Chaitanya, Mansury Yuri, Deisboeck Thomas S. Simulating the impact of a molecular “decision-process” on cellular phenotype and multicellular patterns in brain tumors. Journal of Theoretical Biology. 2005;233:469–481. doi: 10.1016/j.jtbi.2004.10.019. [DOI] [PubMed] [Google Scholar]
- 5.Byrne HM. Mathematics and Life Sciences. chapter 12. University of Oxford; 2012. pp. 279–312. [Google Scholar]
- 6.Byrne HM, Drasdo D. Individual-based and continuum models of growing cell populations: a comparison. Journal of Mathematical Biology. 2009;58:657–687. doi: 10.1007/s00285-008-0212-0. [DOI] [PubMed] [Google Scholar]
- 7.Chakrabarti A, Verbridge S, Stroock AD, Fischbach C, Varner JD. Multiscale models of breast cancer progression. Annals of Biomedical Engineering. 2012;40(11):2488–2500. doi: 10.1007/s10439-012-0655-8. [DOI] [PMC free article] [PubMed] [Google Scholar]
- 8.Cheng G, Tse J, Jain RK, Munn LL. Micro-environmental mechanical stress controls tumor spheroid size and morphology by suppressing proliferation and inducing apoptosis in cancer cells. PLoS ONE. 2009;4(2):e4632. doi: 10.1371/journal.pone.0004632. [DOI] [PMC free article] [PubMed] [Google Scholar]
- 9.D’Antonio G, Macklin P, Preziosi L. An agent-based model for elastoplastic mechanical interactions between cells, basement membrane and extracellular matrix. Mathematical Biosciences and Engineering. 2012;10:75–101. doi: 10.3934/mbe.2013.10.75. [DOI] [PMC free article] [PubMed] [Google Scholar]
- 10.Deisboeck TS, Stamatakos GS. Multiscale Cancer Modeling. CRC Press; 2011. [DOI] [PMC free article] [PubMed] [Google Scholar]
- 11.Deisboeck TS, Wang Z, Macklin P, Cristini V. Multiscale cancer modeling. Annual Review of Biomedical Engineering. 2011;13:127–155. doi: 10.1146/annurev-bioeng-071910-124729. [DOI] [PMC free article] [PubMed] [Google Scholar]
- 12.Drasdo D, Höhme S. A single-cell-based model of tumor growth in vitro: monolayers and spheroids. Physical Biology. 2005;2:133–147. doi: 10.1088/1478-3975/2/3/001. [DOI] [PubMed] [Google Scholar]
- 13.Drasdo D, Kree R, McCaskill JS. Monte Carlo approach to tissue-cell populations. Physical Review E. 1995;52(6):6635–6657. doi: 10.1103/physreve.52.6635. [DOI] [PubMed] [Google Scholar]
- 14.Edelman Lucas B, Eddy James A, Price Nathan D. In silico models of cancer. Wiley Interdisciplinary Reviews. Systems Biology and Medicine. 2010;2(4):438–459. doi: 10.1002/wsbm.75. [DOI] [PMC free article] [PubMed] [Google Scholar]
- 15.Elmore Susan. Apoptosis: A review of programmed cell death. Journal of Toxicologic Pathology. 2007;35(4):495–516. doi: 10.1080/01926230701320337. [DOI] [PMC free article] [PubMed] [Google Scholar]
- 16.Giese A, Loo MA, Tran N, Haskett D, Coons SW, Berens ME. Dichotomy of astrocytoma migration and proliferation. International Journal of Cancer. 1996;67(2):275–282. doi: 10.1002/(SICI)1097-0215(19960717)67:2<275::AID-IJC20>3.0.CO;2-9. [DOI] [PubMed] [Google Scholar]
- 17.Greenspan HP. Models for the Growth of a Solid Tumour by Diffusion. Studies in Applied Mathematics. 1972;52(4):317–340. [Google Scholar]
- 18.Grimes David Robert, Kelly Catherine, Bloch Katarzyna, Partridge Mike. A method for estimating the oxygen consumption rate in multicellular tumour spheroids. Journal of The Royal Society Interface. 2014;11(92):20131124. doi: 10.1098/rsif.2013.1124. [DOI] [PMC free article] [PubMed] [Google Scholar]
- 19.Gupta Piyush B, Fillmore Christine M, Jiang Guozhi, Shapira Sagi D, Tao Kai, Kuperwasser Charlotte, Lander Eric S. Stochastic state transitions give rise to phenotypic equilibrium in populations of cancer cells. Cell. 2011;146:633–644. doi: 10.1016/j.cell.2011.07.026. [DOI] [PubMed] [Google Scholar]
- 20.Hanahan D, Weinberg R. Hallmarks of Cancer: The Next Generation. Cell. 2011;144:646–674. doi: 10.1016/j.cell.2011.02.013. [DOI] [PubMed] [Google Scholar]
- 21.Hanahan Douglas, Weinberg Robert A. The hallmarks of cancer. Cell. 2000;100(1):57–70. doi: 10.1016/s0092-8674(00)81683-9. [DOI] [PubMed] [Google Scholar]
- 22.Hatzikirou Haralampos, Chauviere Arnaud, Baue Amy L, Leier André, Lewis Michael T, Macklin Paul, Marquez-Lago Tatiana T, Bearer Elaine L, Cristini Vittorio. Integrative Physical Oncology. Wiley Interdisciplinary Reviews. Systems Biology and Medicine. 2012;4:1–14. doi: 10.1002/wsbm.158. [DOI] [PMC free article] [PubMed] [Google Scholar]
- 23.Helmlinger G, Netti PA, Lichtenbeld HC, Melder RJ, Jain RK. Solid stress inhibits the growth of multicellular tumor spheroids. Nature Biotechnology. 1997;15:778–783. doi: 10.1038/nbt0897-778. [DOI] [PubMed] [Google Scholar]
- 24.Kholodenko BN, Demin OV, Moehren G, Hoek JB. Quantification of short term signaling by the epidermal growth factor receptor. Journal of Biological Chemistry. 1999;274:30169–30181. doi: 10.1074/jbc.274.42.30169. [DOI] [PubMed] [Google Scholar]
- 25.Kholodenko BN, Hancock JF, Kolch W. Signalling ballet in space and time. Nature Reviews Molecular Cell Biology. 2010;11:414–426. doi: 10.1038/nrm2901. [DOI] [PMC free article] [PubMed] [Google Scholar]
- 26.Li Xiangfang L, Oduola Wasiu O, Qian Lijun, Dougherty Edward R. Integrating multiscale modeling with drug effects for cancer treatment. Cancer Informaticics. 2015;14(S5):21–31. doi: 10.4137/CIN.S30797. [DOI] [PMC free article] [PubMed] [Google Scholar]
- 27.Macklin P, Edgerton ME. Agent-based cell modelling: application to breast cancer. In: Cristini V, Lowengrub JS, editors. Multiscale Modeling of Cancer. chapter 10. Cambridge University Press; 2010. pp. 216–287. [Google Scholar]
- 28.Macklin P, Edgerton ME. Discrete cell modeling. In: Cristini V, Lowengrub JS, editors. Multiscale Modeling of Cancer. chapter 4. Cambridge University Press; 2010. pp. 88–122. [Google Scholar]
- 29.Macklin P, Edgerton ME, Thompson AM, Cristini V. Patient-calibrated agent-based modelling of ductal carcinoma in situ (DCIS): From microscopic measurements to macroscopic predictions of clinical progression. Journal of Theoretical Biology. 2012;301:122–140. doi: 10.1016/j.jtbi.2012.02.002. [DOI] [PMC free article] [PubMed] [Google Scholar]
- 30.Markert Elke K, Levine Arnold J, Vazquez Alexei. Proliferation and tissue remodeling in cancer: the hallmarks revisited. Cell Death and Disease. 2012;3:e397. doi: 10.1038/cddis.2012.140. [DOI] [PMC free article] [PubMed] [Google Scholar]
- 31.Naumov L, Hoekstra A, Sloot P. Cellular automata models of tumour natural shrinkage. Physica A. Statistical Mechanics and its Applications. 2011;390:2283–2290. [Google Scholar]
- 32.Naumov L, Hoekstra A, Sloot P. The inuence of mitoses rate on growth dynamics of a cellular automata model of tumour growth. Procedia Computer Science. 2012;1:971–978. [Google Scholar]
- 33.Oden JT, Lima EABF, Almeida RC, Feng Y, Rylander MN, Fluentes D, Faghihi D, Rahman MM, DeWitt M, Gadde M, Zhou JC. Toward Predictive Multiscale Modeling of Vascular Tumor Growth. Archives of Computational Methods in Engineering. 2016;23(4):735–779. [Google Scholar]
- 34.Proskuryakov Sergey Y, Gabai Vladimir L. Mechanisms of tumor cell necrosis. Current Pharmaceutical Design. 2010;16:56–68. doi: 10.2174/138161210789941793. [DOI] [PubMed] [Google Scholar]
- 35.Ramis-Conde I, Chaplain MAJ, Anderson ARA. A. Mathematical modelling of cancer cell invasion of tissue. Mathematical and Computer Modelling. 2008;47:533–545. [Google Scholar]
- 36.Roberts PJ, Der CJ. Targeting the Raf-MEK-ERK mitogen-activated protein kinase cascade for the treatment of cancer. Oncogene. 2007;26:3291–3310. doi: 10.1038/sj.onc.1210422. [DOI] [PubMed] [Google Scholar]
- 37.Roose T, Netti PA, Munn LL, Boucher Y, Jain RK. Solid stress generated by spheroid growth estimated using a linear poroelasticity model. Microvascular Research. 2003;66:204–212. doi: 10.1016/s0026-2862(03)00057-8. [DOI] [PubMed] [Google Scholar]
- 38.Schoeberl B, Eichler-Jonsson C, Gilles ED, Muller G. Computational modeling of the dynamics of the MAP kinase cascade activated by surface and internalized EGF receptors. Nature Biotechnology. 2002;20:370–375. doi: 10.1038/nbt0402-370. [DOI] [PubMed] [Google Scholar]
- 39.Slodkowska EA, Cribier B, Peltre B, Jones DM, A. Carlson J. Calcifications associated with basal cell carcinoma: prevalence, characteristics, and correlations. The American Journal of Dermatopathology. 2010;32(6):557–564. doi: 10.1097/DAD.0b013e3181ca65e2. [DOI] [PubMed] [Google Scholar]
- 40.Stylianopoulos T, Martin JD, Chauhan VP, Jain SR, Diop-Frimpong B, Bardeesy N, Smith BL, Ferrone CR, Hornicek FJ, Boucher Y, Munn LL, Jain RK. Causes, consequences, and remedies for growthinduced solid stress in murine and human tumors. Proceedings of the National Academy of Sciences of the United States of America. 2012;109(38):15101–15108. doi: 10.1073/pnas.1213353109. [DOI] [PMC free article] [PubMed] [Google Scholar]
- 41.Wang Z, Butner JD, Kerketta R, Cristini V, Deisboeck TS. Simulating cancer growth with multiscale agent-based modeling. Seminars in Cancer Biology. 2015;30:70–78. doi: 10.1016/j.semcancer.2014.04.001. [DOI] [PMC free article] [PubMed] [Google Scholar]
- 42.Wang Zhihui, Zhang Le, Sagotsky Jonathan, Deisboeck Thomas S. Simulating non-small cell lung cancer with a multiscale agent-based model. Theoretical Biology and Medical Modelling. 2007;4:50. doi: 10.1186/1742-4682-4-50. [DOI] [PMC free article] [PubMed] [Google Scholar]
- 43.Wolfram S. A new kind of science. Wolfram Media, Inc; 2002. [Google Scholar]
- 44.Yankeelov TE, Atuegwu N, Hormuth D, II, Weis JA, Barnes SL, Miga MI, Rericha EC, Quaranta V. Clinically relevant modeling of tumor growth and treatment response. Science Translational Medicine. 2013;5(187):187ps9. doi: 10.1126/scitranslmed.3005686. [DOI] [PMC free article] [PubMed] [Google Scholar]
- 45.Yankeelov Thomas E, Vito Quaranta, Katherine J Evans, Rericha Erin C. Toward a science of tumor forecasting for clinical oncology. Cancer Research. 2015;75(6):918–923. doi: 10.1158/0008-5472.CAN-14-2233. [DOI] [PMC free article] [PubMed] [Google Scholar]
- 46.Yankeelov Thomas E, Saut Gary AnOliver, Luebeck E Georg, Popel Aleksander S, Ribba Benjamin, Vicini Paolo, Zhou Xiaobo, Weis Jared A, Ye Kaiming, Genin Guy M. Multi-scale modeling in clinical oncology: Opportunities and barriers to success. Annals of Biomedical Engineering. 2016;44(9):2626–2641. doi: 10.1007/s10439-016-1691-6. [DOI] [PMC free article] [PubMed] [Google Scholar]


