

Abstract
The resonances originating from proteins underlie those of metabolites in brain 1H NMR spectra. These resonances have different physical properties from those of metabolites such as shorter T1 and T2 relaxation time constants. The age dependence of macromolecular pattern and content in the human brain were investigated with a focus on adults over 66 years old using ultra-high field in vivo magnetic resonance spectroscopy. Eighteen young and twenty three cognitively normal older adults were studied at 7 T. Metabolite spectra were acquired in the occipital cortex and the posterior cingulate cortex with single voxel STEAM spectroscopy in fourteen young and twenty older adults. Macromolecular spectra were acquired in the occipital cortex using an inversion-recovery STEAM sequence in four young and three older adults. The macromolecular pattern was apparent over the 0.5 to 4.5 ppm range in the inversion-recovery spectra and over the 0.5 to 2 ppm range in the metabolite spectra. Macromolecular content was quantified from metabolite spectra using LCModel and from inversion-recovery spectra using integration. Age-associated differences in the macromolecular pattern were apparent via both types of spectra, with the largest difference observed for the 1.7 and 2 ppm macromolecular resonances. A higher macromolecular content was observed in the older adults for both brain regions. Age-specific macromolecular spectra are needed when comparing metabolite spectra from subjects of differing ages because of age-associated differences in macromolecular pattern. Age-associated pattern and content differences may provide information about the aging process.
Keywords: macromolecules, ultra-high field, 7 T, magnetic resonance spectroscopy
Graphical abstract
Age-associated differences in the macromolecular patterns were apparent in STEAM spectra without and with inversion-recovery metabolite nulling, with the largest differences observed for the 1.7 and 2 ppm macromolecular resonances. A higher macromolecular content was observed in the older adults in two brain regions studied, the occipital cortex and the posterior cingulate cortex. Age-specific macromolecular spectra are needed when comparing metabolite spectra from subjects of differing ages. Age-associated pattern and content differences may provide information about the aging process.
Introduction
Proteins in the human brain contribute broad resonances to 1H NMR spectra. These resonances are readily apparent in the 0.5 to 2.0 ppm range but also underlie metabolite resonances in the 2.0 – 4.5 ppm range. Macromolecular resonances arise from amino acids within highly flexible polypeptide chains1 and exhibit shorter T1 and T2 relaxation time constants than most of the metabolites2. Each broad macromolecular resonance consists of several overlapping resonances2. 2D NMR of dialyzed human cerebral cytosol has been used to detect several spin-spin couplings (J-coupling) among macromolecular resonances, the most prominent being 0.93 to 2.05 ppm and 1.72 to 3.00 ppm2.
Spectra of macromolecules are important for quantifying metabolite concentrations and may be useful for understanding aging and disease processes2–6. Resonances from macromolecules in the 0.5 to 2.0 ppm range are readily apparent in short echo time 1H NMR spectra of the human brain because lactate is the only metabolite to contribute appreciable signal in this span of chemical shift. The spectrum of macromolecules across the entire ppm range underlying the spectra of metabolites (0.5 to 4.5 ppm) can also be observed using metabolite nulling, which takes advantage of the difference in T1 between metabolites and macromolecules2.
Resonances from macromolecules (0.6 to 3.3 ppm) have been characterized across the age span using localized 1H MR spectroscopy of the human centrum semiovale at 1.5 T6. In a cohort that included 5 individuals over 55 years old, an age-associated increase in macromolecular content was measured between young adults (< 25 years) and the middle aged (25–55 years), while no difference in macromolecular content was observed during aging beyond age 55.
The purpose of this project was to investigate macromolecular pattern and content differences in aging, with a focus on adults older than 66 years and to cross-check the outcome using two 1H MRS approaches: with and without metabolite nulling at ultra-high field. Data were measured in two brain regions to check whether age-associated differences are the same for both regions, and to provide information on region-specific differences at a given age. Ultra-high field 1H MRS provides increased resolution and leads to better separation among the macromolecular resonances with the caveat of smaller difference of T1 between macromolecules and metabolites.
Experimental
Subjects
Eighteen young adults (11 males, 7 females; age: 22 ± 3 [mean ± standard deviation] years; age range 19 to 31 years) and 23 older adults (18 males, 5 females; age: 75 ± 6 years; age range 67 to 88 years) provided informed consent according to procedures approved by the Human Subjects’ Protection Committee at the University of Minnesota, Institutional Review Board. All participants underwent an MRI exam at 7 T. Older adults with the following conditions more prevalent with advancing age were excluded based on clinical and neurological examination: Montreal Cognitive Assessment (MoCA7) score < 24, memory or cognitive complaints, history of brain tumor or brain cancer, stroke, Parkinson’s disease, multiple sclerosis, cerebral palsy, Huntington’s disease, encephalitis, meningitis, medical condition (including kidney dialysis or liver disease) or neurological diagnosis (including vascular dementia or having undergone brain surgery to clear arteries in the brain) that potentially could affect cognition, or poor creatinine clearance (GFR < 45 mL/min8). Each participant underwent conventional (metabolite) MRS (14 young, 20 older), macromolecular (metabolite-nulled) MRS (4 young, 1 older), or both (2 older) on different days.
MR acquisition
In vivo data were obtained on a 7-T, 90-cm horizontal bore magnet (Magnex Scientific Inc., Oxford, UK) interfaced with a Siemens console running syngo VB17 (Siemens, Erlangen, Germany). The magnet was equipped with a body gradient coil (maximum amplitude: 70 mT/m, slew rate: 200 mT/m/ms). A 16-channel transmission line head array radiofrequency (RF) coil9 was used to transmit and receive the signal. The transmit phase of each coil channel was controlled with an independent 1-kW RF amplifier (CPC, Brentwood, NY, USA). An RF power monitoring system measured the forward and reflected power for each channel to ensure that the local specific absorption rate did not exceed 3 W/kg.
Magnetization-prepared rapid gradient-echo (MPRAGE) images10 (TR = 3 s; TE = 3.27 ms; TI = 1.5 s; flip angle = 5°; field of view: 256 × 256 mm2; matrix: 256 × 256; slice thickness = 1 mm, 176 slices, acceleration factor = 3, acquisition time: 4 min 17 s) were acquired to position 8 mL volumes-of-interest (VOIs) in the occipital cortex (OCC) and the posterior cingulate cortex (PCC). VOIs were positioned symmetrically across hemispheres. The OCC VOI was rotated to align with the boundaries of the occipital lobe and placed in the center of the occipital lobe vertically while the back corner was placed 4 mm anterior to the back of the occipital lobe. The PCC VOI was rotated to align with the corpus callosum and placed in the parietal lobe, 2 mm posterior to the marginal sulcus, and 2 mm superior of the corpus callosum. Proton-density (PD) images (TR = 1.41 s; TE = 3.27 ms; field of view: 256 × 256 mm2; matrix: 256 × 256; slice thickness = 1 mm, 176 slices, acceleration factor = 3, acquisition time: 2 min) were also acquired to correct for intensity field bias in the T1-weighted MPRAGE images11. To maximize the transmit B1 in the VOIs, fast local shimming of the phase of B1+ for each coil channel was employed12,13. B0 shimming of first- and second-order terms was achieved using the fast automatic shimming technique by mapping along projections with echo planar imaging readout (FAST(EST)MAP,14,15). MR spectra were measured using an ultra-short echo time stimulated echo acquisition mode (STEAM) sequence without (referred to as metabolite spectra, TR = 5 s; TE = 8 ms; mixing time (TM) = 32 ms) and with single inversion-recovery metabolite nulling (referred to as macromolecular spectra, TR = 2 s; TE = 8 ms; TM = 32 ms; inversion time (TI) = 0.68 s) and with 3D outer volume suppression (OVS) interleaved with variable power and optimized relaxation delay (VAPOR) water suppression16. The B1 field and the water suppression pulses were calibrated in both VOIs for each individual. The OVS was optimized for the coil used and for the morphometry of older adult brains. Without inversion recovery, 64 averages were acquired in the OCC and 128 in the PCC from 14 young and 17 older adults. With inversion recovery, on average 374 averages were acquired in the OCC per subject from 4 young (age: 26 ± 4 years, total of 1664 averages) and 3 older (age: 73 ± 3 years, total of 960 averages) adults in blocks of 64 averages. Shortening the TR minimized contamination by metabolites that would otherwise occur because of the variance in the T1 of metabolites. The chemical shift displacement of the VOI was 4% per ppm. Each free induction decay was acquired with 2048 complex data points using a spectral width of 6 kHz. A non-suppressed water spectrum was acquired for eddy current correction and quantification (TR = 5 s; TE = 8 ms; TM = 32 ms; 1 average).
For some participants, 3 T MPRAGE (TR = 2.4 s; TE = 2.24 ms; TI = 1.06 s; flip angle = 8°; field of view: 256 × 256 mm2; matrix: 320 × 320; slice thickness = 0.8 mm, 208 slices, acceleration factor = 2, acquisition time: 6 min 38 s) images were acquired to obtain gray matter (GM), white matter (WM), and cerebrospinal fluid (CSF) content.
Image processing and analysis
7 T MPRAGE images were pre-flattened by dividing by the PD images11 using FSL, a comprehensive library of analysis tools for fMRI, MRI, and DTI brain imaging data17. Images were further flattened using statistical parametric mapping (SPM)18 and segmented into GM, WM, and CSF content using Freesurfer19. The tissue composition was extracted for each VOI using analysis of functional neuro images (AFNI)20. 3 T MPRAGE images were segmented using Freesurfer19 via the HCP protocol21. In-session 7 T MPRAGE images were aligned to the 3 T MPRAGE images, and this transformation matrix was applied to each VOI using AFNI20 to obtain tissue composition for each VOI using Freesurfer19.
The VOIs used to obtain macromolecular data contained 49 ± 3% of GM, 35 ± 2% of WM, and 16 ± 2% of CSF in young adults, and 41.6 ± 0.7% of GM, 36.4 ± 0.3% of WM, and 22.1 ± 0.6% of CSF in older adults. The VOIs used to obtain metabolite spectra in the OCC contained 50 ± 3% of GM, 31 ± 4% of WM, and 19 ± 4% of CSF in young adults, and 37 ± 6% of GM, 38 ± 6% of WM, and 26 ± 7% of CSF in older adults; and in the PCC contained 60 ± 3% of GM, 23 ± 2% of WM, and 17 ± 3% of CSF in young adults, and 48 ± 8% of GM, 25 ± 3% of WM, and 27 ± 8% of CSF in older adults.
Spectral processing and quantification
The acquired spectra were processed in Matlab (MathWorks Inc., Natick, MA). Eddy-current effects were corrected using the non-suppressed water spectrum. Single-shot metabolite spectra and 64-shot macromolecular spectra were frequency and phase aligned using a cross-correlation algorithm.
Macromolecular content from age-specific macromolecular spectra were obtained using Matlab by integrating the spectra from 0.5 to 5 ppm. To normalize the amplitude of macromolecular spectra, spectra from each subject were scaled using water as an internal reference and taking into consideration GM, WM, and CSF content as well as T2 of water in different compartments using the parameters and process described below for metabolite spectra. The macromolecular spectra were deconvoluted into 30 peaks in the time domain using the first 1024 points of the free induction decay using the HSVD algorithm22 in Matlab. Then residual water signal and the narrow signal resonating at 3.93 ppm associated with total creatine (tCr) were removed and 8 Hz Gaussian broadening was applied.
Metabolite spectra were analyzed using LCModel23,24 6.3-1J (Stephen Provencher, Inc., Oakville, ON, Canada) with the basis set simulated in Matlab using the density matrix formalism25 with ideal pulses and actual echo time and mixing time and previously published chemical shifts and J-couplings26–28. The following metabolites were included in the basis set: ascorbate (Asc), aspartate (Asp), creatine (Cr), γ-aminobutyric acid (GABA), glucose (Glc), glutamine (Gln), glutamate (Glu), glutathione (GSH), glycerophosphorylcholine (GPC), lactate (Lac), myo-inositol (mIns), N-acetylaspartate (NAA), N-acetylaspartylglutamate (NAAG), phosphocreatine (PCr), phosphorylcholine (PCho), phosphorylethanolamine (PE), scyllo-inositol (sIns), and taurine (Tau). The average age-specific macromolecule spectra (described above) measured with the inversion-recovery technique were also included in the basis set. No additional resonances, such as lipids, were used in the analysis. No baseline correction, zero-filling, or line broadening were applied to the in vivo data before the analysis. Spectra were fitted between 0.5 and 4.1 ppm using a knot spacing (DKNTMN) of 5 to impose a flat spline baseline29. If flatness was not imposed, a rolling spline baseline would freely take up broad resonances, and take up amplitude from macromolecular resonance and small concentration metabolites.
Quantification was performed using the unsuppressed water signal obtained from the same VOI and corrected for GM, WM, and CSF content as previously described30. The water content for CSF and WM were assumed to be 0.9731 and 0.7132–34, respectively for both age groups since water content has been reported to be constant with age in WM32. For GM, the water content was assumed to be 0.80 for young adults32–34, 0.79 for older women32 and 0.76 for older men32. T1 and T2 relaxation time constants of water used in the calculation of the attenuation factors were taken from published reports [T1(GM) = 2130 ms, T1(WM) = 1220 ms, T1(CSF) = 442535; T2(GM) = 50 ms, T2(WM) = 55 ms, T2(CSF) = 141 ms36] and included a 10% reduction in T2 of tissue water in older adults37 [T2(GM) = 45 ms, T2(WM) = 49.5 ms].
Unlike the metabolite basis spectra, the macromolecular basis spectra were not equivalent for young and older adults. Thus a normalization step was added to quantify macromolecular content from metabolite spectra, i.e., spectra measured without inversion recovery. In this case, the water scaled macromolecular concentrations obtained from LCModel analysis were multiplied by the integral of the macromolecule spectrum (0.5 to 5 ppm) for each age group. Metabolite concentrations in young and older adults have been reported previously from a subset of the spectra used in this study38.
Statistical analysis
The analysis used a mixed linear model and JMP software (v. 12.0 Pro, SAS Institute Inc., Cary, NC) with the restricted likelihood method. Fixed effects were age group, region, and their interaction. The interaction of age group with region tests whether the difference between age groups depends on region. The random effect was person. In the young group, the OCC and PCC spectra were measured in the same 14 participants. Of the 22 older participants, spectra in both the OCC and the PCC were measured in 12 participants, only in the PCC in 5 participants and only in the OCC in 5 participants. The mixed linear model implicitly combines these data appropriately, taking into account the correlation of the OCC and PCC measures within a person.
Results
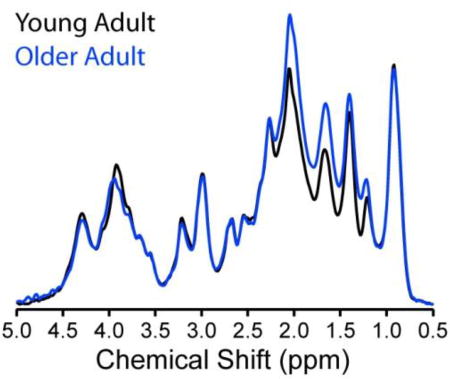
Figure 1 shows the metabolite-nulled macromolecular spectra for young and older adults measured using the STEAM sequence with single inversion recovery. The macromolecular spectrum underlying the 0.5 to 4.5 ppm range is perceivable in the absence of metabolite signals. Clear age-associated differences in macromolecular pattern are apparent, since the spectra overlap at 0.9 ppm, but not at several other chemical shifts. A content difference is also apparent, since the spectra are normalized, and the macromolecular spectrum for young adults lies below the macromolecular spectrum for older adults to a greater extent in the 1 to 3 ppm range than it lies above the macromolecular spectrum for older adults in the 3 to 4.5 ppm range. Most differences occur in the range 1 to 2.2 ppm, although there is also a noteworthy difference at 3.9 ppm. The largest differences in intensities are observed for the 1.7 and 2 ppm resonances. The higher intensities of several resonances lead to an 8.9% higher macromolecular content in the older adults than the younger adults.
Figure 1.

Averaged metabolite-nulled macromolecular spectra measured from 4 young (26 ± 4 years) adults (gray line) and 3 older (73 ± 3 years) adults (black line). Spectra from each subject were scaled using a water reference and taking into consideration GM, WM, and CSF content as well as T2 of water in different compartments before averaging. Spectra were acquired from an 8 mL VOI placed in the OCC using the inversion-recovery technique (STEAM, TR = 2 s, TE = 8 ms, inversion time (TI) = 0.68 s, number of averages = 1664 averages for the young adults and 960 averages for the older adults). Spectra are shown after removal of the residual tCr peak at 3.93 ppm and with 8 Hz Gaussian broadening as used in the basis sets.
Figure 2 shows the metabolite spectra obtained in this study. High quality was achieved in all subjects in both brain regions and both age groups. In particular, these spectra consistently evidence high signal-to-noise ratio, narrow linewidths, and absence of contamination from signals outside the VOIs that would appear as intermittent and out of phase signals near 1.1 and 1.4 ppm38. The macromolecular presence and contributions are readily apparent between 0.5 and 1.9 ppm, i.e., in the range where they are not obscured by strong metabolite resonances. However, lactate at 1.32 ppm is also present and can be especially observed in the older adults. The spectra in Figure 2 were normalized to the 0.9 ppm macromolecular resonance, since this resonance was constant over age in the macromolecular spectra (Figure 1). The most pronounced age-associated difference in the macromolecular signal is the more intense macromolecular resonance at 1.7 ppm in the older adults in both brain regions. The observed macromolecular pattern is the same for both brain regions in both groups, i.e., the macromolecular pattern looks the same in the OCC and the PCC of young adults, and it looks the same in the OCC and the PCC of older adults.
Figure 2.

Metabolite spectra measured in 8 mL VOIs placed in the OCC and the PCC in the two age groups. Average (solid line) and standard deviation (shaded area) of individual spectra are shown for 14 young and 17 older adults. Spectra are shown with no line broadening and with vertical scale adjusted to match the 0.9 ppm macromolecular resonance for all regions and ages. Horizontal dashed lines are guides to help in visualizing the changes in the macromolecular pattern observed at 1.7 ppm. (STEAM, TR = 5 s, TE = 8 ms, number of averages = 64 for the OCC and 128 for the PCC).
Table 1 reports the macromolecular content in both brain regions and age groups that were calculated from the metabolite spectra. Macromolecular content was higher in the older group compared to younger group in both regions, by somewhat more in the PCC (p = 0.0021) than in the OCC (p = 0.025), but the two regions did not test different in this regard (p = 0.39). In the OCC, the macromolecular content was 8% higher in the older adults, consistent with the 9% higher level obtained from the macromolecular spectra of Figure 1. Additionally, the difference in macromolecular content between regions was larger for young adults (p = 0.013) than older adults (p = 0.16), but the two groups did not test different in this regard (p = 0.39).
Table 1.
Macromolecular content measured in young and older adults expressed as mean ± standard error of the mean, with p-values comparing the age groups. Content was quantified from metabolite spectra, i.e., STEAM spectra without inversion recovery.
| PCC | OCC | |||||
|---|---|---|---|---|---|---|
| Young adults | Older adults | p-value | Young adults | Older adults | p-value | |
| Number of subjects | 14 | 17 | 14 | 17 | ||
| Age (years) | 21 ± 1 | 75 ± 6 | 21 ± 1 | 74 ± 6 | ||
| Macromolecular content (I.U.) | 0.082 ± 0.002 | 0.091 ± 0.002 | 0.0021 | 0.088 ± 0.002 | 0.094 ± 0.002 | 0.0253 |
Discussion
Age-associated macromolecular pattern and content differences were observed in the human OCC and PCC. The pattern differences in the OCC were in good agreement when measured with two methods (0–2 ppm range), and were consistent between the OCC and the PCC in the metabolite spectra. The content differences in the OCC were in good agreement when measured with two methods, and macromolecular content was higher in older adults in both brain regions in the metabolite spectra.
The relative intensities of the components of the macromolecular spectra were the same in both brain regions for each of young and older adults. This regional constancy of the macromolecular pattern over the observable chemical shift range (0 – 2 ppm) in both age groups suggests that age-associated pattern differences that occur throughout the macromolecular spectrum in the PCC are in the same proportions as those that occur in the OCC. Macromolecular content differences do not influence quantification of metabolite concentrations from metabolite spectra, since these are easily taken into account using LCModel. However, macromolecular spectral pattern differences influences metabolite quantification. Age-associated differences in the macromolecular pattern such as those observed in this study influence the accuracy of metabolite quantification, so it is necessary to use age-appropriate macromolecular spectra in the fitting model. On the other hand, because the patterns were the same in the two regions (at least over the 0 – 2 ppm chemical shift range), this study does not indicate a need for region-specific macromolecular spectra when studying the OCC and the PCC.
This is the first time that age-associated differences in macromolecular content and pattern have been studied using the advantages of increased sensitivity and spectral dispersion realized at ultra-high field. This led to greater ability to identify age-associated spectral pattern differences than has previously been achieved. The purity of the macromolecular spectra in this study was also exceptionally high. There was no evidence of outer volume contamination in any of the spectra (Figure 2). The possibility for residual signals from partially recovered resonances from metabolites in the macromolecular spectra was efficiently minimized by shortening the TR of the STEAM acquisition with inversion recovery (Figure 1). With TR of 2 s and TI of 0.68 s, 38% of the macromolecular signal was observed when taking into consideration T1 of macromolecules of 420 ms39. The overall appearance of the pattern might be influenced by differences in T1 between different macromolecular resonances, however, that effect would be small compared to the differences that were observed in the pattern. Additionally, the agreement between the two methods (0 – 2 ppm range) suggests that the effect of T1 differences is small.
The current finding of higher macromolecular content in older adults is in agreement with a comparable finding in a different brain region6, although the current work found differences at a later stage of adulthood. The pattern differences that were measured in the current study have greater spectral resolution than has been achieved in the past, yet they agree with the prior study in that the greatest age-associated differences occurred in the chemical shift vicinity of 1.5 ppm6.
Prior studies on regional dependence of macromolecular pattern and content focused on differences between GM and WM. While the few reported content differences are in contradiction6,40, macromolecular resonances over the 0.6 – 2.5 ppm range have consistently been reported to be larger in GM than WM6,41,42. In the cohort of the current study, GM content was lower in both brain regions in older adults, yet macromolecular content was higher in older adults, as were relative intensities of the resonances in the 0.6 – 2.5 ppm range. Therefore, tissue content differences do not explain the age-associated differences in macromolecular pattern and content that were found in this study. Regarding spin-spin connectivity among macromolecular resonances2, the higher age-associated macromolecular resonance at 2.05 ppm was not matched by a comparable difference at 0.93 ppm. Similarly, the age-associated differences did not match for the 1.72 to 3.00 ppm connectivity. It is possible that age-associated differences arose more so from the broad 2.05 ppm singlet resonance than from the coupled system, and that macromolecules other than those emphasized by Behar et al.2 contribute to the age-associated differences observed at 1.72 ppm in the current study.
Age-associated differences in macromolecular content and pattern may have cellular and sub-cellular origins. Higher macromolecular resonances at 0.9, 1.3, and 2.0 ppm in stroke patients have been attributed to larger numbers of foamy macrophages4,43, liberation of free fatty acids from damages cells, and/or increased visibility of cytosolic proteins after cell death4. In the current study, the age-associated macromolecular content difference was measured with the highest significance in the PCC (Table 1). This is the same region in which our previously published metabolite spectra from a similar cohort38 evidenced reactive astrogliosis and deterioration of metabolic vigor in older adults.
Conclusion
Macromolecular pattern and content in the human brain differ between young and older adults. Thus age-specific macromolecular spectra are needed when studying aging. These pattern and content differences may be informative about the aging process, although more studies are needed to understand how cellular and subcellular structures influence the macromolecular signals.
Acknowledgments
The authors thank: Edward J. Auerbach, Ph.D. for implementing the FAST(EST)MAP and STEAM sequences on the Siemens platform, Pierre-Francois Van de Moortele, M.D., Ph.D., and Julien Sein, Ph.D. for the T1-flattening script, and Emily Kittelson for image segmentation. We also acknowledge the University of Minnesota Retiree’s Volunteer Center for assistance with recruiting older adult candidates.
Sponsors: This work was supported by the National Institutes of Health [grant numbers R01AG039396, P41 EB015894, P30 NS076408] and the W.M. Keck Foundation.
List of abbreviations
- CSF
cerebrospinal fluid
- GM
gray matter
- MPRAGE
magnetization-prepared rapid gradient echo
- OCC
occipital cortex
- OVS
outer volume suppression
- PCC
posterior cingulate cortex
- PD
proton density
- RF
radiofrequency
- STEAM
stimulated echo acquisition mode
- VOI
volume of interest
- WM
white matter
References
- 1.Behar KL, Ogino T. Characterization of macromolecule resonances in the 1H NMR spectrum of rat brain. Magn Reson Med. 1993 Jul;30(1):38–44. doi: 10.1002/mrm.1910300107. [DOI] [PubMed] [Google Scholar]
- 2.Behar KL, Rothman DL, Spencer DD, Petroff OA. Analysis of macromolecule resonances in 1H NMR spectra of human brain. Magn Reson Med. 1994 Sep;32(3):294–302. doi: 10.1002/mrm.1910320304. [DOI] [PubMed] [Google Scholar]
- 3.Cudalbu C, Mlynarik V, Gruetter R. Handling macromolecule signals in the quantification of the neurochemical profile. J Alzheimers Dis. 2012;31(Suppl 3):S101–115. doi: 10.3233/JAD-2012-120100. [DOI] [PubMed] [Google Scholar]
- 4.Saunders DE, Howe FA, van den Boogaart A, Griffiths JR, Brown MM. Discrimination of metabolite from lipid and macromolecule resonances in cerebral infarction in humans using short echo proton spectroscopy. J Magn Reson Imaging. 1997 Nov-Dec;7(6):1116–1121. doi: 10.1002/jmri.1880070626. [DOI] [PubMed] [Google Scholar]
- 5.Mader I, Seeger U, Weissert R, et al. Proton MR spectroscopy with metabolite-nulling reveals elevated macromolecules in acute multiple sclerosis. Brain. 2001 May;124(Pt 5):953–961. doi: 10.1093/brain/124.5.953. [DOI] [PubMed] [Google Scholar]
- 6.Hofmann L, Slotboom J, Boesch C, Kreis R. Characterization of the macromolecule baseline in localized 1H-MR spectra of human brain. Magn Reson Med. 2001 Nov;46(5):855–863. doi: 10.1002/mrm.1269. [DOI] [PubMed] [Google Scholar]
- 7.Nasreddine ZS, Phillips NA, Bedirian V, et al. The Montreal Cognitive Assessment, MoCA: a brief screening tool for mild cognitive impairment. J Am Geriatr Soc. 2005 Apr;53(4):695–699. doi: 10.1111/j.1532-5415.2005.53221.x. [DOI] [PubMed] [Google Scholar]
- 8.Cockcroft DW, Gault MH. Prediction of creatinine clearance from serum creatinine. Nephron. 1976;16(1):31–41. doi: 10.1159/000180580. [DOI] [PubMed] [Google Scholar]
- 9.Adriany G, De Moortele PFV, Ritter J, et al. A geometrically adjustable 16-channel transmit/receive transmission line array for improved RF efficiency and parallel imaging performance at 7 Tesla. Magn Reson Med. 2008 Mar;59(3):590–597. doi: 10.1002/mrm.21488. [DOI] [PubMed] [Google Scholar]
- 10.Brant-Zawadzki M, Gillan GD, Nitz WR. MP RAGE: a three-dimensional, T1-weighted, gradient-echo sequence--initial experience in the brain. Radiology. 1992 Mar;182(3):769–775. doi: 10.1148/radiology.182.3.1535892. [DOI] [PubMed] [Google Scholar]
- 11.Van de Moortele PF, Auerbach EJ, Olman C, Yacoub E, Ugurbil K, Moeller S. T1 weighted brain images at 7 Tesla unbiased for Proton Density T2* contrast and RF coil receive B1 sensitivity with simultaneous vessel visualization. Neuroimage. 2009 Jun;46(2):432–446. doi: 10.1016/j.neuroimage.2009.02.009. [DOI] [PMC free article] [PubMed] [Google Scholar]
- 12.Metzger GJ, Snyder C, Akgun C, Vaughan T, Ugurbil K, Van de Moortele PF. Local B1+ shimming for prostate imaging with transceiver arrays at 7T based on subject-dependent transmit phase measurements. Magn Reson Med. 2008 Feb;59(2):396–409. doi: 10.1002/mrm.21476. [DOI] [PMC free article] [PubMed] [Google Scholar]
- 13.Van de Moortele PF, Akgun C, Adriany G, et al. B1 destructive interferences and spatial phase patterns at 7 T with a head transceiver array coil. Magn Reson Med. 2005 Dec;54(6):1503–1518. doi: 10.1002/mrm.20708. [DOI] [PubMed] [Google Scholar]
- 14.Gruetter R. Automatic, localized in vivo adjustment of all first- and second-order shim coils. Magn Reson Med. 1993 Jun;29(6):804–811. doi: 10.1002/mrm.1910290613. [DOI] [PubMed] [Google Scholar]
- 15.Gruetter R, Tkac I. Field mapping without reference scan using asymmetric echo-planar techniques. Magn Reson Med. 2000 Feb;43(2):319–323. doi: 10.1002/(sici)1522-2594(200002)43:2<319::aid-mrm22>3.0.co;2-1. [DOI] [PubMed] [Google Scholar]
- 16.Tkac I, Andersen P, Adriany G, Merkle H, Ugurbil K, Gruetter R. In vivo 1H NMR spectroscopy of the human brain at 7 T. Magn Reson Med. 2001 Sep;46(3):451–456. doi: 10.1002/mrm.1213. [DOI] [PubMed] [Google Scholar]
- 17.Jenkinson M, Beckmann CF, Behrens TE, Woolrich MW, Smith SM. FSL. Neuroimage. 2012 Aug 15;62(2):782–790. doi: 10.1016/j.neuroimage.2011.09.015. [DOI] [PubMed] [Google Scholar]
- 18.Friston KJ, Holmes AP, Worsley KJ, Poline J-P, Frith CD, Frackowiak RSJ. Statistical parameteric maps in functional imaging: A general linear approach. Hum Brain Mapp. 1995;2:189–210. [Google Scholar]
- 19.Fischl B, Salat DH, Busa E, et al. Whole brain segmentation: automated labeling of neuroanatomical structures in the human brain. Neuron. 2002 Jan 31;33(3):341–355. doi: 10.1016/s0896-6273(02)00569-x. [DOI] [PubMed] [Google Scholar]
- 20.Cox RW. AFNI: software for analysis and visualization of functional magnetic resonance neuroimages. Comput Biomed Res. 1996 Jun;29(3):162–173. doi: 10.1006/cbmr.1996.0014. [DOI] [PubMed] [Google Scholar]
- 21.Glasser MF, Sotiropoulos SN, Wilson JA, et al. The minimal preprocessing pipelines for the Human Connectome Project. Neuroimage. 2013 Oct 15;80:105–124. doi: 10.1016/j.neuroimage.2013.04.127. [DOI] [PMC free article] [PubMed] [Google Scholar]
- 22.Barkhuijsen H, Debeer R, Vanormondt D. Improved Algorithm for Noniterative Time-Domain Model-Fitting to Exponentially Damped Magnetic-Resonance Signals. J Magn Reson. 1987 Jul;73(3):553–557. [Google Scholar]
- 23.Provencher SW. Estimation of metabolite concentrations from localized in vivo proton NMR spectra. Magn Reson Med. 1993 Dec;30(6):672–679. doi: 10.1002/mrm.1910300604. [DOI] [PubMed] [Google Scholar]
- 24.Provencher SW. Automatic quantitation of localized in vivo 1H spectra with LCModel. NMR Biomed. 2001 Jun;14(4):260–264. doi: 10.1002/nbm.698. [DOI] [PubMed] [Google Scholar]
- 25.Henry PG, Marjanska M, Walls JD, Valette J, Gruetter R, Ugurbil K. Proton-observed carbon-edited NMR spectroscopy in strongly coupled second-order spin systems. Magn Reson Med. 2006 Feb;55(2):250–257. doi: 10.1002/mrm.20764. [DOI] [PubMed] [Google Scholar]
- 26.Govindaraju V, Young K, Maudsley AA. Proton NMR chemical shifts and coupling constants for brain metabolites. NMR Biomed. 2000 May;13(3):129–153. doi: 10.1002/1099-1492(200005)13:3<129::aid-nbm619>3.0.co;2-v. [DOI] [PubMed] [Google Scholar]
- 27.Kaiser LG, Marjanska M, Matson GB, et al. 1H MRS detection of glycine residue of reduced glutathione in vivo. J Magn Reson. 2010 Feb;202(2):259–266. doi: 10.1016/j.jmr.2009.11.013. [DOI] [PMC free article] [PubMed] [Google Scholar]
- 28.Govind V, Young K, Maudsley AA. Corrigendum: proton NMR chemical shifts and coupling constants for brain metabolites. Govindaraju V, Young K, Maudsley AA, NMR Biomed. 2000; 13: 129–153. NMR Biomed. 2015 Jul;28(7):923–924. doi: 10.1002/nbm.3336. [DOI] [PubMed] [Google Scholar]
- 29.Deelchand DK, Marjanska M, Hodges JS, Terpstra M. Sensitivity and specificity of human brain glutathione concentrations measured using short-TE 1H MRS at 7 T. NMR Biomed. 2016 May;29(5):600–606. doi: 10.1002/nbm.3507. [DOI] [PMC free article] [PubMed] [Google Scholar]
- 30.Gussew A, Erdtel M, Hiepe P, Rzanny R, Reichenbach JR. Absolute quantitation of brain metabolites with respect to heterogeneous tissue compositions in 1H-MR spectroscopic volumes. Magn Reson Mater Phy. 2012 Oct;25(5):321–333. doi: 10.1007/s10334-012-0305-z. [DOI] [PubMed] [Google Scholar]
- 31.Ernst T, Kreis R, Ross BD. Absolute Quantitation of Water and Metabolites in the Human Brain .1. Compartments and Water. J Magn Reson B. 1993 Aug;102(1):1–8. [Google Scholar]
- 32.Neeb H, Zilles K, Shah NJ. Fully-automated detection of cerebral water content changes: study of age- and gender-related H2O patterns with quantitative MRI. Neuroimage. 2006 Feb 1;29(3):910–922. doi: 10.1016/j.neuroimage.2005.08.062. [DOI] [PubMed] [Google Scholar]
- 33.Abbas Z, Gras V, Mollenhoff K, Keil F, Oros-Peusquens AM, Shah NJ. Analysis of proton-density bias corrections based on T1 measurement for robust quantification of water content in the brain at 3 Tesla. Magn Reson Med. 2014 Dec;72(6):1735–1745. doi: 10.1002/mrm.25086. [DOI] [PubMed] [Google Scholar]
- 34.Reetz K, Abbas Z, Costa AS, et al. Increased cerebral water content in hemodialysis patients. PLoS One. 2015;10(3):e0122188. doi: 10.1371/journal.pone.0122188. [DOI] [PMC free article] [PubMed] [Google Scholar]
- 35.Rooney WD, Johnson G, Li X, et al. Magnetic field and tissue dependencies of human brain longitudinal 1H2O relaxation in vivo. Magn Reson Med. 2007 Feb;57(2):308–318. doi: 10.1002/mrm.21122. [DOI] [PubMed] [Google Scholar]
- 36.Bartha R, Michaeli S, Merkle H, et al. In vivo 1H2O T2(dagger) measurement in the human occipital lobe at 4T and 7T by Carr-Purcell MRI: Detection of microscopic susceptibility contrast. Magn Reson Med. 2002 Apr;47(4):742–750. doi: 10.1002/mrm.10112. [DOI] [PubMed] [Google Scholar]
- 37.Marjanska M, Emir UE, Deelchand DK, Terpstra M. Faster metabolite 1H transverse relaxation in the elder human brain. PLoS One. 2013;8(10):e77572. doi: 10.1371/journal.pone.0077572. [DOI] [PMC free article] [PubMed] [Google Scholar]
- 38.Marjanska M, McCarten JR, Hodges J, et al. Region-specific aging of the human brain as evidenced by neurochemical profiles measured noninvasively in the posterior cingulate cortex and the occipital lobe using 1H magnetic resonance spectroscopy at 7 T. Neuroscience. 2017 Jun 23;354:168–177. doi: 10.1016/j.neuroscience.2017.04.035. [DOI] [PMC free article] [PubMed] [Google Scholar]
- 39.Xin L, Schaller B, Mlynarik V, Lu H, Gruetter R. Proton T1 relaxation times of metabolites in human occipital white and gray matter at 7 T. Magn Reson Med. 2013 Apr;69(4):931–936. doi: 10.1002/mrm.24352. [DOI] [PubMed] [Google Scholar]
- 40.Snoussi K, Gillen JS, Horska A, et al. Comparison of brain gray and white matter macromolecule resonances at 3 and 7 Tesla. Magn Reson Med. 2015 Sep 22;74(3):607–613. doi: 10.1002/mrm.25468. [DOI] [PMC free article] [PubMed] [Google Scholar]
- 41.Schaller B, Xin L, Gruetter R. Is the macromolecule signal tissue-specific in healthy human brain? A 1H MRS study at 7 Tesla in the occipital lobe. Magn Reson Med. 2014 Oct;72(4):934–940. doi: 10.1002/mrm.24995. [DOI] [PubMed] [Google Scholar]
- 42.Povazan M, Hangel G, Strasser B, et al. Mapping of brain macromolecules and their use for spectral processing of 1H-MRSI data with an ultra-short acquisition delay at 7 T. Neuroimage. 2015 Nov 01;121:126–135. doi: 10.1016/j.neuroimage.2015.07.042. [DOI] [PubMed] [Google Scholar]
- 43.Hwang JH, Graham GD, Behar KL, Alger JR, Prichard JW, Rothman DL. Short echo time proton magnetic resonance spectroscopic imaging of macromolecule and metabolite signal intensities in the human brain. Magn Reson Med. 1996 May;35(5):633–639. doi: 10.1002/mrm.1910350502. [DOI] [PubMed] [Google Scholar]