Abstract
Desmoplastic melanoma (DM) is a rare subtype of melanoma characterized by dense fibrous stroma, resistance to chemotherapy and a lack of actionable driver mutations, but is highly associated with ultraviolet light DNA damage.1 We analysed 60 patients with advanced DM treated with programmed cell death 1 (PD-1) or PD-1 ligand (PD-L1) blocking antibody therapy. Objective tumour responses were observed in 42 of the 60 patients (70%, 95% confidence interval 57–81%), including 19 patients (32% overall) with a complete response. Whole-exome sequencing revealed a high mutational load and frequent NF-1 mutations (14 out of 17 cases). Immunohistochemistry (IHC) analysis from 19 DM and 13 non-DM revealed a higher percentage of PD-L1 positive cells in the tumour parenchyma in DM (p = 0.04), highly associated with increased CD8 density and PD-L1 expression in the tumour invasive margin. Therefore, patients with advanced DM derive significant clinical benefit from PD-1/PD-L1 immune checkpoint blockade therapy despite being a cancer defined by its dense desmoplastic fibrous stroma. The benefit is likely derived from the high mutational burden and a frequent pre-existing adaptive immune response limited by PD-L1 expression.
Desmoplastic melanoma (DM) accounts for less than 4% of melanomas. It is characterized histologically by spindle-shaped melanoma cells within abundant collagenous stroma with scattered lymphoid aggregates, with a high mutational burden from ultraviolet light radiation damage.1 Anti-PD-1 antibodies have been approved in many countries for the treatment of advanced melanoma with an overall response rate of 33–40%.2 As recognition of neoantigens resultant from somatic non-synonymous mutations is associated with improved clinical responses to anti-PD-1 and anti-PD-L1 therapy,3–6 we hypothesized that patients with DM may respond well to anti-PD-1 or anti-PD-L1 therapies due to the high mutational load.
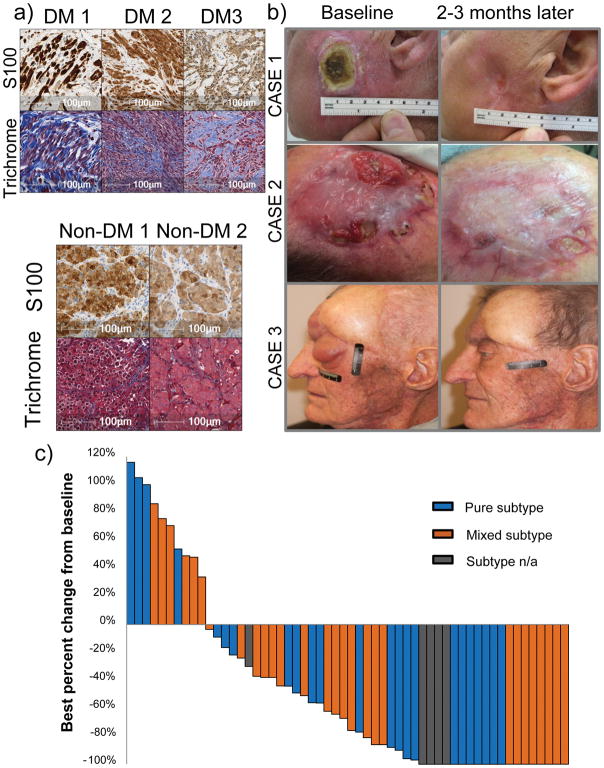
We conducted a retrospective review of the pathology reports from 1058 patients with advanced melanoma treated with anti-PD-1/anti-PD-L1 immunotherapies between 2011 and 2016 at 10 international sites with high volume melanoma clinical trials. We identified 60 patients with advanced unresectable DM who received PD-1/PD-L1 blockade therapy (Extended Data Tables 1 and 2). Thirty-seven patients (62%) had visceral metastases or elevated lactate dehydrogenase (M1c disease), which are recognized makers of poor prognosis.7 Histological sub-classification as pure (n = 25), mixed (n = 30) or indeterminate (n = 5) DM subtypes8 was reported by the local pathologists. All cases had the distinctive diagnostic features of DM with abundant connective tissue surrounding the tumour cells, which can be highlighted by Masson’s trichrome stain (examples in Figure 1a, with the collagenous stroma stained in blue). Central review of the H&E stains of 34 cases by two pathologists revealed that 65% of cases had a significant fibrous stroma (graded 2–3), and that 63% of cases demonstrated lymphoid aggregates within the tumour and/or at the tumour stromal interface (graded 1–3) (Supplementary Table 1). Forty-two patients (70%) had progressed after prior systemic treatment, most frequently with the cytotoxic T lymphocyte antigen-4 (CTLA-4) blocking antibody ipilimumab (Extended Data Tables 1 and Supplementary Table 1). The most frequently administered anti-PD-1/anti-PD-L1 drug was pembrolizumab in 45 (75%) of patients, while eight (13%) received nivolumab, three (5%) the anti-PD-L1 antibody BMS-936559, and an additional three (5%) received a combination of nivolumab or pembrolizumab with ipilimumab.
Figure 1. High response rate to PD-1 blockade in patients with desmoplastic melanoma (DM).
A) Histological examples of three cases of DM compared with two cases of non-desmoplastic cutaneous melanoma (non-DM) stained with Masson’s Trichrome stain to highlight the collagenous stroma characteristic of DM. Top panel: S100 stains (brown). Lower panel: Masson’s trichrome stain (blue collagenous stroma, red cytoplasm and brown nucleus). B) Images of three cases of DM with response to anti-PD-1/L1 therapy. Left: baseline images; right: images while on anti-PD-1 therapy. Of note, case #1 had already been depicted in reference30. C) Waterfall plot of best response on therapy of 56 patients with DM treated with anti-PD-1 or anti-PD-L1 antibodies (data was not available for 4 patients, three who had progressive disease and one who had a partial response).
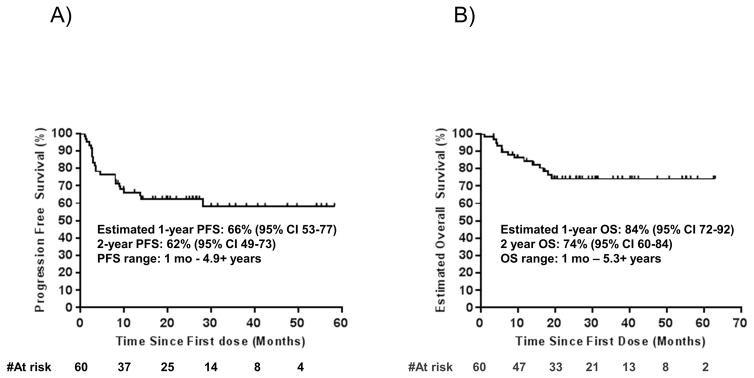
With a median follow up of 22 months, 42 out of the 60 patients (70%, 95% Clopper-Pearson confidence interval of 57 to 81%) had an objective response by RECIST 1.1 criteria (Figure 1b and c). This included 19 (32%) complete responses and 23 (38%) partial responses; nine patients with a partial response eventually progressed but none of the patients with complete response have progressed. When the four patients treated with a combination of anti-PD1 and ipilimumab were excluded, responses were seen in 38 out of 56 (68%) patients. Three patients with isolated progression (including two who had a partial response) underwent surgery and subsequently had no evidence of melanoma with ongoing follow up for over 1.8, 5.2, and 5.3 years, respectively. Median progression free survival and overall survival have not been reached, with estimated 2-year overall survival of 75% (95% confidence interval 65–89) (Extended Data Figure 1a–b). For patients censored in the Kaplan-Meier curve, median follow-up was 27+ months. There were no statistically significant differences in either objective response rate (65% vs 70%), or overall survival between patients with the two DM histological subtypes, pure or mixed. There was also no difference in objective responses based on degree of fibrosis or presence of lymphoid aggregates (Supplementary Table 1).
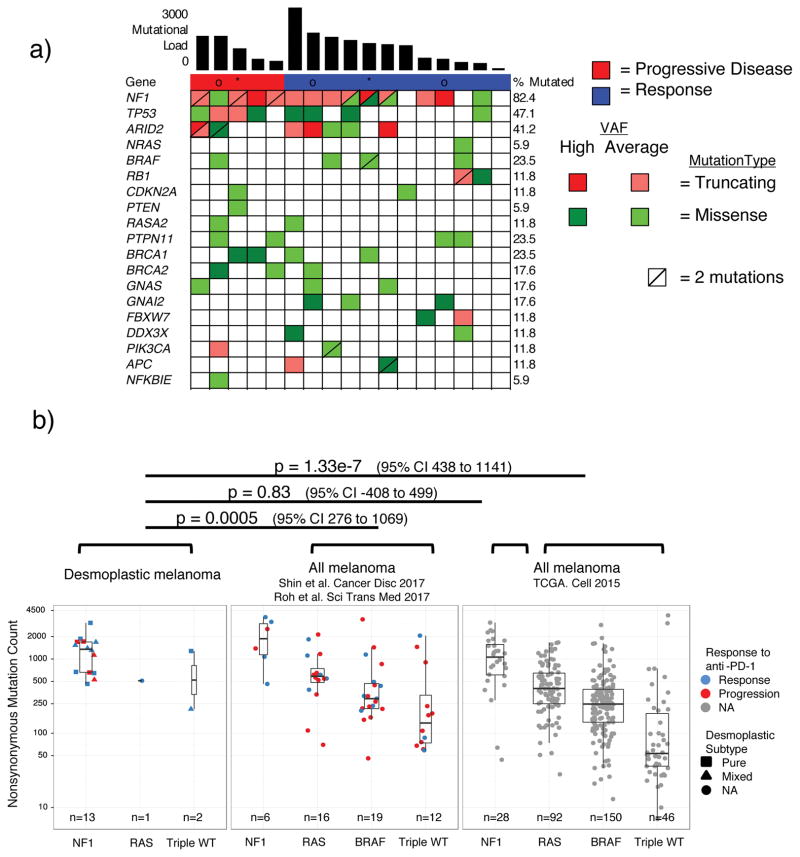
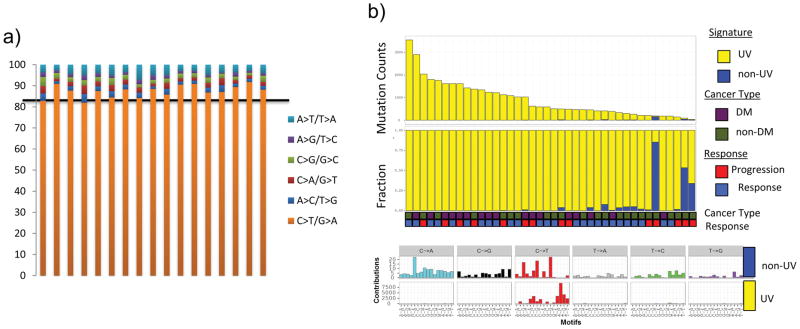
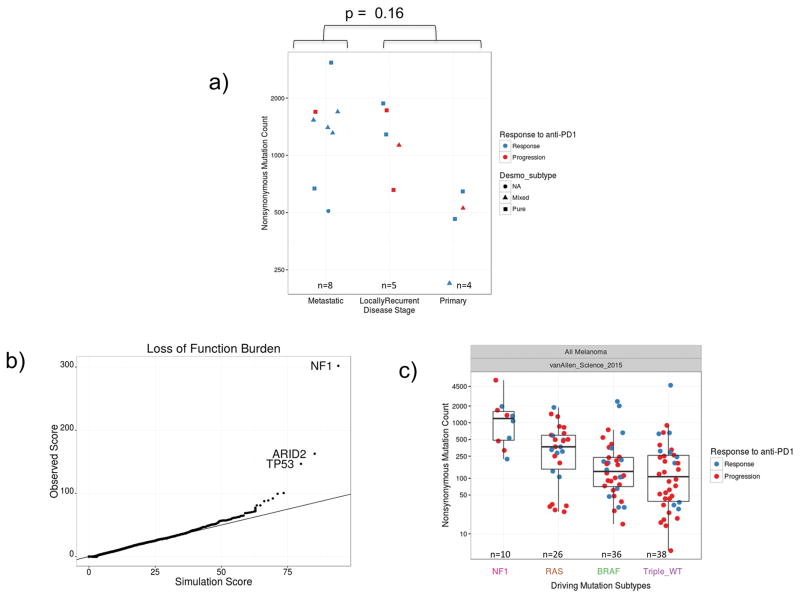
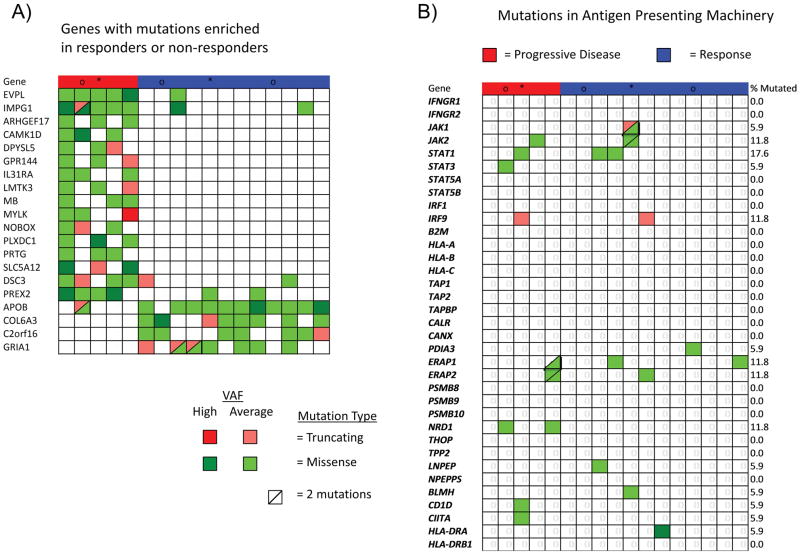
Whole exome sequencing from 17 cases in our DM cohort revealed greater than 82% C>T transitions as part of a strong signature of ultraviolet light induced DNA damage that is common to cutaneous melanoma1,9 (Extended Data Figure 2a–b). There was no difference in mutational load comparing locally advanced and metastatic lesions (Extended Data Figure 3a). Mutations in NF-1 in the absence of BRAF/RAS hotspot mutations were the most common driving genetic event (82.4%, 14/17 samples), along with an enrichment for loss-of-function mutations in TP53 and ARID2 (Figure 2a, Extended Data Figure 3b), similar to previously published series of DM.1,10 These features are also characteristic of NF-1 subtype melanoma, which makes up 8–12% of cutaneous melanoma cases in large cohorts and has more than double the mutational load of NRAS, BRAF or triple wild-type subtypes.11–13 Our DM series had similar mutational load to NF-1 subtype cases (regardless of histological classification) in a combined series from two reports of patients with anti-PD-1 treated advanced melanoma14,15 and in TCGA data. In all three series, NF-1 mutated cases had significantly greater mutational load than the non-NF1 subtypes, but there was no difference on response to PD-1 blockade (Figure 2b). Patients with DM without a response (n=5) showed no difference in mutational load compared with patients with a response (rank sum p = 0.87, Figure 2b), a finding which is also true of two previous anti-PD1 treated cohorts14,15, in contrast to what has been reported in patients with melanoma treated with anti-CTLA416 (Extended Data Figure 3c) or patients with lung and bladder cancer treated with anti-PD-1/L1 therapy.3,6 We did not find any genes mutated more frequently in patients with DM with or without response to therapy (Extended Data Figure 4a), including when doing specific analyses for potential detrimental mutations in the interferon receptor pathway or B2M that may result in innate or acquired resistance to anti-PD-1 therapy (Extended Data Figure 4b).14,17
Figure 2. High mutational load and similarity to NF1 subtype in desmoplastic melanoma (DM).
A) Top bar graph represents mutational load. Tiling plot shows mutations in a given gene (rows) per sample (columns). In the tiling plot, top line represents response, as either primary resistance/progressive disease (red), n=5, or response (partial or complete response and stable disease > 12 months, dark blue), n=12. Colour indicates mutation type, with truncating mutations (frameshift, nonsense, splice-site) in red, missense in green, and synonymous in beige. Darker colour intensity indicates potentially homozygous mutations, with variant allele frequency >1.5 times the sample median. * = biopsy from responding lesion despite a mixed response and eventual progression. o = patient showed no evidence of disease for > 1year after surgical resection of a progressing lesion. B) Non-synonymous mutations determined by whole exome sequencing (WES) from the current DM cohort, two pooled studies of anti-PD1 treated cutaneous melanoma14,15 and TCGA data. Each cohort is split by driver mutation subtype, colour indicates PD1 blockade therapy response (red = progression, blue = response), and shape represents desmoplastic pure vs mixed subtype. In the box plots, line = median, box = 25th/75th percentile, whiskers = highest/lowest value within 1.5*interquartile range. P values = two-sided Wilcoxon-Mann-Whitney rank sum test.
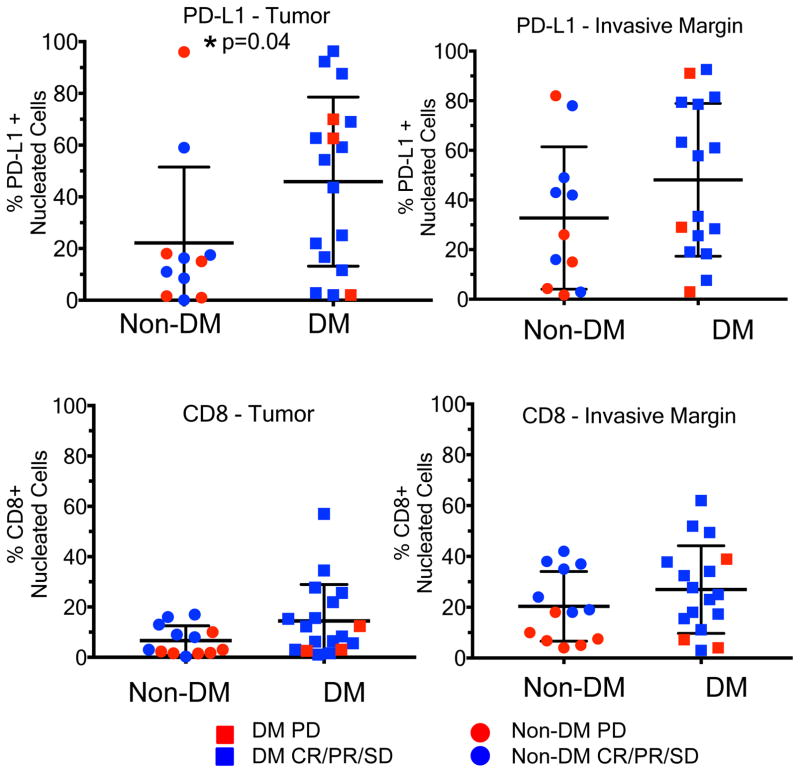
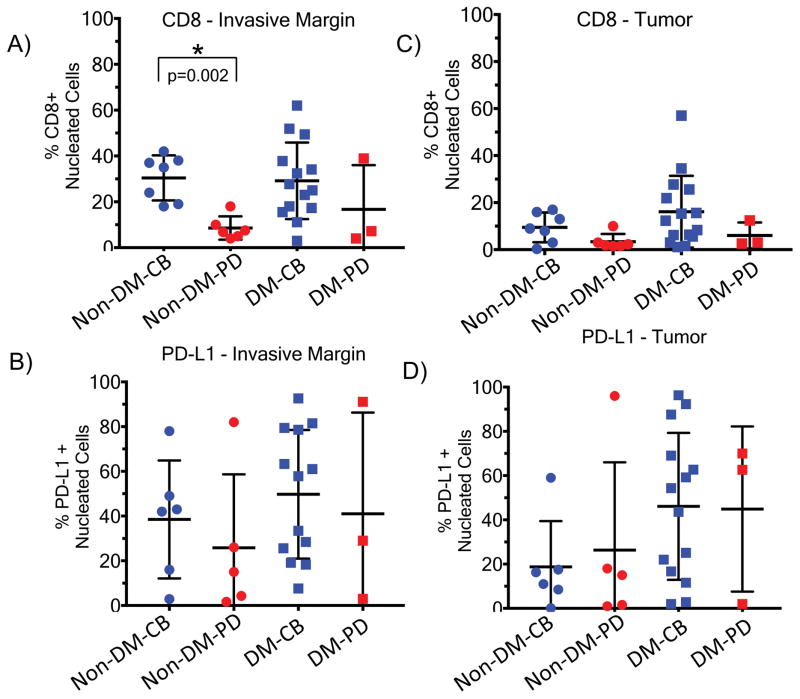
We evaluated whether the presence of CD8+ T cells and PD-L1 in DM was associated with response to anti-PD1/L1 therapy18,19 using 19 available pre-treatment DM tumour biopsies compared to 13 non-DM samples (seven with a complete or partial response, six with progressive disease) using digital quantitative IHC. S100 expression was used to define the invasive tumour margin (stromal-tumour edge) and inside tumour parenchyma (tumour centre) (examples in Extended Data Figure 7f.). Overall, biopsies of patients with DM had a strikingly higher percentage of PD-L1 positive cells in the tumour parenchyma when compared to non-DM cases (p = 0.04, Figure 3a), confirming the same observation when analysing primary DM lesions.20 There were no significant differences in the density of CD8+ cells in the tumour parenchyma, or CD8+ and PD-L1+ cells in the invasive margin (p = 0.12, p = 0.41, p = 0.16, Figure 3b, 3c and 3d). Consistent with our previous observations18, the strongest correlation with clinical benefit (defined as having a complete or partial response, or prolonged stable disease for >12 months) was baseline density of CD8+ T cells in the invasive margin in non-DM melanoma (p=0.002, Extended Data Figure 5a–d).
Figure 3. CD8 density and PD-L1 expression in the tumour parenchyma and invasive margins in biopsies of patients with desmoplastic (DM) and non-desmoplastic cutaneous melanoma (non-DM).
A) PD-L1 staining in the tumour centre (non-DM: 1CR/5PR/5PD; DM: 7CR/6PR/1SD/3PD). B) CD8 staining in the tumour centre (non-DM: 2CR/5PR/6PD; DM: 7CR/7PR/1SD/3PD). C) PD-L1 staining in the invasive margin (non-DM: 1CR/5PR/5PD; DM: 6CR/6PR/1SD/3PD). D) CD8 staining in the invasive margin (non-DM: 2CR/5PR/6PD; DM: 6CR/7PR/1SD/3PD). Percentage of positively stained cells in all nucleated cells are presented. PD: progressive disease; SD: stable disease; CR: complete response; PR: partial response. * Indicates statistical significance. See supplementary table for all statistical analyses.
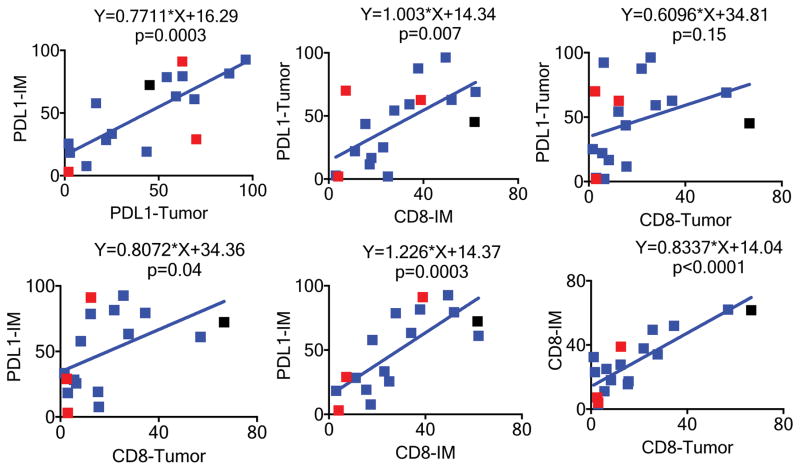
In DM samples, PD-L1 expression in the tumour parenchyma was significantly associated with CD8 density (p=0.007) and PD-L1 expression in the invasive margin (p=0.0003), but not with CD8 density inside of the tumour parenchyma (p=0.15, Extended Data Figure 6). Similarly, PD-L1 expression in the invasive margin was significantly associated with CD8 density in the invasive margin (p=0.0003), CD8 density in the tumour parenchyma (p=0.04), and PD-L1 expression in the tumour parenchyma (p=0.0003). Among DM cases for which we had exome sequencing, we did not detect many of the genetic mechanisms reported to cause constitutive PD-L1 expression, including amplification of the PD-L1/PD-L2/JAK2 (PDJ) locus or MYC, EGFR mutation or amplification, or CDK5 disruption.21–24 The PD-L1 3′ UTR was not well captured in our exome sequencing, and disruption could not be assessed.25 Therefore, the higher PD-L1 expression in DM is likely due to a reactive response to CD8 T cell infiltrates reflective of adaptive immune resistance.26
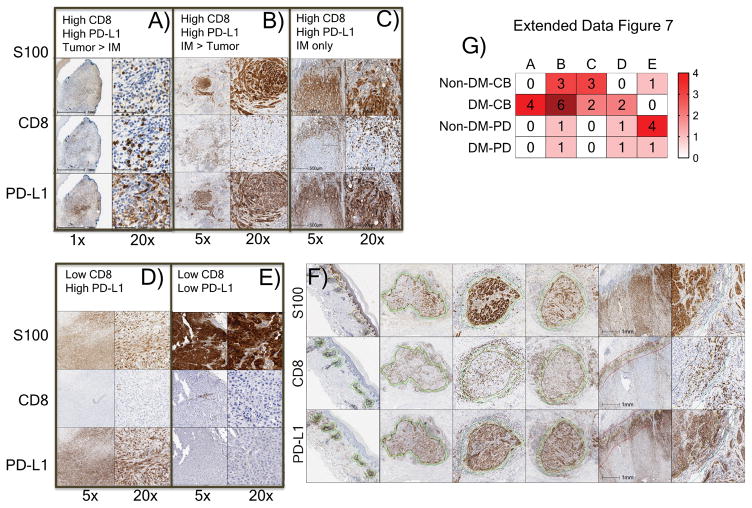
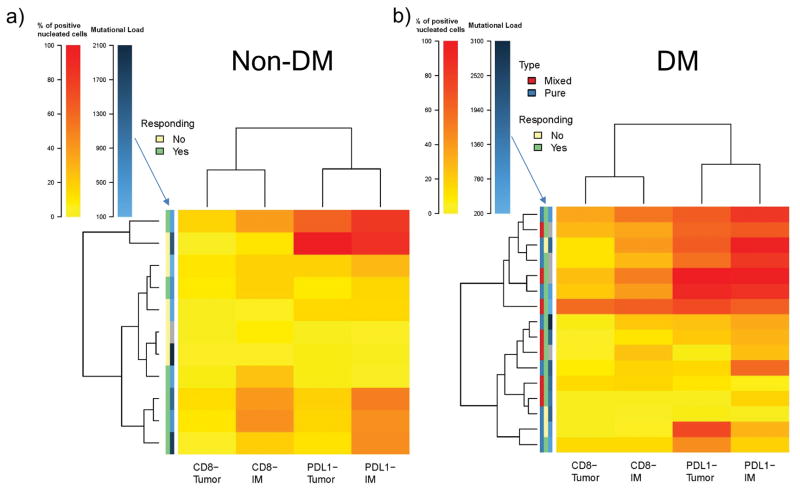
We noted five different patterns of CD8+ cell infiltration and PD-L1 expression in the invasive margin and tumour parenchyma, with most patients responding to therapy having one of the three patterns characterized by high CD8+ T cells (12 out of 14 with DM and six out of seven with non-DM, Extended Data Figure 7a–e). Patients without a tumour response tended to have low CD8+ cells regardless of the status of PD-L1 (Extended Data Figure 7g), although occasionally (two out of nine) patients whose tumours had low baseline CD8 infiltrates responded to therapy. We integrated the data of CD8 and PD-L1 expression in biopsies with response and mutational load, allowing cases of DM and non-DM to self-organize based on this data (Extended Data Figure 9a and b). CD8 and PD-L1 levels were not different between cases with pure or mixed DM histology (Extended Data Figure 9b). Biopsies with higher CD8+ invasive margin density clustered together usually with higher PD-L1 expression both intratumoral and in the invasive margin, and were enriched for patients with an objective tumour response. Mutational load, which was relatively high in all these cases, did not cluster with any particular pattern of CD8 or PD-L1 expression, or with response to therapy.
Dense collagenous stroma as found in DM has been thought to be a major limitation for immune infiltration, as it has been described for pancreatic cancer.27 However, our data challenges this notion, as there are indeed pre-existing T cell infiltrates in the invasive edge of DM lesions, and a much higher response rate to anti-PD1 therapy than any other subtypes of melanoma. In fact, the response rate of 71% is among the highest to single agent PD-1 blockade therapy in any pathologically-defined cancer, together with relapsed Hodgkin’s disease and Merkel cell carcinomas.21,28 Our data suggests that DM, and probably the non-DM NF-1 subtype arising from sun-exposed areas, have a high response rate to PD-1 blockade therapy due to having a more dynamic pre-existing adaptive immune response process.
Supplemental Methods
Analysis of clinical data
To conduct this retrospective analysis, records of 1058 patients with advanced melanoma treated with anti-PD1/PDL1 therapy were reviewed across ten institutions to identify those with a diagnosis of DM. Each institution conducted its own search to find patients who fit these criteria. Study was conducted under Intuitional Review Board approval at each centre and complied with all relevant ethical regulations. All patients had signed a local written informed consent form for research analyses. Consent to obtain photographs was obtained.
Immunohistochemistry (IHC) analyses
Patients were selected for IHC analysis if they had adequate pre-treatment tumour samples and had signed a local written informed consent form for research analyses. Tumour samples were obtained from eight different institutions. Slides cut from frozen or FFPE tissue samples were stained with haematoxylin and eosin, Masson’s Trichrome stain, or anti-S100, anti-CD8, and anti-PD-L1 at the UCLA Anatomic Pathology Immunohistochemistry and Histology Laboratory (CLIA-certified). Antibodies used included rabbit polyclonal S100 (DAKO, 1/1000 dilution, low pH retrieval), CD8 clone C8/144B (Dako, 1/100, low pH retrieval), and PD-L1 (Sp142, 1/200 dilution with High pH retrieval Spring Biosciences, Pleasanton, CA). IHC was performed on Leica Bond III autostainer using Bond ancillary reagents and Refine Polymer Detection system. Slides were examined for the presence of CD8 and PD-L1 within the tumour parenchyma and the connective tissue surrounding the tumour (invasive margin). We defined the invasive margin (or leading edge) as the interfaces between individual tumour bundles and the fibrotic regions, as opposed to the intra-tumour staining, which is within the capsule of individual tumours. All slides were scanned at an absolute magnification of ×200 (resolution of 0.5 μm per pixel). An algorithm was designed based on pattern recognition that quantified immune cells within S100-positive areas (tumour) and S100-negative areas (invasive margin). The algorithm calculated the percentage cellularity (% positive cells/all nucleated cells) using the Halo platform (Indica Labs, Corrales, NM). This analysis system was not able to differentiate between tumour cell or infiltrating immune cell PD-L1 staining.29 Immunohistochemical variables were compared between biopsies of patients who responded or progressed using Wilcoxon-Mann-Whitney test.
Lymphocytic infiltrate and fibrosis analysis
We analyzed available pathological samples from 34 cases to define their lymphoid inflammation and degree of fibrosis. There is no quantitative measure for these readouts, so we used a semiquantitative pathological assessment. Examples of each grade were circulated to pathology reviewers to ensure reproducibility. When available, metastatic lesions were graded by the same schema as primary samples, as not all patients had primary tumor samples available for quantification. The hallmark of lymphoid infiltration in desmoplastic melanoma is the presence of lymphoid nodules within and occasionally surrounding the tumor. Therefore, we developed the grading schema below to describe the location of these nodules within the tumors as follows:
-
0
no lymphoid aggregates
-
1
lymphoid aggregates within tumor
-
2
lymphoid aggregates at tumor-stroma interface
-
3
lymphoid aggregates within tumor and at tumor-stroma interface
A grading schema was also developed to describe the degree of fibrosis in tumors:
-
0
no significant stroma separates tumor cells
-
1
mild increase in fibroblasts and/or myxoid stroma separates tumor cells
-
2
moderate increase in fibroblasts and/myxoid stroma separates tumor cells
-
3
tumor cells separated by abundant fibromyxoid stroma
Genetic analyses
In brief, whole exome sequencing was performed at the UCLA Clinical Microarray Core using the Roche Nimblegen SeqCap EZ Human Exome Library v3.0 targeting 65 Mb of genome. Mutation calling was performed as previously described.14;17 Out of 22 biopsies of DM sequenced, 17 cases (3 complete responses, 8 partial responses, 1 stable disease, 5 progressive disease) could be analysed by meeting quality control criteria for minimum coverage (50x tumour, 30x normal), tumour content (10%), and effective depth (12x purity*coverage, representing >80% probability to detect heterozygous mutations with at least 4 reads). These were compared with exome sequencing from the TCGA13, a prior DM cohort1, and two anti-PD-1 monotherapy treated cohorts, one from our group14 with 23 cases which included a mix of responders and non-responders, and the second a subset of 30 patients post-CTLA-4 non-response. From that cohort to include one sample per patient, we excluded on-treatment samples in the setting of response; then we selected the biopsy with the highest tumour purity, regardless of timepoint, since most patients with >1 biopsy had <10% variance in their mutational loads. Response was defined as CR, PR, or SD >12 months by RECIST1.1 in both cohorts. Mutation calling methods between cohorts all used MuTect at their core, and only non-synonymous mutations (Nonsense, Missense, Splice_Site, Frameshift indels, In-frame indels, Start_Codon indels or SNPs, and Stoploss/Nonstop variants) were assessed to minimize differences between exon-capture kits. An additional filter was applied to all data sets to exclude mutations at sites of known germline variation with an allele frequency >0.0005 in the Exome Aggregation Consortium (ExAC) database v0.3.1. Tumour purity was estimated by Sequenza, or as 2 * median variant allele frequency if less than 30%. Loss-of-function burden was determined using the LOF SIgRank algorithm1, with the simulation run for 1000 iterations and synonymous mutations for background mutation rate defined as silent, 3′UTR, 5′UTR, or exon-flanking intronic mutations. Single nucleotide variants and their flanking contexts were analysed for mutation signatures for the DM and UCLA non-DM14 cohorts together using a published tool.9
Statistical analyses
Kaplan-Meier method and Greenwood’s formula were used for the estimation of survival probabilities (survival rates and overall survival) and the corresponding 95% confidence intervals (CIs). Progression-free survival was defined from start of treatment to disease progression or death from any cause. Overall survival was defined from start of treatment to death from any cause. The objective response rate was reported as proportion along with Clopper-Pearson exact CIs. The chi-square and Fisher’s exact test were used to test for differences between groups for categorical variables. The Wilcoxon-Mann-Whitney rank sum test was used to compare mutation rate between groups. Statistical analyses of the pathological data were performed using GraphPad Prism and mutation data using R v3.2.5. All tests were two-sided; P values < 0.05 were considered statistically significant.
Data availability
Whole-exome sequencing data has been deposited in the National Center for Biotechnology Information (NCBI) dbGaP with accession number PHS001469. All other data is available from the authors on reasonable request.
Extended Data
Extended Data Figure 1. Survival data of the desmoplastic melanoma cohort.
A) Progression free survival (PFS), n = 60, median not reached. B) Overall survival (OS), n=60, median not reached.
Extended Data Figure 2. Ultraviolet light DNA damage signature in the desmoplastic melanoma cohort.
A) Cumulative percentage per DM sample (n=17) of single nucleotide mutations by transition/transversion substitution. B) Mutation signature analysis9 on combined DM (n=17) and non-DM (n=23) cohort.14 All show the predominant C>T rich signature 7 characteristic of UV damage.
Extended Data Figure 3. Mutational analysis in the desmoplastic melanoma cohort.
A) Analysis of mutational load in samples obtained from primary locally advanced cases and metastatic lesions. Two sided Wilcoxon-Mann-Whitney rank sum test, p = 0.16 (95% CI −171 to 1175). B) Scores from the loss-of-function (LOF) SigRank algorithm1 show enrichment for LOF mutations (nonsense, frameshift, splice-site or damaging missense) compared to the expected number based on the rate of LOF mutations in the cohort. Solid line corresponds to observed/expected ratio of 1.0. C) Mutational load in the vanAllen16 anti-CTLA4 treated cohort separated by driver subtype and coloured by response. In the box plots, line = median, box = 25th/75th percentile, whiskers = highest/lowest value within 1.5*interquartile range.
Extended Data Figure 4. Mutations in antigen presenting machinery or enriched by response in the desmoplastic melanoma cohort.
A) Mutations in genes enriched in responders (n=12) (blue) or non-responders (n=5) (red). Shown are genes with p < 0.05 by unadjusted two-sided Fisher’s exact test of samples with or without a non-synonymous mutation between responders and non-responders. B) Mutations in antigen presenting machinery genes. P-values = Unadjusted Fisher exact test of number of samples with a non-synonymous mutation per gene, cutoffs 0.015 for and 0.05. Tiling plot shows mutations in a given gene (rows) per sample (columns). Colour indicates mutation type, with truncating mutations (frameshift, nonsense, splice-site) in red, missense in green, and synonymous in beige. Darker colour intensity indicates potentially homozygous mutations, with variant allele frequency >1.5 times the sample median.
Extended Data Figure 5. CD8 density and PD-L1 expression in the tumour parenchyma and invasive margins in biopsies of patients with desmoplastic and non-desmoplastic melanoma.
A) CD8 staining in the invasive margin. B) PD-L1 staining in the invasive margin. C) CD8 staining in the tumour centre. D) PD-L1 staining in the tumour centre. Percentage of positively stained cells in all nucleated cells are presented. CB: clinical benefit; PD: progressive disease; SD: stable disease; CR: complete response; PR: partial response. All calculations used two-sided Mann-Whitney rank sum test. See supplementary table for all statistical analyses. * Indicates statistical significance.
Extended Data Figure 6. Correlation of CD8 and PD-L1 in the invasive margin or tumour parenchyma in desmoplastic melanoma.
IM: Invasive margin; Centre: tumour centre. Black square: This sample was from a patient who had a great response in the lesion biopsied (analyzed) but was found to have brain metastasis shortly after treatment started. See supplementary table for further statistical analyses.
Extended Data Figure 7. Patterns of CD8 infiltration and PD-L1 expression in biopsies of patients with desmoplastic melanoma (DM) and non-desmoplastic cutaneous melanoma (non-DM).
Using cut off of >10% for high CD8 density in either parenchyma or invasive margins and >15% for high PD-L1 expression, five different patterns were identified: A) High CD8 density, high PD-L1 tumour parenchyma > invasive margins. B) High CD8 density, high PD-L1 invasive margins > tumour parenchyma. C) High CD8 density, high PD-L1 in the invasive margins only. D) Low CD8 density, high PD-L1. E) Low CD8 density, low PD-L1 expression. F) Yellow lines delineated the edges of tumour regions determined by positive S100 staining. Green or red lines marked the invasive margins around the tumour edges. All analysis was done with the HALO software (Indica Labs). G) Heat map summary of patterns of CD8 and PD-L1 expression in biopsies of patients with DM and CM based on their response to therapy with anti-PD-1/L1; CB: clinical benefit; PD: progressive disease. Intensity of colour coding indicates number of cases in each category. All calculations were based on the scanned whole tumor images.
Extended Data Figure 8. Hierarchical clustering of cases of desmoplastic melanoma and non-desmoplastic cutaneous melanoma based on CD8 and PD-L1 expression in the invasive margin and tumour parenchyma.
A) Non-desmoplastic cutaneous melanomas (n=13), with the y axis colour coded for response and mutational load. B) Desmoplastic melanomas (n=19), with the additional information of differentiation between pure (red) and mixed (blue) histology in the y axis. For mutational load, darker squares correspond to higher mutational load. Gray squares are missing data points.
Extended Data Table 1.
Summary of patient characteristics
| Characteristics (n=60) | N (%) |
|---|---|
| Age (median/range) | 71 (26–86) |
| Gender (male) | 50 (83%) |
| Stage IIIC | 2 (3%) |
| Stage IV | |
| M1a | 3 (5%) |
| M1b | 20 (33%) |
| M1c | 35 (58%) |
| Desmoplastic subtype | |
| Pure | 25 (42%) |
| Mixed | 30 (50%) |
| Unknown | 5 (8%) |
| BRAF V600 mutation (+) | 1 (2%) |
| ECOG | |
| 0 | 29 (50%) |
| 1 | 29 (50%) |
| 2 | 1 (2%) |
| LDH | |
| Elevated | 12 (20%) |
| Normal | 48 (80%) |
| Sites of metastases (may have multiple) | |
| Brain | 3 (5%) |
| Lung | 34 (57%) |
| Liver | 20 (33%) |
| Bone | 13 (22%) |
| Prior lines of therapy for metastatic disease | |
| 0 | 18 (30%) |
| 1 | 31 (52%) |
| 2 | 11 (18%) |
| Prior ipilimumab therapy | 30 (50%) |
| Response rate to prior ipilimumab therapy | 2 (7%) |
Expanded Data Table 2.
Summary of systemic drug treatments received by each patient
| Treatment Received (n=60) | N (%) |
|---|---|
| Pembrolizumab | |
| 2 mg/kg | 33 (55%) |
| 10 mg/kg | 10 (17%) |
| Dose not known | 2 (3%) |
| Nivolumab | |
| 0.1 mg/kg | 2 (3%) |
| 3 mg/kg | 5 (8%) |
| 10 mg/kg | 1 (2%) |
| Nivolumab (1 mg/kg) + ipilimumab (3 mg/kg) | 3 (5%) |
| Pembrolizumab (2 mg/kg) + ipilimumab (1 mg/kg) | 1 (2%) |
| BMS-936559 (anti-PDL1) | |
| 0.1 mg/kg | 1 (2%) |
| 0.3 mg/kg | 2 (3%) |
| Cycles of therapy (median/range) | 12 (1–73) |
| Length of follow-up (median) | 22 months |
| Time to best response (median) | 4 months |
| Duration of response (median) | 17 months |
| Received subsequent systemic therapy | 4 (7%) |
| Received surgical excision for isolated progression | 3 (5%) |
Supplementary Material
Acknowledgments
This study was funded in part by the Grimaldi Family Fund, the Parker Institute for Cancer Immunotherapy, NIH grants R35 CA197633 and P01 CA168585, the Ressler Family Fund, the Samuels Family Fund and the Garcia-Corsini Family Fund (to A.R.). Z.E. was supported in part by the Moffitt Cancer Center NCI Skin SPORE (5P50CA168536) and Moffitt’s Total Cancer Care Initiative and Collaborative Data Services (P30-CA076292) for this work. J.M.Z. is part of the UCLA Medical Scientist Training Program supported by NIH training grant GM08042. S.H-L. was supported by a Young Investigator Award and a Career Development Award from the American Society of Clinical Oncology (ASCO), a Tower Cancer Research Foundation Grant, and a Dr. Charles Coltman Fellowship Award from the Hope Foundation. We acknowledge the Translational Pathology Core Laboratory (TPCL) and Rongqing Guo, Wang Li, Jia Pang and Mignonette H. Macabali from UCLA for blood and biopsy processing, and Xinmin Li, Ling Dong, Janice Yoshizawa, and Jamie Zhou from the UCLA Clinical Microarray Core for sequencing expertise. GVL supported is by an NHMRC Fellowship and The University of Sydney Medical Foundation. RAS is supported by an NHMRC Fellowship.
Footnotes
Author Contributions. Z.E., J.M.Z., S.H-L. and A.R. developed the concepts. Z.E., S.H-L, J.M.Z., and A.R. designed the experiments. Z.E., J.M.Z., S.H-L. and A.R. interpreted the data. S.H-L., P.S. and Z.E. performed IHC analyses. J.M.Z. performed genomic analyses. A.R., B.C., Z.E., A.A., D.J., E.L., B.K., R.M., S.R., J.A., R.J., M.P., M.S.C, W.H., and G.V.L. clinically evaluated patients and contributed tumour samples. R.A.S., J.M., and A.C. evaluated tumour samples. P.F.G. conducted the heat map analysis. C.W. evaluated the CM clinical data. Z.E., J.M.Z., S.H-L. and A.R. wrote the manuscript. S.H-L. and A.R. supervised the project. All authors contributed to the manuscript and approved the final version.
Supplementary information is available in the online version of the paper.
Authors declare no completing financial interests.
References
- 1.Shain AH, et al. Exome sequencing of desmoplastic melanoma identifies recurrent NFKBIE promoter mutations and diverse activating mutations in the MAPK pathway. Nature genetics. 2015;47:1194–1199. doi: 10.1038/ng.3382. [DOI] [PMC free article] [PubMed] [Google Scholar]
- 2.Ribas A, et al. Association of Pembrolizumab With Tumor Response and Survival Among Patients With Advanced Melanoma. Jama. 2016;315:1600–1609. doi: 10.1001/jama.2016.4059. [DOI] [PubMed] [Google Scholar]
- 3.Rizvi NA, et al. Cancer immunology. Mutational landscape determines sensitivity to PD-1 blockade in non-small cell lung cancer. Science (New York, NY) 2015;348:124–128. doi: 10.1126/science.aaa1348. [DOI] [PMC free article] [PubMed] [Google Scholar]
- 4.Le DT, et al. PD-1 Blockade in Tumors with Mismatch-Repair Deficiency. The New England journal of medicine. 2015;372:2509–2520. doi: 10.1056/NEJMoa1500596. [DOI] [PMC free article] [PubMed] [Google Scholar]
- 5.Hugo W, et al. Genomic and Transcriptomic Features of Response to Anti-PD-1 Therapy in Metastatic Melanoma. Cell. 2016;165:35–44. doi: 10.1016/j.cell.2016.02.065. [DOI] [PMC free article] [PubMed] [Google Scholar]
- 6.Rosenberg JE, et al. Atezolizumab in patients with locally advanced and metastatic urothelial carcinoma who have progressed following treatment with platinum-based chemotherapy: a single-arm, multicentre, phase 2 trial. Lancet (London, England) 2016;387:1909–1920. doi: 10.1016/S0140-6736(16)00561-4. [DOI] [PMC free article] [PubMed] [Google Scholar]
- 7.Han D, et al. Clinicopathologic predictors of survival in patients with desmoplastic melanoma. PloS one. 2015;10:e0119716. doi: 10.1371/journal.pone.0119716. [DOI] [PMC free article] [PubMed] [Google Scholar]
- 8.Busam KJ, et al. Cutaneous desmoplastic melanoma: reappraisal of morphologic heterogeneity and prognostic factors. The American journal of surgical pathology. 2004;28:1518–1525. doi: 10.1097/01.pas.0000141391.91677.a4. [DOI] [PubMed] [Google Scholar]
- 9.Alexandrov LB. Signatures of mutational processes in human cancer. 2013;500:415–421. doi: 10.1038/nature12477. [DOI] [PMC free article] [PubMed] [Google Scholar]
- 10.Wiesner T, et al. NF1 Mutations are Common in Desmoplastic Melanoma. The American journal of surgical pathology. 2015;39:1357–1362. doi: 10.1097/pas.0000000000000451. [DOI] [PMC free article] [PubMed] [Google Scholar]
- 11.Krauthammer M, et al. Exome sequencing identifies recurrent mutations in NF1 and RASopathy genes in sun-exposed melanomas. Nature genetics. 2015;47:996–1002. doi: 10.1038/ng.3361. http://www.nature.com/ng/journal/v47/n9/abs/ng.3361.html#supplementary-information. [DOI] [PMC free article] [PubMed] [Google Scholar]
- 12.Hayward NK, et al. Whole-genome landscapes of major melanoma subtypes. Nature. 2017 doi: 10.1038/nature22071. advance online publication http://www.nature.com/nature/journal/vaop/ncurrent/abs/nature22071.html#supplementary-information. [DOI] [PubMed]
- 13.Akbani R, et al. Genomic Classification of Cutaneous Melanoma. Cell. 161:1681–1696. doi: 10.1016/j.cell.2015.05.044. [DOI] [PMC free article] [PubMed] [Google Scholar]
- 14.Shin DS, et al. Primary Resistance to PD-1 Blockade Mediated by JAK1/2 Mutations. Cancer discovery. 2017;7:188–201. doi: 10.1158/2159-8290.cd-16-1223. [DOI] [PMC free article] [PubMed] [Google Scholar]
- 15.Roh W, et al. Integrated molecular analysis of tumor biopsies on sequential CTLA-4 and PD-1 blockade reveals markers of response and resistance. Science translational medicine. 2017;9 doi: 10.1126/scitranslmed.aah3560. [DOI] [PMC free article] [PubMed] [Google Scholar]
- 16.Van Allen EM, et al. Genomic correlates of response to CTLA-4 blockade in metastatic melanoma. Science (New York, NY) 2015;350:207–211. doi: 10.1126/science.aad0095. [DOI] [PMC free article] [PubMed] [Google Scholar]
- 17.Zaretsky JM, et al. Mutations Associated with Acquired Resistance to PD-1 Blockade in Melanoma. The New England journal of medicine. 2016;375:819–829. doi: 10.1056/NEJMoa1604958. [DOI] [PMC free article] [PubMed] [Google Scholar]
- 18.Tumeh PC, et al. PD-1 blockade induces responses by inhibiting adaptive immune resistance. Nature. 2014;515:568–571. doi: 10.1038/nature13954. [DOI] [PMC free article] [PubMed] [Google Scholar]
- 19.Daud AI, et al. Programmed Death-Ligand 1 Expression and Response to the Anti-Programmed Death 1 Antibody Pembrolizumab in Melanoma. Journal of clinical oncology: official journal of the American Society of Clinical Oncology. 2016;34:4102–4109. doi: 10.1200/jco.2016.67.2477. [DOI] [PMC free article] [PubMed] [Google Scholar]
- 20.Frydenlund N, et al. Tumoral PD-L1 expression in desmoplastic melanoma is associated with depth of invasion, tumor-infiltrating CD8 cytotoxic lymphocytes and the mixed cytomorphological variant. Modern pathology: an official journal of the United States and Canadian Academy of Pathology, Inc. 2017;30:357–369. doi: 10.1038/modpathol.2016.210. [DOI] [PubMed] [Google Scholar]
- 21.Ansell SM, et al. PD-1 blockade with nivolumab in relapsed or refractory Hodgkin’s lymphoma. The New England journal of medicine. 2015;372:311–319. doi: 10.1056/NEJMoa1411087. [DOI] [PMC free article] [PubMed] [Google Scholar]
- 22.Akbay EA, et al. Activation of the PD-1 pathway contributes to immune escape in EGFR-driven lung tumors. Cancer discovery. 2013;3:1355–1363. doi: 10.1158/2159-8290.CD-13-0310. [DOI] [PMC free article] [PubMed] [Google Scholar]
- 23.Casey SC, et al. MYC regulates the antitumor immune response through CD47 and PD-L1. Science (New York, NY) 2016;352:227–231. doi: 10.1126/science.aac9935. [DOI] [PMC free article] [PubMed] [Google Scholar]
- 24.Dorand RD, et al. Cdk5 disruption attenuates tumor PD-L1 expression and promotes antitumor immunity. Science (New York, NY) 2016;353:399–403. doi: 10.1126/science.aae0477. [DOI] [PMC free article] [PubMed] [Google Scholar]
- 25.Kataoka K, et al. Aberrant PD-L1 expression through 3′-UTR disruption in multiple cancers. Nature. 2016;534:402–406. doi: 10.1038/nature18294. [DOI] [PubMed] [Google Scholar]
- 26.Pardoll DM. The blockade of immune checkpoints in cancer immunotherapy. Nature reviews. Cancer. 2012;12:252–264. doi: 10.1038/nrc3239. [DOI] [PMC free article] [PubMed] [Google Scholar]
- 27.Jiang H, et al. Targeting focal adhesion kinase renders pancreatic cancers responsive to checkpoint immunotherapy. Nature medicine. 2016;22:851–860. doi: 10.1038/nm.4123. [DOI] [PMC free article] [PubMed] [Google Scholar]
- 28.Nghiem PT, et al. PD-1 Blockade with Pembrolizumab in Advanced Merkel-Cell Carcinoma. New England Journal of Medicine. 2016;374:2542–2552. doi: 10.1056/NEJMoa1603702. [DOI] [PMC free article] [PubMed] [Google Scholar]
- 29.Rittmeyer A, et al. Atezolizumab versus docetaxel in patients with previously treated non-small-cell lung cancer (OAK): a phase 3, open-label, multicentre randomised controlled trial. The Lancet. 389:255–265. doi: 10.1016/S0140-6736(16)32517-X. [DOI] [PMC free article] [PubMed] [Google Scholar]
- 30.Hamid O, et al. Safety and Tumor Responses with Lambrolizumab (Anti–PD-1) in Melanoma. New England Journal of Medicine. 2013;369:134–144. doi: 10.1056/NEJMoa1305133. [DOI] [PMC free article] [PubMed] [Google Scholar]
Associated Data
This section collects any data citations, data availability statements, or supplementary materials included in this article.
Supplementary Materials
Data Availability Statement
Whole-exome sequencing data has been deposited in the National Center for Biotechnology Information (NCBI) dbGaP with accession number PHS001469. All other data is available from the authors on reasonable request.


