

Abstract
Non-structural carbohydrates (NSC) play important roles in adapting to environments in plants. Despite extensive research on the seasonal dynamics and species differences of NSC, the relative contributions of season and species to NSC is not well understood. We measured the concentration of starch, soluble sugar, NSC, and the soluble sugar:starch ratio in leaves, twigs, trunks and roots of twenty dominant species for dry and wet season in monsoon broad-leaved evergreen forest, respectively. The majority of concentration of NSC and starch in the roots, and the leaves contained the highest concentration of soluble sugar. A seasonal variation in starch and NSC concentrations higher in the dry season. Conversely, the wet season samples had higher concentration of soluble sugar and the sugar:starch ratio. Significant differences exist for starch, soluble sugar and NSC concentrations and the sugar:starch ratio across species. Most species had higher starch and NSC concentrations in the dry season and higher soluble sugar concentration and the sugar:starch ratio in wet season. Repeated variance analysis showed that starch and NSC concentrations were strongly affected by season although the effect of seasons, species, and the interaction of the two on the starch, soluble sugar, and NSC concentrations were significant.
Introduction
Non-structural carbohydrates (NSC) are the primary photosynthates and the key regulators of the physiological adjustment of plants to environmental stress1–4. In addition, NSC provide substrates for growth and metabolism5,6 and therefore play vital roles in plant’s life processes7. The NSC level of a plant is an important indicator of the carbon source and sink capacity of vegetation8–10, and can further inform on plant growth3, buffering capacity, and adaptation strategies11. Hence, quantitative studies of the contribution of NSC to the carbon balance are of crucial importance to understand the survival and growth of plants.
The amounts of non-structural carbohydrates exhibit seasonal trends in order to adapt to seasonal resource variation, such as water, light, temperature, and nutrient availability. Seasonal dynamics of NSC have been studied extensively in most of forest ecosystems. Hoch12 reports the highest concentrations in starch, soluble sugar, and NSC in leaves in early summer for deciduous species. In contrast, evergreen conifer trees had hardly any change for soluble sugar in leaves throughout the season. Similarly, the NSC in stem sapwood varied very little throughout the season12. While yellow birch and sugar maple seedlings had the highest total NSC and starch by the end of the growing season13. In Mediterranean regions, NSC concentration of deciduous Aesculus californica dropped during fruit production in fall and re-growth in early spring, whereas evergreen Quercus agrifolia showed little change throughout the year14. For the tropical forests, Würth et al.2 reports NSC showed a dry season (dormant period) maximum and a wet season (growing season) minimum in 17 tropical trees. Newell et al.15 also reports the highest NSC concentrations in dormant period for tropical pioneer species, whereas later succession evergreen species showed smaller or non-significant seasonal changes in NSC concentration. In subtropical regions, Bullock16 found the NSC of Jacaratia mexicana in stem increased in the end of the rainy season, whereas Spondias purpurea showed little change throughout the year. Although seasonal variation in NSCs concentrations is well-documented in most of forest ecosystems, the seasonal trend of NSCs continues to be a subject of active research and some controversy and the relative contributions of seasonal effects to the dynamics of NSC are not well understood.
The dynamics and concentration of NSC display differences across species within the same region that is related to their different life forms or ecological strategies15,17–20. The concentrations of NSC and their components differed significantly among species and tissues for three temperate tree species in Northeast China21. Similar results were found among other temperate species12,13,22,23, Mediterranean species20, and tropical species2, but the dynamics of NSC also display species specific difference. Several authors have reported differences in the carbohydrate dynamics of deciduous and evergreen species15, and most often evergreen species display less dramatic seasonal fluctuations of their carbohydrate reserves than deciduous species12. In deciduous plants, NSC is mobilized from the perennial structures to support tissue growth and respiration in early spring, resulting in decreased concentrations of NSC in these storage organs24. In woody plants, sugars accumulate from autumn to winter25. It has been observed that maximum sugar concentrations are found in poplars in the winter26,27. In some herbaceous plants, researchers have also found that changes in sugar concentrations are correlated with season22. Therefore, The concentration and dynamics of NSC may be influenced by the species and their taxonomic relationships28.
Although NSC seasonal dynamics and species differences in tropical, temperate and Mediterranean forests ecosystems have been studied, the effect of season and species on NSC have not been well characterized in subtropical forests ecosystems. Most evergreen species should display less dramatic seasonal fluctuations in NSC because seasonal variation in carbon gain may be less common for evergreen species in subtropical forests than in temperate forests. In this study, we hypothesize that the NSC in the subtropical monsoon broad-leaved evergreen forest exhibits the greatest seasonal changes due to seasonal precipitation reduction. Precipitation chiefly occurs in the wet season between May and October, and not as frequently during the dry season (from November to April) in Pu’er region of Yunnan Province, China29. We also hypothesize that: (1) greatest species fluctuations in NSC concentrations will occur, and (2) the effect of season on the NSC will be higher than species because all species are affected by the season. These hypotheses were tested by seasonally measuring NSC and its component concentrations in leaves, twigs, trunks and roots of twenty of the most abundant species growing in the subtropical monsoon broad-leaved evergreen forest of Yunnan Province, China. The repeated measures analysis of variance was used to distinguish the effect of season and species on NSC, which allows for a more detailed picture of the effect of season and species on NSC.
Results
NSC allocation among tissues
Starch, soluble sugar and NSC concentrations varied significantly among four tissues across all seasons (Fig. 1). The highest starch and NSC concentrations were found in the roots, while the leaves had the lowest starch concentrations. No significant differences were found for starch concentrations between twigs and trunks and for NSC concentrations among leaves, twigs and trunks (p > 0.05). The largest soluble sugar concentration was found to be in the leaves, closely followed by twigs and then roots, and lastly trunks; there were no significant differences between twigs and roots (p > 0.05).
Figure 1.
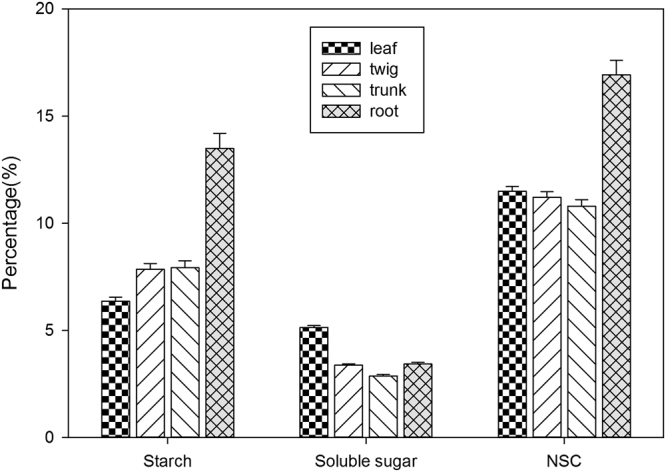
The concentration of starch, soluble sugar, and non-structural carbohydrates for the leaves, twigs, trunks and roots across all seasons.
Seasonal differences for NSC
Dramatic variation in the concentration of starch, soluble sugar and NSC and the ratio of soluble sugar to starch occurred between dry and wet seasons (Table 1). The dry season had the higher concentrations of starch and NSC than the wet season. However, the concentration of soluble sugar and the ratio of soluble sugar to starch were higher in the wet season than dry season (Table 1).
Table 1.
Changes of starch, soluble sugar, non-structural carbohydrates, and the ratio of soluble sugar to starch in different seasons. Different letters in the same row indicate significant differences after Bonferroni’s post-hoc test (p < 0.05).
| Indicators | Seasons | Mean ± SE(%) |
|---|---|---|
| Starch | Dry season | 13.76 ± 0.33a |
| Wet season | 3.52 ± 0.07b | |
| Soluble sugar | Dry season | 3.28 ± 0.07a |
| Wet season | 4.16 ± 0.05b | |
| NSC | Dry season | 17.05 ± 0.33a |
| Wet season | 7.69 ± 0.09b | |
| The ratio of soluble sugar to starch | Dry season | 0.42 ± 0.03a |
| Wet season | 1.51 ± 0.03b |
Significant seasonal differences were found for the concentration of starch, soluble sugar and NSC and the ratio of soluble sugar to starch in four tissues (leaf, twig, trunk and root) (Fig. 2). The concentration of starch and NSC were higher in the dry season than in wet season for all four tissues. But the concentration of soluble sugar and the ratio of soluble sugar to starch were higher in the wet season than in dry season for all four tissues except for the concentration of soluble sugar in leaf (Fig. 2).
Figure 2.

The concentration of starch, soluble sugar, and non-structural carbohydrates and the ratio of soluble sugar to starch for the leaves, twigs, trunks and roots in dry season and wet season, open bars represent the dry season, and the closed bars are the wet season, ** and *** indicate significant difference at the 0.01 level and the 0.001 level, respectively.
Species differences for NSC
Significant differences existed among species for the concentration of starch (F = 3.709, p < 0.000), soluble sugar (F = 7.398, p < 0.000) and NSC (F = 5.125, p < 0.000) and the ratio of soluble sugar to starch (F = 4.653, p < 0.000, Table 2). The concentration of starch, soluble sugar and NSC and the ratio of soluble sugar to starch changes from 5.08% (Phoebe puwenensis) to 11.59% (Tarennoidea wallichii), 2.86% (Glochidion lanceolarium) to 4.84% (Tarennoidea wallichii), 8.35% (Phoebe puwenensis) to 16.43% (Tarennoidea wallichii) and 0.54 (Phoebe puwenensis) to 1.49 (Lithocarpus truncatus), respectively and the mean are 8.90%, 3.70%, 12.60% and 0.94, respectively.
Table 2.
The concentrations of starch, soluble sugar, and non-structural carbohydrates and the ratio of soluble sugar to starch for twenty species sampled in this study. 1-Glochidion lanceolarium, 2-Castanopsis calathiformis, 3-Anneslea fragrans, 4-Castanopsis hystrix, 5-Lithocarpus grandifolius, 6-Lasianthus chinensis, 7-Machilus robusta, 8-Gordonia axillaris, 9-Castanopsis echidnocarpa, 10-Olea rosea, 11-Schima wallichii, 12-Litsea rubescens, 13-Pithecellobium clypearia, 14-Lithocarpus fenestratus, 15-Lithocarpus truncatus, 16-Tarennoidea wallichii, 17-Aporusa villosa, 18-Rapanea neriifolia, 19-Phoebe puwenensis, 20-Litsea panamonja. Different letter indicates significant difference at p = 0.05 level.
| Species serial number | Starch(%) | Soluble sugar(%) | NSC(%) | The ratio of soluble sugar to starch |
|---|---|---|---|---|
| 1 | 7.35 ± 1.09abc | 2.86 ± 0.24a | 10.21 ± 1.07ab | 0.71 ± 0.16abc |
| 2 | 8.38 ± 0.90abc | 3.42 ± 0.15ac | 11.80 ± 0.89ab | 0.79 ± 0.07abc |
| 3 | 8.63 ± 0.62bc | 4.61 ± 0.18be | 13.24 ± 0.65ac | 1.04 ± 0.07a |
| 4 | 8.35 ± 0.65 abc | 3.46 ± 0.12ac | 11.81 ± 0.59ab | 0.82 ± 0.06abc |
| 5 | 8.39 ± 1.74abc | 3.12 ± 0.27ad | 11.51 ± 1.60ab | 1.14 ± 0.24abc |
| 6 | 9.24 ± 1.16abc | 2.94 ± 0.25a | 12.18 ± 1.17ab | 0.76 ± 0.14abc |
| 7 | 9.60 ± 0.87bc | 3.43 ± 0.16ac | 13.04 ± 0.80ac | 1.15 ± 0.11a |
| 8 | 7.79 ± 0.74abc | 4.18 ± 0.41ab | 11.98 ± 0.85ab | 0.69 ± 0.11abc |
| 9 | 11.55 ± 0.85c | 3.31 ± 0.14ac | 14.86 ± 00.81a | 0.62 ± 0.07bc |
| 10 | 11.20 ± 1.20bc | 4.14 ± 0.19bcde | 15.34 ± 1.24a | 0.92 ± 0.08abd |
| 11 | 10.08 ± 1.24abc | 4.79 ± 0.16b | 14.86 ± 1.25ac | 1.04 ± 0.09ab |
| 12 | 6.99 ± 0.82ab | 4.25 ± 0.25bcde | 11.25 ± 0.76ab | 0.98 ± 0.09abd |
| 13 | 10.82 ± 2.22abc | 3.52 ± 0.29aef | 14.34 ± 2.22ab | 0.81 ± 0.18abc |
| 14 | 7.50 ± 0.73ab | 3.77 ± 0.14acf | 11.27 ± 0.70ab | 1.06 ± 0.08a |
| 15 | 7.49 ± 0.79abc | 3.45 ± 0.14ac | 10.93 ± 0.75ab | 1.49 ± 0.20a |
| 16 | 11.59 ± 1.56abc | 4.84 ± 0.27bf | 16.43 ± 1.70ac | 0.54 ± 0.05c |
| 17 | 6.99 ± 0.81ab | 3.07 ± 0.16a | 10.05 ± 0.78bc | 0.84 ± 0.08abc |
| 18 | 9.76 ± 0.50c | 3.39 ± 0.13ac | 13.16 ± 0.45ac | 0.60 ± 0.05c |
| 19 | 5.08 ± 0.72a | 3.27 ± 0.32aef | 8.35 ± 0.73b | 1.21 ± 0.21abc |
| 20 | 9.59 ± 1.98abc | 3.40 ± 0.28aef | 12.99 ± 1.89ab | 0.58 ± 0.07 cd |
| Mean | 8.90 ± 0.22 | 3.70 ± 0.04 | 12.60 ± 0.21 | 0.94 ± 0.03 |
| F | 3.709 | 7.398 | 5.125 | 4.653 |
| P | <0.000 | <0.000 | <0.000 | <0.000 |
All species except Litsea panamonja had higher the concentration of starch in the dry season than in the wet season (Fig. 3). The same trends were found in the concentration of NSC for all species except Gordonia axillaris and Litsea panamonja (Fig. 3). More than half of species had higher concentrations of soluble sugar in the wet season than in dry season, and only two species (Olea rosea and Tarennoidea wallichii) had higher concentration of soluble sugar in dry season (Fig. 3). All species except Glochidion lanceolarium and Gordonia axillaris had a higher ratio of soluble sugar to starch in wet season (Fig. 3).
Figure 3.

The concentration of starch, soluble sugar, and NSC and the ratio of soluble sugar to starch for twenty species in dry season and wet season, open bars represent the dry season, and the closed bars are the wet season, 1- Glochidion lanceolarium, 2-Castanopsis calathiformis, 3-Anneslea fragrans, 4-Castanopsis hystrix, 5-Lithocarpus grandifolius, 6-Lasianthus chinensis, 7-Machilus robusta, 8-Gordonia axillaris, 9-Castanopsis echidnocarpa, 10-Olea rosea, 11-Schima wallichii, 12-Litsea rubescens, 13-Pithecellobium clypearia, 14-Lithocarpus fenestratus, 15-Lithocarpus truncatus, 16-Tarennoidea wallichii, 17-Aporusa villosa, 18-Rapanea neriifolia, 19-Phoebe puwenensis, 20-Litsea panamonja. *, ** and *** indicate significant difference at the 0.05 level, 0.01 level and 0.001 level, respectively.
Variation sources of non-structural carbohydrates
Species and season effects were significant to the concentrations of starch, soluble sugar and NSC, and a significant interaction was observed between species and season (Table 3). The concentration of starch and NSC were mainly affected by season, while the interaction between species and season was a major factor in the the concentration of soluble sugar (Table 3).
Table 3.
Summary about the effect of variation from species, season and both interactions on non-structural carbohydrates.
| Parameter | Source of variation | SS | df | MS | F | P |
|---|---|---|---|---|---|---|
| Starch | Species | 2758.84 | 19 | 145.20 | 3.709 | 0.000 |
| Species -error | 27401.19 | 700 | 39.15 | |||
| Seasons | 19944.43 | 1 | 19944.43 | 452.687 | 0.000 | |
| Species × Season | 3729.41 | 19 | 196.29 | 4.455 | 0.000 | |
| Seasons -error | 30840.50 | 700 | 44.06 | |||
| Soluble sugar | Species | 381.97 | 19 | 20.10 | 7.398 | 0.000 |
| Species -error | 1902.27 | 700 | 2.72 | |||
| Seasons | 111.96 | 1 | 111.96 | 63.892 | 0.000 | |
| Species × Season | 442.66 | 19 | 23.30 | 13.295 | 0.000 | |
| Seasons -error | 1226.64 | 700 | 1.75 | |||
| NSC | Species | 3743.26 | 19 | 197.01 | 5.125 | 0.000 |
| Species -error | 26907.55 | 700 | 38.44 | |||
| Seasons | 17070.35 | 1 | 17070.35 | 396.833 | 0.000 | |
| Species × Season | 5182.12 | 19 | 272.74 | 6.340 | 0.000 | |
| Seasons -error | 30111.50 | 700 | 43.02 |
Discussion
NSC and it components contents
The starch and NSC contents accounted for 13.76% and 17.05% of the dry season-dry weight in this study, respectively. These are higher than temperate species in Northeast China7,21,30, Acer saccharum and Betula alleghaniensis in North America13, but within the range of tropical species2,11,15. Likewise, The soluble sugar contents in the dry season are also higher than Betula platyphylla and Tilia amurensis30 and Fraxinus mandschurica31 in China, Acer saccharum and Betula alleghaniensis in North America13. It is also lower than the mean of common species in Northeast China7, but still the range of tropical species2,11. Unlike the dry season, the NSC contents in the wet season are higher than Acer saccharum and Betula alleghaniensis in North America13, but it remains within temperate species in Northeast China7,21,30 and tropical species in Panama2,11. The starch contents only accounted for 3.52% of the dry weight in the wet season in this study. That amount is higher than Quercus mongolica and Pinus koraiensis21, Betula platyphylla and Tilia amurensis30 and Betula alleghaniensis13, but lower than the mean of common species in Northeast China6 and Larix gmelinii20, Acer saccharum in North America13, and also is within the range of tropical species2. As with the dry season, The soluble sugar contents in the wet season are also higher than Betula platyphylla and Tilia amurensis30 and Fraxinus mandschurica31 in China, Acer saccharum and Betula alleghaniensis in North America13, but lower than the mean of common species in Northeast China7, and remains within the range of tropical species2,11.
NSC allocation among tissues
Different allocation patterns of the NSC among tissues may reflect their unique functions. In this study, starch was the main fraction of NSC(>70%) and is the main storage component of carbohydrates. The largest portion of the starch and NSC concentrations was located in the roots across all seasons, as also shown in Gaucher et al.13, Palacio et al.20, Loescher et al.32 and Cruz and Moreno33. This indicated that the roots were the main NSC storage tissue in monsoon evergreen broad-leaved forest in the Pu’er region, Yunnan Province, China. Root Carbon storage plays a vital role in maintaining plant physiology when trees suffer aboveground disturbance34,35. Species in monsoon evergreen broad-leaved forest have a strong sprouting ability after damage36. The high NSC concentrations in the roots may be related to species regeneration strategies because species that respond to damage by resprouting often have high carbohydrate concentrations in their roots15,37–39. Conversely, high NSC concentrations in the roots has also been related to species shade-toleraance. Shade-tolerant species usually allocate more NSC to the root for enduring a shady environment40, which enhances their survival rate41,42, and fuels rapid growth in a suitable environment40. In this study, most of studied species are the representative species for monsoon evergreen broad-leaved forests in the Pu’er region and have strong shade-tolerant abilities, which result in the high NSC concentrations in the roots. The lowest starch concentration and the largest soluble sugar concentration in leaves also reflected that the major function for leaves is to produce carbohydrates by photosynthesis and is a NSC source43.
Seasonal dynamics of NSC
Significant seasonal variations were found for all NSC components concentrations in subtropical monsoon broad-leaved evergreen forest in China. The higher starch and NSC concentrations were found in the dry season, and the wet season had the higher soluble sugar concentrations and sugar: starch. Our seasonal NSC variation results are similar to previous studies performed by Bacelar et al.44, Guehl et al.45, Li et al.7, Mooney and Billings46, Newell et al.15, Tissue et al.47, and Würth et al.2. The observed differences between the dry and wet season could be due to long-term adaptive responses of species to seasonal environmental conditions48 and the seasonal use of NSC for growth33. The wet season NSC and starch concentration reduction may reflect the rapid growth of plants. A lot of rain raised the air and soil moisture in the wet season in Pu’er region. Higher moisture and nutrient availability drove plant growth activity. Most of NSC and starches were utilized to support new tissues (such as cambium, new shoots and new fine roots) production in the wet season15,35. Meanwhile, plant respiration also consumed some of NSC and starch12,35.
Light limitations occur in the wet season due to an increased in cloud cover associated with precipitation49 and thus weakened photosynthesis. Furthermore, the higher starch and NSC concentrations in the dry season may be due to translocation of non-structural carbohydrates from senescing leaves and higher rates of photosynthesis at the beginning of the dry season4,15. Wang et al.50 reported that the highest leaf litter occured during February in monsoon evergreen broad-leaved forest in the Pu’er region. These indicated the former month before February, such as January or December, was the period of leaf NSC concentration change for many species in monsoon evergreen broad-leaved forest. Therefore, carbohydrates translocated from senescing leaves and may have contributed to the increase of starch and NSC concentrations. However, higher maximum rates of photosynthesis for some species which have new leaves also added the starch and NSC concentrations4,15,51. Evergreen species in seasonally dry environments accumulate carbohydrates during the dry season, because photosynthesis continues while the activities of cambium, xylem and phloem and growth ceases2,52,53. Dry seasons enhanced starch and NSC concentrations, indicating that carbon investments were more constrained by the environment than by acquisition methods during these periods2.
Although starch has benefits for long-term energy storage in plants54, soluble sugars are not only involved in the osmotic adjustment of cells but also serve as signal substances to enable adaptation to environmental changes7. The higher soluble sugar concentration in the wet season is not solely due to plants photosynthesis, but also because of the carbohydrates conversion from starch to sugar. However, soluble sugars exhibit more stable seasonal flux in comparison with starch, which is in agreement with the result of Newell et al.15. As an indicator of environmental change, the proportion of soluble sugars and starch (the sugar:starch ratio) in plants is also regulated by seasonality55,56. In our study, the ratio of soluble sugar to starch exhibited large seasonal flux; the sugar:starch ratio in the wet season was about four fold greater than in the dry season. The ratio of soluble sugar to starch was associated with the seasonal fluctuations of starch and soluble sugar concentrations, and the conversion between soluble sugar and starch. The higher soluble sugar concentration, coupled with the lower starch concentration, resulted in the higher ratio of soluble sugar to starch in the wet season. These indicated more carbohydrates were invested in growth during the wet season. Similarly, the lower sugar:starch ratio in the dry season indicated more carbohydrates were invested to long-term energy storage.
Species specificity of NSC
Although seasonal effects appear to overrule species effects, a high species specificity was found in this study. Significant differences exist among species for the starch, soluble sugar and NSC contents. The concentrations of starch, soluble sugar and NSC of twenty species ranged from 5.08% to 11.59%, 2.86% to 4.84%, 8.35% to 16.43%, respectively. The starch and NSC contents were significantly higher in Castanopsis echidnocarpa and Olea rosea than in Phoebe puwenensis, while Tarennoidea wallichii had the highest soluble sugar concentration. Significant species differences have been reported in previous studies2,7,12,21,30,31,57 and biological properties play a major role in such differences. Plants living under similar environmental conditions may show different content and allocation of carbohydrates in relation to their life forms or ecological strategies15,17,20. Several authors have reported differences in the carbohydrate dynamics of deciduous and evergreen species7,12,15. In this study, the higher starch and NSC content was present in C. echidnocarpa, O. rosea, Schima wallichii and T. wallichii, but P. puwenensis and Aporusa villosa had the lower starch and NSC contents. Importantly, C. echidnocarpa and S. wallichii are the main constructive species and P. puwenensis and A. villosa are the primary associated species in monsoon evergreen broad-leaved forest in Yunnan Province, China. The difference of starch and NSC contents among these species indicated there were different allocation and use strategies of carbohydrates between the main constructive and associated species. The constructive species maybe have ample carbon gain and storage when they reach the bright-light conditions of the canopy, while carbon gain is low in the forest understory for the associated species. The constructive species can establish in the shade, but need a gap to successfully grow to larger sizes, and often follow a sit-and-wait strategy. The associated species, however, complete their life cycle in the shade and may follow a more conservative strategy.
Conclusions
Our results suggest that NSC were allocated differently to leaves, twigs, trunks and roots. The highest concentrations of NSC and starch were found to be in the roots and the highest soluble sugar content in the leaves. This result indicated that the roots were the main carbohydrate storage tissue and the leaves was the main carbohydrate producing tissue. The dramatic seasonal and species variations were that the dry season had higher concentrations of starch and NSC. While the the wet season had the higher concentrations of soluble sugar and the soluble sugar:starch ratio across all species and tissues. These results show that season and species affect the starch, soluble sugar and NSC concentrations, although seasonal effects appear to overrule species effects.
Materials and Methods
Study site
The study was conducted in a monsoon evergreen broad-leaved forest in the Pu’er region of Yunnan Province in China (22°03′–24°83′N, 99°15′–102°32′E). The elevation ranges from 317 to 3370 meters above sea level, with a mean annual temperature (2000–2010) of 17.7 °C ranging from 13.8 °C in January to 22.8 °C in July and mean annual rainfall (2000–2010) of 1547.6 mm ranging from 14.2 mm in January to 325.6 mm in July. Precipitation chiefly occurs in the wet season between May and October, and not as frequently during the dry season (from November to April). The air humidity ranged from 62.5% in January to 84.2% in July. The sunlight hours was only 113 h in July due to greater cloud cover, but it was up to 252.7 h in January. The soil is a latosol. The soil water contents in the wet season and the dry season are 35.89% and 26.61% respectively. The dominant vegetation type of the study area is monsoon evergreen broad-leaved forest. The dominant tree species in the old-growth forest were Castanopsis echinocarpa, C. hystrix and Schima wallichii, with the understory containing Ardisia maculosa, Fordia microphylla, Scleria herbecarpa and Pteridophyta. Pteridophyta and Orchidaceae grow epiphytically on stems or the forest canopy occurring frequently in all the surveyed forest29. In addition, rich buttressed trees and lianas formed an important characteristic of monsoon evergreen broad-leaved forests in the Pu’er region29.
Field sampling
Field sampling was conducted in the dry (December 2013) and wet seasons (July 2014), respectively. Survey data was collected from the 20 most abundant species in six 60 × 60 m plots established in old-growth forest of monsoon evergreen broad-leaved forest (Table 4), which resulted in more than 85% of the total individuals in each plots being sampled. Depending on how many big trees (DBH > 22.5 cm), we selected 3 to 18 individuals of each species to sample leaf, twig, trunk and root. Olea rosea, Rapanea neriifolia, Gordonia axillaris, Litsea panamonja and Aporusa villosa species did not have individuals with DBH greater than 22.5 cm. For those species, we selected individuals with DBH greater than 10 cm to sample leaf, twig, trunk and root.
Table 4.
The information of species sampled in experiments.
| Species serial number | Species | Family | Genus |
|---|---|---|---|
| 1 | Glochidion lanceolarium | Euphorbiaceae | Glochidion |
| 2 | Castanopsis calathiformis | Fagaceae | Castanopsis |
| 3 | Anneslea fragrans | Theaceae | Anneslea |
| 4 | Castanopsis hystrix | Fagaceae | Castanopsis |
| 5 | Lithocarpus grandifolius | Fagaceae | Lithocarpus |
| 6 | Lasianthus chinensis | Rubiaceae | Lasianthus |
| 7 | Machilus robusta | Lauraceae | Machilus |
| 8 | Gordonia axillaris | Theaceae | Gordonia |
| 9 | Castanopsis echidnocarpa | Fagaceae | Castanopsis |
| 10 | Olea rosea | Oleaceae | Olea |
| 11 | Schima wallichii | Theaceae | Schima |
| 12 | Litsea rubescens | Lauraceae | Litsea |
| 13 | Pithecellobium clypearia | Leguminosae | Pithecellobium |
| 14 | Lithocarpus fenestratus | Fagaceae | Lithocarpus |
| 15 | Lithocarpus truncatus | Fagaceae | Lithocarpus |
| 16 | Tarennoidea wallichii | Rubiaceae | Tarennoidea |
| 17 | Aporusa villosa | Euphorbiaceae | Aporusa |
| 18 | Rapanea neriifolia | Myrsinaceae | Rapanea |
| 19 | Phoebe puwenensis | Lauraceae | Phoebe |
| 20 | Litsea panamonja | Lauraceae | Litsea |
For each individual, we sampled two twigs from the outer layer, inner layer and middle layer of the crown, respectively, using a pole tree pruner or artificial climbing trees. All leaves and twigs from the same individual were pooled respectively as two mixed samples for carbohydrate analysis. An increment borer (5 mm diameter) was used to extract a core of trunk tissue. Samples were taken from approximately 1 m height above the ground. Each individual was excavated up to 30–40 cm from its rooting point and only medium sized roots (2–5 cm diameter) were selected as root samples. After sampling, leaf, twig, trunk and root samples were immediately stored in a sealed bag and taken back to the laboratory and dried at 80 °C to a constant weight as soon as possible.
Carbohydrate analyses
Dried leaves, twigs, trunk and roots were sieved separately using a metal-free plastic mill to pass through a 0.4 mm-pore mesh screen into particles for carbohydrates analysis. Soluble sugars were extracted from 0.05 g ground material in 10 ml 80% (v/v) ethanol. The extraction was done in a shaking water bath at 80 °C. After centrifugation, the concentration of soluble sugars was determined colorimetrically at 490 nm using the modified phenol–sulphuric method16. Starch contained in the pellet remaining after the extraction of soluble sugars was hydrolyzed to glucose. After incubating in sodium acetate and amyloglucosidase solution, the concentration of starch was determined colorimetrically at 490 nm using the modified phenol–sulphuric method as detailed by Newell et al.16. The sum of soluble sugars and starch are referred to as total non-structural carbohydrates (NSC).
Statistical analyses
We present species, tissue and season specific data. The contents of soluble sugars, starch, NSC, and the ratio of soluble sugar to starch were expressed as a concentration (%). The soluble sugars, starch, NSC contents, and the sugar to starch ratio for different tissues were expressed as the mean with treating all individual sample as replications. The soluble sugars, starch, NSC contents, and the sugar to starch ratio data from individual samples of one season were pooled for each tissue sample dates within seasons. All tissue sample dates were pooled into seasonal dates. The one-way analysis of variance (ANOVA) was used to determine the tissue differences of the concentrations of starch, soluble sugar, and NSC across all seasons. The same ANOVA technique was used to assess the seasonal differences of starch, soluble sugar, NSC and the sugar:starch ratio for the same tissue. The seasonal differences of starch, soluble sugar, NSC and the sugar:starch ratio were also obtained through ANOVA. Within species, the data on soluble sugars, starch, and NSC contents and the sugar:starch ratio for individual trees were expressed as the mean of four tissues, and all statistical tests treat individual trees as replicates. Similarly, the species differences in the concentrations of starch, soluble sugar, and NSC and the ratio of soluble sugar to starch among all species was tested using ANOVA. Before performing the ANOVA, the data were tested for a normal distribution and variance homogeneity, and when necessary data were log transformed. Effects of species, seasons, and the interaction of species and season interactions on the concentrations of starch, soluble sugar, and NSC were tested by repeated measures analysis of variance. Statistical analyses were conducted using SPSS19.0 (SPSS Inc., Chicago, USA), with significant differences defined at p values less than 0.05.
Acknowledgements
We would like to thank Prof. Ryan Frazier at the Arizona State University for his assistance with English language and grammatical editing of the manuscript. Financial support came from National Key R&D Program of China (2016YFC0503103 and 2017YFC0505005), National Natural Science Foundation of China (31370592, 31200461 and 31470617), Forestry industry research special funds for public welfare projects (201404211) and Scientific and Technological Talents and Platform Plan of Yunnan (2017HB095).
Author Contributions
Wande Liu conceived the study and carried out the field measurements and drafted the manuscript. Jianrong Su revised the manuscript. Shuaifeng Li, Xuedong Lang, and Xiaobo Huang carried out the field measurement.
Competing Interests
The authors declare that they have no competing interests.
Footnotes
Publisher's note: Springer Nature remains neutral with regard to jurisdictional claims in published maps and institutional affiliations.
References
- 1.Körner C. Carbon limitation in trees. Journal of Ecology. 2003;91:4–17. doi: 10.1046/j.1365-2745.2003.00742.x. [DOI] [Google Scholar]
- 2.Würth MKR, Peláez-Riedl S, Wright SJ, Körner C. Non-structural carbohydrate pools in a tropical forest. Oecologia. 2005;143:11–24. doi: 10.1007/s00442-004-1773-2. [DOI] [PubMed] [Google Scholar]
- 3.Wang Z, Bao W, Yan X. Non-structural carbohydrate levels of three co-occurring understory plants and their responses to forest thinning by gap creation in a dense pine plantation. Journal of Forestry Research. 2015;26:391–396. doi: 10.1007/s11676-015-0073-5. [DOI] [Google Scholar]
- 4.Dietze MC, et al. Nonstructural Carbon in Woody Plants. Annual Review of Plant Biology. 2014;65:2.1–2.21. doi: 10.1146/annurev-arplant-050213-040054. [DOI] [PubMed] [Google Scholar]
- 5.Quentin AG, et al. Non-structural carbohydrates in woody plants compared among laboratories. Tree Physiology. 2015;35:1–20. doi: 10.1093/treephys/tpu115. [DOI] [PubMed] [Google Scholar]
- 6.Ai Z, et al. Slope aspect affects the non-structural carbohydrates and C:N:P stoichiometry of Artemisia sacrorum on the Loess Plateau in China. Catena. 2017;152:9–17. doi: 10.1016/j.catena.2016.12.024. [DOI] [Google Scholar]
- 7.Li N, He N, Yu G, Wang Q, Sun J. Leaf non-structural carbohydrates regulated by plant functional groups and climate: Evidences from a tropical to cold-temperate forest transect. Ecological Indicators. 2016;62:22–31. doi: 10.1016/j.ecolind.2015.11.017. [DOI] [Google Scholar]
- 8.Smith AM, Stitt M. Coordination of carbon supply and plant growth. Plant Cell & Environment. 2007;30:1126–1149. doi: 10.1111/j.1365-3040.2007.01708.x. [DOI] [PubMed] [Google Scholar]
- 9.Sala A, Woodruff DR, Meinzer FC. Carbon dynamics in trees: feast or famine? Tree Physiology. 2012;32:764. doi: 10.1093/treephys/tpr143. [DOI] [PubMed] [Google Scholar]
- 10.Wiley E, Huepenbecker S, Casper BB, Helliker BR. The effects of defoliation on carbon allocation: can carbon limitation reduce growth in favour of storage? Tree Physiology. 2013;33:1216. doi: 10.1093/treephys/tpt093. [DOI] [PubMed] [Google Scholar]
- 11.Myers JA, Kitajima K. Carbohydrate storage enhances seedling shade and stress tolerance in a neotropical forest. Journal of Ecology. 2007;95:383–395. doi: 10.1111/j.1365-2745.2006.01207.x. [DOI] [Google Scholar]
- 12.Hoch G, Richter A, Körner C. Non-structural carbon compounds in temperate forest trees. Plant, Cell & Environment. 2003;26:1067–1081. doi: 10.1046/j.0016-8025.2003.01032.x. [DOI] [Google Scholar]
- 13.Gaucher C, Gougeon S, Mauffette Y, Messier C. Seasonal variation in biomass and carbohydrate partitioning of understory sugar maple (Acer saccharum) and yellow birch (Betula alleghaniensis) seedlings. Tree Physiology. 2005;25:93–100. doi: 10.1093/treephys/25.1.93. [DOI] [PubMed] [Google Scholar]
- 14.Mooney H, Hays R. Carbohydrate storage cycles in two Californian Mediterranean-climate trees. Flora. 1973;162:295–304. doi: 10.1016/S0367-2530(17)31709-7. [DOI] [Google Scholar]
- 15.Newell EA, Mulkey SS, Wright SJ. Seasonal patterns of carbohydrate storage in four tropical tree species. Oecologia. 2002;131:333–342. doi: 10.1007/s00442-002-0888-6. [DOI] [PubMed] [Google Scholar]
- 16.Bullock SH. Seasonal differences in nonstructural carbohydrates in two dioecious monsoon-climate trees. Biotropica. 1992;24:140–145. doi: 10.2307/2388667. [DOI] [Google Scholar]
- 17.Barbaroux C, Bréda N. Contrasting distribution and seasonal dynamics of carbohydrate reserves in stem wood of adult ring-porous sessile oak and diffuse-porous beech trees. Tree Physiology. 2002;22:1201–1210. doi: 10.1093/treephys/22.17.1201. [DOI] [PubMed] [Google Scholar]
- 18.Larcher W, Thomaser-Thin W. Seasonal changes in energy content and storage patterns of Mediterranean sclerophylls in a northernmost habitat. Acta Oecologica Oecologia Plantarum. 1988;9:271–283. [Google Scholar]
- 19.Mooney HA, Chu C, Bullock SH, Robichaux R. Carbohydrate, Water and Nitrogen Storage in Vines of a Tropical Decidous Forest. Biotropica. 1992;24:134–139. doi: 10.2307/2388666. [DOI] [Google Scholar]
- 20.Palacio S, Maestro M, Montserrat-Martí G. Seasonal dynamics of non-structural carbohydrates in two species of Mediterranean sub-shrubs with different leaf phenology. Environmental and Experimental Botany. 2007;59:34–42. doi: 10.1016/j.envexpbot.2005.10.003. [DOI] [Google Scholar]
- 21.Yu LM, Wang CK, Wang XC. Allocation of nonstructural carbohydrates for three temperate tree species in Northeast China. Chinese Journal of Plant Ecology. 2011;35:1245–1255. doi: 10.3724/SP.J.1258.2011.01245. [DOI] [Google Scholar]
- 22.Chen T, Pei H, Zhang Y, Qian Q. Seasonal changes in non-structural carbohydrates and sucrose metabolism enzymes in two Sabina species. Acta Physiologiae Plantarum. 2012;34:173–180. doi: 10.1007/s11738-011-0815-8. [DOI] [Google Scholar]
- 23.Guo Q, et al. Species-specific competition and N fertilization regulate non-structural carbohydrate contents in two Larix species. Forest Ecology & Management. 2016;364:60–69. doi: 10.1016/j.foreco.2016.01.007. [DOI] [Google Scholar]
- 24.Palacio S, Millard P, Maestro M, Montserrat‐Martí G. Non-structural carbohydrates and nitrogen dynamics in mediterranean sub-shrubs: An analysis of the functional role of overwintering leaves. Plant Biology. 2007;9:49–58. doi: 10.1055/s-2006-924224. [DOI] [PubMed] [Google Scholar]
- 25.Sakai A, Yoshida S. The role of sugar and related compounds in variations of freezing resistance. Cryobiology. 1968;5:160–174. doi: 10.1016/S0011-2240(68)80161-0. [DOI] [PubMed] [Google Scholar]
- 26.Fege AS, Brown GN. Carbohydrate distribution in dormant Populus shoots and hardwood cuttings. Forest Science. 1984;30:999–1010(1012). [Google Scholar]
- 27.Bonicel A, Haddad G, Gagnaire J. Seasonal variations of starch and major soluble sugars in the different organs of young poplars. Plant Phys & Biochem. 1987;25:451–459. [Google Scholar]
- 28.Moraes MG, Chatterton NJ, Harrison PA, Filgueiras TS, Figueiredo-Ribeiro RCL. Diversity of non-structural carbohydrates in grasses (Poaceae) from Brazil. Grass & Forage Science. 2013;68:165–177. doi: 10.1111/j.1365-2494.2012.00883.x. [DOI] [Google Scholar]
- 29.Liu W, Su J. Successional leaf traits of monsoon evergreen broad-leaved forest, Southwest China. iForest. 2017;10:391–396. doi: 10.3832/ifor2045-009. [DOI] [Google Scholar]
- 30.Zhang H, Wang C, Wang X, Cheng F. Spatial variation of non-structural carbohydrates in Betula platyphylla and Tilia amurensis stems. Chinese Journal of Applied Ecology. 2013;24:3050–3056. [PubMed] [Google Scholar]
- 31.Wang W, Li J, Wang H, Gu J. Seasonal dynamics of leaf nonstructural carbohydrate content in four temperate tree species. Journal of Northeast Forestry University. 2014;42:46–49. [Google Scholar]
- 32.Loescher WH, Mccamant T, Keller JD. Carbohydrate reserves, translocation, and storage in woody plant roots. Hortscience. 1990;25:274–281. [Google Scholar]
- 33.Cruz A, Moreno JM. Seasonal course of total non-structural carbohydrates in the lignotuberous Mediterranean-type shrub Erica australis. Oecologia. 2001;128:343–350. doi: 10.1007/s004420100664. [DOI] [PubMed] [Google Scholar]
- 34.Latt C, Nair P, Kang B. Reserve carbohydrate levels in the boles and structural roots of five multipurpose tree species in a seasonally dry tropical climate. Forest Ecology and Management. 2001;146:145–158. doi: 10.1016/S0378-1127(00)00456-4. [DOI] [Google Scholar]
- 35.Li M, Xiong Y, Gu J, Wang Z, Guo D. Whole-tree dynamics of non-structural carbohydrate and nitrogen pools across different seasons and in response to girdling in two temperate trees. Oecologia. 2015;177:333–344. doi: 10.1007/s00442-014-3186-1. [DOI] [PubMed] [Google Scholar]
- 36.Su J, Liu W, Zhang Z, Li S. Sprouting characteristic in restoration ecosystems of monsoon evergreen broad-leaved forest in south-central of Yunnan Province. Acta Ecologica Sinica. 2012;32:805–814. doi: 10.5846/stxb201105250692. [DOI] [Google Scholar]
- 37.Bollmark L, Sennerby-Forsse L, Ericsson T. Seasonal dynamics and effects of nitrogen supply rate on nitrogen and carbohydrate reserves in cutting-derived Salix viminalis plants. Canadian Journal of Forest Research. 1999;29:85–94. doi: 10.1139/x98-183. [DOI] [Google Scholar]
- 38.Mcpherson K, Williams K. The role of carbohydrate reserves in the growth, resilience, and persistence of cabbage palm seedlings (Sabal palmetto) Oecologia. 1998;117:460–468. doi: 10.1007/s004420050681. [DOI] [PubMed] [Google Scholar]
- 39.Pate JS, Froend RH, Bowen BJ, Hansen A, Kuo J. Seedling growth and storage characteristics of seeder and resprouter species of mediterranean-type ecosystems of S.W. Australia. Annals of Botany. 1990;65:585–601. doi: 10.1093/oxfordjournals.aob.a087976. [DOI] [Google Scholar]
- 40.Walters MB, Kruger EL, Reich PB. Growth, biomass distribution and CO2 exchange of northern hard- wood seedlings in high and low light: relationships with successional status and shade tolerance. Oecologia. 1993;94:7–16. doi: 10.1007/BF00317294. [DOI] [PubMed] [Google Scholar]
- 41.Canham CD, Kobe RK, Latty EF, Chazdon RL. Interspecific and intraspecific variation in tree seedling survival: effects of allocation to roots versus carbohydrate reserves. Oecologia. 1999;121:1–11. doi: 10.1007/s004420050900. [DOI] [PubMed] [Google Scholar]
- 42.Kobe RK. Carbohydrate allocation to storage as a basis of interspecific variation in sapling survivorship and growth. Oikos. 1997;80:226–233. doi: 10.2307/3546590. [DOI] [Google Scholar]
- 43.Eissenstat D, Yanai R. The ecology of root lifespan. Advances in Ecological Research. 1997;27:1–60. doi: 10.1016/S0065-2504(08)60005-7. [DOI] [Google Scholar]
- 44.Bacelar EA, et al. Immediate responses and adaptative strategies of three olive cultivars under contrasting water availability regimes: Changes on structure and chemical composition of foliage and oxidative damage. Plant Science. 2006;170:596–605. doi: 10.1016/j.plantsci.2005.10.014. [DOI] [Google Scholar]
- 45.Guehl JM, Clement A, Kaushal P, Aussenac G. Planting stress, water status and non-structural carbohydrate concentrations in Corsican pine seedlings. Tree Physiology. 1993;12:173–183. doi: 10.1093/treephys/12.2.173. [DOI] [PubMed] [Google Scholar]
- 46.Mooney HA, Billings WD. Effects of altitude on carbohydrate content of mountain plants. Ecology. 1965;46:750–751. doi: 10.2307/1935021. [DOI] [Google Scholar]
- 47.Tissue DT, Wright SJ. Effect of seasonal water availability on phenology and the annual shoot carbohydrate cycle of tropical forest shrubs. Functional Ecology. 1995;9:518–527. doi: 10.2307/2390018. [DOI] [Google Scholar]
- 48.Poorter L, Kitajima K. Carbohydrate storage and light requirements of tropical moist and dry forest tree species. Ecology. 2007;88:1000–1011. doi: 10.1890/06-0984. [DOI] [PubMed] [Google Scholar]
- 49.Graham EA, Mulkey SS, Kitajima K, Phillips NG, Wright SJ. Cloud cover limits net CO2 uptake and growth of a rainforest tree during tropical rainy seasons. Proceedings of the National Academy of Sciences, USA. 2003;100:572–576. doi: 10.1073/pnas.0133045100. [DOI] [PMC free article] [PubMed] [Google Scholar]
- 50.Wang M, Liu W, Xu C. Litter dynamic changes of community of monsoon broad-leaved evergreen forest in different restoration stages in Southwest China. Acta Botanica Boreali-Occidentalia Sinica. 2014;34:372–378. [Google Scholar]
- 51.Kitajima K, Mulkey SS, Wright SJ. Seasonal leaf phenotypes in the canopy of a tropical dry forest: photosynthetic characteristics and associated traits. Oecologia. 1997;109:490–498. doi: 10.1007/s004420050109. [DOI] [PubMed] [Google Scholar]
- 52.Prislan P, Gričar J, de Luis M, Smith KT, Katarina Č. Phenological variation in xylem and phloem formation in Fagus sylvatica from two contrasting sites. Agricultural & Forest Meteorology. 2013;180:142–151. doi: 10.1016/j.agrformet.2013.06.001. [DOI] [Google Scholar]
- 53.Venugopal N, Liangkuwang MG. Cambial activity and annual rhythm of xylem production of elephant apple tree (Dillenia indica Linn.). In relation to phenology and climatic factor growing in sub-tropical wet forest of northeast India. Trees. 2007;21:101–110. doi: 10.1007/s00468-006-0101-3. [DOI] [Google Scholar]
- 54.Zhang H, Wang C, Wang X. Spatial variations in non-structural carbohydrates in stems of twelve temperate tree species. Trees. 2014;28:77–89. doi: 10.1007/s00468-013-0931-8. [DOI] [Google Scholar]
- 55.Li M-H, et al. Mobile carbohydrates in Himalayan treeline trees I. Evidence for carbon gain limitation but not for growth limitation. Tree Physiology. 2008;28:1287–1296. doi: 10.1093/treephys/28.8.1287. [DOI] [PubMed] [Google Scholar]
- 56.Gough CM, Flower CE, Vogel CS, Curtis PS. Phenological and temperature controls on the temporal non-structural carbohydrate dynamics of Populus grandidentata and Quercus rubra. Forests. 2010;1:65–81. doi: 10.3390/f1010065. [DOI] [Google Scholar]
- 57.Li N, He N, Yu G. Evaluation of leaf non-structural carbohydrate contents in typical forest ecosystems in northeast China. Acta Ecologica Sinica. 2016;36:430–438. [Google Scholar]