Abstract
BACKGROUND:
“Phubbing” phenomenon, in the frequent use of a smartphone, describes the habit of snubbing someone in favor of a mobile phone. Its predictors and consequences are few in developed countries, but the literature lacks information on its actual occurrence and impact on adolescents and youth in a developing country such as India.
MATERIALS AND METHODS:
This impact evaluation study was carried out as part of the Phubbing Project of the University of Poland for 6 months (November 15, 2016–May 15, 2017) on a sample of 400 adolescents and youth selected randomly from the five colleges in the district of Muzaffarnagar of Uttar Pradesh state in India. Data were collected through the Internet using e-questionnaires sent to all students. The phubbing predictors’ and consequences’ scales available in literature were used and data were analyzed by a mixed method to get the study findings.
RESULTS:
The prevalence of phubbing was 49.3%. The most important predictors associated with phubbers were Internet addiction (p < 0.0001, Odds Ratio 2.26), smartphone addiction (OR 25.9), fear of missing out (OR 18.8), and the lack of self-control (p < 0.0001, OR = 0.73–1.72). Phubbing also had significant consequences on their social health, relationship health, and self-flourishing, and was significantly related to depression and distress. Logistic regression analysis showed significant impact of phubbing predictors on phubbing consequences in phubbers, especially in depressed and distress status.
CONCLUSION:
Adolescents and youth of India need special guidance from government adolescent clinics or colleges or even families to control this habit in order to promote better physical, mental, and social health.
Keywords: Addiction, adolescents, evaluation, India, Internet, phubbing, smartphone, youth
Introduction
Despite the obvious benefits of smartphones, their potential adverse effects such as addiction in the form of nomophobia, Internet addiction, and social media addictions of Facebook and WhatsApp are issues on the increase in developing countries, where the number of smartphone users is rising.[1,2] Many people in developing countries including India are now showing signs of addiction to the Internet and are, therefore, becoming problematic smartphone users, which is a cause for concern because of the potential consequences.[3,4,5,6,7] Therefore, there is a growing unease that smartphones may actually create a form of misuse or overuse resulting in problematic Internet usage, generating a new problem known as “Phubbing” rather than a means of enhancing social interactions.[4,5,6,7]
The term “Phubbing” has been defined in various ways as modern communication in which a person snubs another in a social setting by concentrating on their phone instead of having a conversation.[1] This phubbing phenomenon elucidates the real negative consequences of the lack of communication that detrimentally affects relationships and feelings of personal well-being.[5]
In India, 21% of the population are adolescents and nearly 20% of adolescents exhibit the consequences of smartphones’ overusage in mental health problems in the form of difficulty in concentration and attention deficit-hyperactivity disorder, but the contribution of phubbing is practically unknown.[8,9,10] In the Indian scenario, smartphone's addiction and problematic internet use among adolescents are on the increase, which indicates the possibility of phubbing among adolescents and youth.[6,7] Moreover, it has also been seen that in the age of E-learning, only a few Indian students often use their smartphones to enhance their learning. The majority use smartphones for personal communication in the courses,[11] which shows that phubbing may have many predictable or attendant factors[10,11,12,13,14] that are yet to be studied.
Moreover, there are practically no studies in India except a few[6,7,11,12,13,14] on the negative impact of the use of a mobile phone such as the smartphone and Internet addiction on the impact of predictors or consequences of the phubbing phenomenon on Indian adolescents and youth. This, therefore, remains a blind researchable area and thus one of the main reasons for this rather unique research.
Materials and Methods
The main aim of this study was to assess the role of predictors and their consequent impact on adolescents and youth from colleges of India as part of the Phubbing Project of the Institute of Psychology, University of Poland.
This was an impact evaluation study of 6 months’ duration (from November 15, 2016, to May 15, 2017). First, a written ethical approval from Institutional Research Committees of all the five selected colleges involved was obtained by the authors after visits to these institutions. A separate approval was obtained from the University of Poland by the authors by E-mail. The principals of the five selected colleges were first contacted personally by the Indian authors, and the purpose and usefulness of this study for their students were explained. Thereafter, students who were willing to participate were further asked to give their E-mail ids and their permission and written informed consent to participate. They were asked to be ready to fill the online questionnaire themselves via E-mail and were enrolled in this study. At this time, at least five students of each of the five colleges were also pretested in this online questionnaire, so the best possible data were collected via the Internet using e-questionnaires sent to all students.
Out of 36 colleges in district Muzaffarnagar of Uttar Pradesh state in India, the five best colleges based on the ranking of quality of colleges were sampled randomly (with at least one medical college, one ayurved and Unani college, one science [engineering] college, one arts college, and one commerce college). College students included in the study belonged to the age group of 15–29 years which covers both adolescents (10–19 years – WHO definition[15]) and youth (15–29 years – as per the National Youth Policy [2014] of India[16]). This was done to ensure adequate sampling coverage of the phubbing phenomenon in young college students as they were more likely to use smartphones as indicated in some studies[6,7,8] for many purposes.
Out of these five colleges, at least 100 students in the above age group were sampled randomly (simple random sampling) from each college (a total of 500 students). During the random sampling, the selected students were involved in the study without any specific criteria relating to their classes. This was based simply on the adherence to smartphone usage as asserted by the authors in their first visit to the college. All further communications with the participating students were by E-mails. However, due to nonresponse/any kind of partial response to the E-questionnaire sent via E-mails, a total of 100 students from 5 colleges (23 from arts college, 26 from commerce college, 31 from engineering College, and 20 from medical College) were excluded from the 500 students on the basis of the nonresponse criteria of 6 months’ total duration of study, arriving at a final sample size of 400 students.
This sample size was also verified by a formula of cross-sectional studies: n = 4PQ/L2, where n = total sample size, p was presumed at 50% prevalence of phubbing (WHO criteria - as no past prevalence was available from any previous studies in India) = 0.5, L (allowable error) = 10% of P, i.e. 0.05, therefore N = 400. Hence, an adequate sample size was ensured in this study to avoid any issue of bias. The study methodology involved initial cross-sectional survey of phubbing predictors and consequences status from November 15, 2016 to February 15, 2017 (3 months). The two groups of phubbers and nonphubbers were then evaluated for the next 3 months (February 16, 2017–May 16, 2017) for the impact of predictors on consequences status of phubbing.
To study the variables of interest in our study, various phubbing predictor scales[17,18,19,20,21,22,23,24] were used to define the responses as follows:
Phubbing Prevalence Questionnaire: From this, the prevalence of phubbing in terms of phubbing frequency and frequency of being phubbed were measured using items scored as guidelines of phubbing scale (Karadaǧ et al., 2015).[17] It consists of 10 items graded from 1 (never) to 5 (always) on a 5-point Likert scale
Smartphones and Internet Addiction scale: The scale of Adapted Mobile Phone Use Habits by Smetaniuk,[18] consisting of 10 items (1 = strongly disagree; 5 = strongly agree) and the Internet Addiction Scale by Karadaǧ et al., 2015,[17] consisting of 6 items, on a 5-point scale (1 = rarely; 5 = always)
Self-Control Scale by Tangney et al.:[20] It consists of 13 items to describe on a 5-point scale (1 = not like me at all; 5 = very much like me)
Fear of Missing Out (FOMO) Scale by Przybylski et al.:[19] It consists of 10 items on a 5-point scale (1 = not at all true of me, 5 = extremely true of me).
The Phubbing Consequences Scales used were as follows:
Social Well-being Scale: The Social Relationship Assessment Scale by Hendrick[21] was used to measure general relationship satisfaction. It consists of 7 items on a 5-point scale from 1 (low satisfaction) to 5 (high satisfaction)
Satisfaction with Relationship Scale: The Center for Epidemiologic Studies Depression Scale which consists of 10 items (Radloff, 1977; Eaton, Muntaner, Smith, Tien, and Ybarra, 2004)[22] was used
Self-Flourishing scale: The 8-item Flourishing Scale by Diener et al.[23] was used which measures the respondent's perceived success in important areas such as relationships, self-esteem, purpose, and optimism; it provides a single psychological well-being score
Depression and Distress scales by Kessler's 6-item K6 (Kessler et al., 2003)[24] was used. It measures psychological distress.
The data were analyzed by both quantitative and qualitative methods. Appropriate tests of significance such as Chi-square test were applied together with appropriate risk calculations and effect size calculations (Cohen's D and R) to find whether the obtained differences were meaningful or not. In addition, multinomial logistic regression analysis was applied to see the effect of predictor variables on consequence variables.
Results
The majority of college students in the present study were in the late adolescent to early youth age group (38.2%), male (51%), Hindus (47.8%), belonging to general caste (81.3%), above Class I of socioeconomic class (38.8%), and majority were medical students (24.7%). However, 20% of nonrespondents (n = 100), i.e. majority were from engineering colleges (31%) and the smallest number from medical colleges (20%) [Table 1]. The best possible reasons for the nonresponses were that (a) they did not want their privacy invaded (41%), (b) they did not want to discuss this issue further (33%) without any reason, and the rest 26% were afraid of being ordered by the college to stop using their smartphone in class.
Table 1.
Phubbing behavior profile of sampled adolescents and youth (n=400)
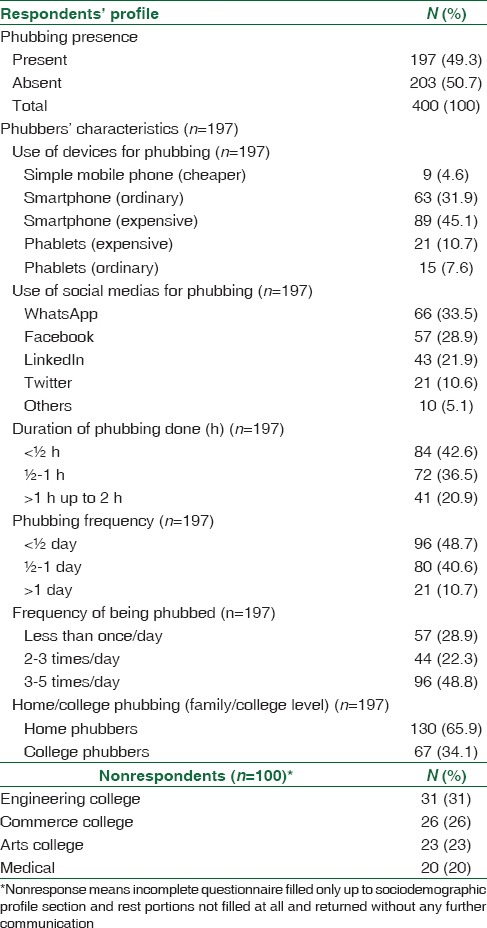
The prevalence of phubbing was 49.3%. Expensive smartphones were the frequently used device for phubbing (45.1%), in which WhatsApp was the main attraction (33.5%) for phubbing. The characteristics were also dominated by <½ h of phubbing (42.6%) with frequency <½ day (48.7%). However, college students were themselves phubbed at least 3–5 times/day (48.8%) and they also reported home family phubbing to be even higher (65.9%) [Table 1].
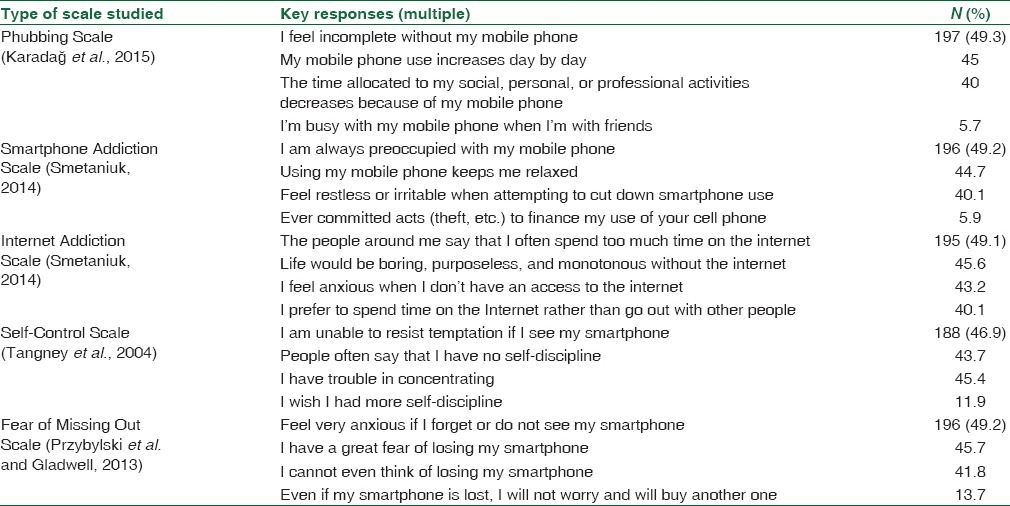
On the Phubbing Questionnaire Scale, the most common response was “I feel incomplete without my mobile phone” (49.3%) and the least common was “I’m not busy with my mobile phone when I’m with friends” (5.7%). On Adapted Mobile Phone Use Habits Scale, the most common response was “I am always preoccupied with my mobile phone (49.2%) and the least common was “I never committed illegal acts (theft) to finance the use of my cell phone” (5.9%). On the Internet Addiction Scale, the most common response was “The people around me say that I spend too much time on the Internet” (49.1%) and the least common was “I prefer to spend time on the Internet rather than go out with others” (40%). On Brief Self-Control Scale, the most common response was “I am unable to resist temptation if I see my smartphone” (46.9%). The least common was “I wish I had more self-discipline” (11.9%). On the FOMO Scale, the most common response was “Feel very anxious if I forget or do not see my Smartphone” (49.2%). The least common was “Even if my smartphone were lost, I would not worry; I would buy another one” (13.7%) [Table 2].
Table 2.
Responses on phubbing predictors obtained on scaling criteria (n=400)
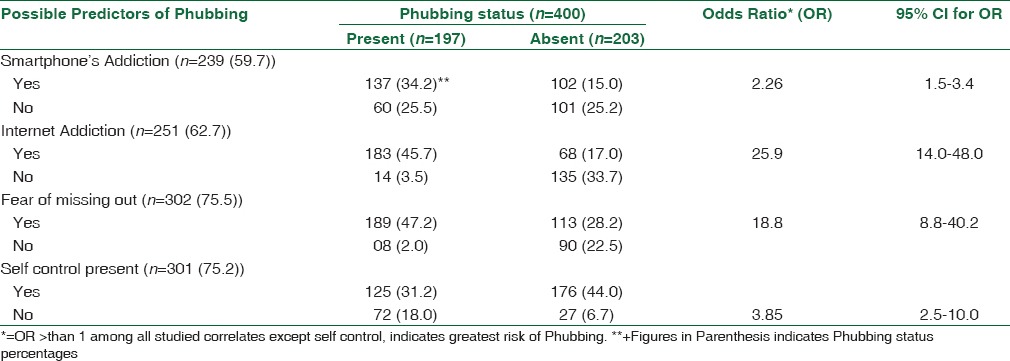
The phubbing status of college students was highly significantly associated with all the phubbing predictors (Internet Addiction and Smartphone Addiction, FOMO, and Self Control) (p < 0.0001 in each case, Cohen's d (effect size) >0.5) in each case except smartphone addiction. Though the important predictor was “fear of missing out smartphone” (75.5%, relative risk [RR] = 1.7, OR = 3.7) as the most common and smartphone addiction (59.7%, RR = 1.4, OR = 2.2) as the least common, the risk of phubbing was highest with internet addiction) (RR = 2.83, OR = 2.3 and Cohen's d [effect size] = 1.65) [Table 3].
Table 3.
Association between Phubbing and possible correlates of Phubbing (n=400)
On Social Well-being Scale, the most common response was “I do not care even if I am labeled as phubber” (46.8%). The least common was “my peers have asked me to stop phubbing because of my bad social relations” (8.7%). On Satisfactory Relationships Scale (Radloff, 1977; Eaton et al. and Ybarra, 2004), the most common response was “my relationship with the family is getting worse” (49.2%) and the least common was “often my classmates feel rejected because of my phubbing” (5.9%) [Table 4].
Table 4.
Responses on phubbing consequences obtained on scaling criteria (n=400)
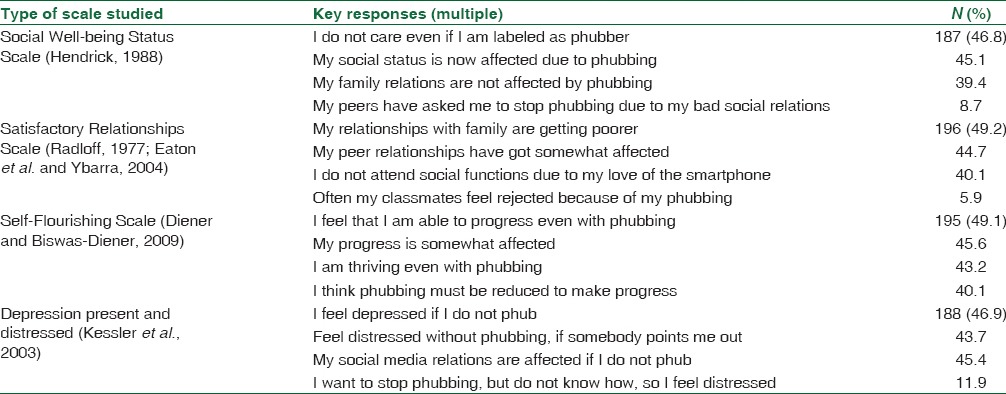
On the Self Flourishing Scale, the most common response was “I feel that I am able to flourish even with phubbing” (49.1%). The least common was “I think phubbing must be reduced in order for me to flourish” (40.1%). On the Depression and Distress Scale, the most common response was “I often feel depressed if I do not phub” (46.9%). The least common was “I want to stop phubbing, but do not know how, so I feel distressed” (11.9%) [Table 4].
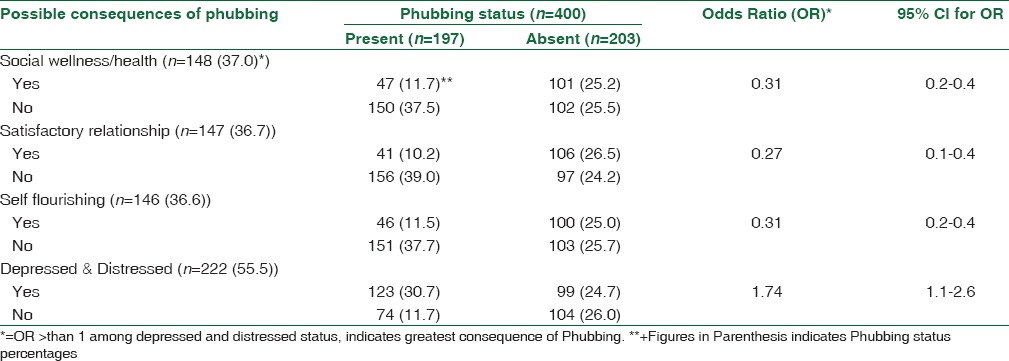
The phubbing status of college students was also highly significantly associated with all the phubbing consequences (social well-being, healthy relationship, self-flourishing, depression, and distressed) (p < 0.0001 in each case and Cohen's d > 0.5 in each case). The most important consequence of phubbing was “depression and distress” (55.5%), with the highest (RR = 1.28, OR = 1.74) of phubbing and self-flourishing as a least consequence (36.6%, RR = 0.4, OR = 0.3) [Table 5].
Table 5.
Phubbing consequences profile of adolescents and youth (n=400)
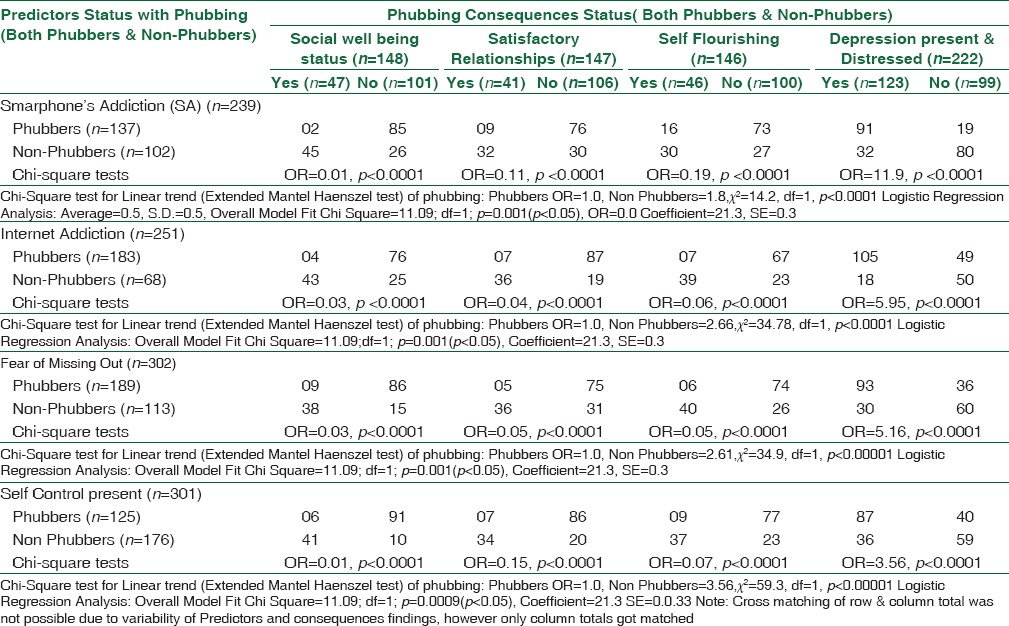
The impact of phubbing predictors on the status of consequences among adolescents and youth as per phubber status revealed that all the phubbing consequences (social well-being, relationship health, self-flourishing, depression, and distress) were also highly significantly associated (p < 0.0001 each and Cohen's d [effect size] >0.5 [0.27–0.68]) with phubbing predictors (internet addiction and smartphone addiction, FOMO, and self-control). However, the highest risk of phubbing was in depression and being distressed, and this was mainly from smartphone addiction (OR = 11.9, RR = 2.8) and internet addiction (OR = 5.9, RR = 2.6) [Table 6]. On further multinomial logistic regression analysis, there were also significant impacts of each of the predictors of phubbing on overall phubbing (average = 0.5, standard deviation = 0.5, overall model fit Chi-square = 11.09; df = 1; p = 0.001 [p < 0.05], OR = 0.0, coefficient = 21.3, standard error = 0.3) [Table 6].
Table 6.
Impact of Phubbing Predictors status on Consequences status among Adolescents & youth as per their Phubber status
Discussion
Adolescents in developing countries such as India are now more inclined toward using mobile phones for activities other than communication due to the fact that at that stage, they are susceptible to the changing fashion trends, style, and are getting more tech savvy. The consequences are various behavioral disorders such as nomophobia (40%), smartphone addiction (40%), internet addiction (40%–45%), fights with family members (10%), suicides or murders (up to 5%), and even peer phubbing as indicated by some studies in the literature.[6,7,8,11,12,13,14,15,16,25,26,27]
Although many studies reveal the positive benefits of smartphones including their use to improve health-care services in developing countries such as India,[28,29,30,31] the use of mobile phones for phubbing, especially during social events, can have a negative influence on relationships. A few studies[6,7,8,9,10,11] have revealed that phubbing, which is due to smartphone and internet addiction, is often offensive to most people. The magnitude of the problem of smartphone addiction in India as revealed in a meta-analytic study[6] is that it ranges from 39% to 44% in adolescents. The increase in the use of smartphones in Indian societies has now raised concerns about social and psychological effects of excessive use, especially by adolescents, who are more vulnerable to various factors such as nomophobia and addiction to smartphones and the internet.[6,7,8]
In our present study, the magnitude of phubbing (49.3%) can be explained by many factors such as the young age group involvement, better sociodemographic and economic status, and that medical, engineering, and commerce college students were the most likely to engage in phubbing. This is similar to the factors revealed by a few studies on patterns of Internet and smartphone usage by medical and other types of students in India, in which the magnitude of the smartphone addiction was from 39% to 44%[6] and “problematic Internet usage” was up to 21.6%.[7] The key predictors of problematic internet usage had a positive correlation between smartphone addiction and phubbing behavior.[1]
The higher prevalence of smartphone usage (77%) may also explain the important phubbing features present in our study such as excessive social media usage (WhatsApp and Facebook – 62.4% combined), ½–1 h of phubbing (79.1%), phubbing frequency (½–1 day: 89.3%), being phubbed (once to 3 times/day: 51.2%), and the level of home phubbing (65.9%). This finding in our present study reveals the magnitude of the emerging problem of phubbing in India as similar to the findings in studies[1,5,6,7,18] on phubbing conducted across the globe in which factors such as heavy social networking of adolescents[18] have been linked to smartphones and problematic Internet overuse.
In our present study, the phubbing status of college students was highly significantly associated not only with all the phubbing predictors (p < 0.0001 in each case, Cohen's d [effect size] >0.5 in each case except smartphone addiction), but also with all phubbing consequences (p < 0.0001 in each case and Cohen's d >0.5 in each case). The presence of the meaningful risk of phubbing was actually highest with internet addiction (RR = 2.83, OR = 2.3 and p < 0.0001 and Cohen's d [effect size] = 1.65). The most important consequence of phubbing in phubbers was depression and distress (55.5%), with the highest (RR = 1.28, OR = 1.74 and p < 0.0001 and Cohen's d [effect size] = 1.65) prevalence of phubbing. The above findings in our present study are similar to other studies[1,5,10,11,12,13,14,18,19,30,31,32,33,34] across the globe which also found that internet addiction, FOMO, and self-control predicted smartphone addiction, which in turn predicted the extent to which people phub.
In our present study, both predictors and consequences were present in phubbers independent of their gender. This was in contrast to the study by Acharya et al.[32] who found that both the FOMO and social networking involvement were more evident in girls than boys.
It is also evident from the literature that cell phone can disrupt leisure time physical activity, promote sedentary behavior in the most habitual users, and phubbers are also more likely to use their cell phones for more sedentary activities such as Facebook, Twitter, video games, apps, and surfing the internet as indicated in some studies.[33,34] This explains some of the important features of “phubbing” as a result of the predominance of social media in the lives of adolescents in our present study.
On further logistic regression analysis, the most important findings of our study were the significant impacts of each predictor of phubbing on the overall consequences of phubbing (p < 0.0001 each case), which was also confirmed by medium-to-large effect obtained in Chi-square test. This was similar to important phubbing studies[1,4,5,10,13] in the literature throughout the world.
However, despite the best efforts to ensure random sampling of adolescents, a large sample size and possible individual variations in the institutions selected for study, coupled with the possibility of questionable answers procured online, may limit the generalization of the findings of this study. However, the key message from our study is that adolescents in India need regular monitoring of their smartphone usage both at home and at college.
Financial support and sponsorship
Nil.
Conflicts of interest
There are no conflicts of interest.
References
- 1.Chotpitayasunondh V, Douglas KM. How “phubbing” becomes the norm: The antecedents and consequences of snubbing via smartphone. [Last updated on 2017 May 10; Last accessed on 2017 May 10];Comput Hum Behav. 2016 63:9–18. Available from: http://www.sciencedirect.com/science/article/pii/S0747563216303454 . [Google Scholar]
- 2.Baron NS, Campbell EM. Gender and mobile phones in cross-national context. Lang Sci. 2012;34:13–27. [Google Scholar]
- 3.Beranuy U, Oberst X, Carbonell AC, Chamarro A. Problematic internet and mobile phone use and clinical symptoms in college students: The role of emotional intelligence. Comput Hum Behav. 2009;25:1182–7. [Google Scholar]
- 4.Haigh A. Stop Phubbing. [Last updated on 2015 May 10; Last accessed on 2017 May 10]. Available from: http://www.stopphubbing.com .
- 5.Roberts JA, David ME. My life has become a major distraction from my cell phone: Partner phubbing and relationship satisfaction among romantic partners. Comput Hum Behav. 2016;54:134–41. [Google Scholar]
- 6.Davey S, Davey A. Assessment of smartphone addiction in Indian adolescents: A Mixed method study by systematic-review and meta-analysis approach. Int J Prev Med. 2014;5:1500–11. [PMC free article] [PubMed] [Google Scholar]
- 7.Davey S, Davey A, Singh JV. Emergence of problematic internet use among Indian adolescents: A multi method study. J Indian Assoc Child Adolesc Ment Health. 2016;12:60–78. [Google Scholar]
- 8.Indian Express; [Last updated on 2017 Sep 25; Last accessed on 2017 May 10]. Excess Use of Smartphone Risks Mental Health. Available from: http://www.Indianexpress.com/article/lifestyle/health/excess-use-of-smartphone-risks-mental-health-4638738/ [Google Scholar]
- 9.Sunitha S, Gururaj G. Health behaviours & problems among young people in India: Cause for concern and call for action. Indian J Med Res. 2014;140:185–208. [PMC free article] [PubMed] [Google Scholar]
- 10.David ME, Roberts JA. Phubbed and alone: Phone snubbing, social exclusion, and attachment to social media. [Last updated on 2017 Jun 01; Last accessed on 2017 Jun 01]. Available from:https://www.ideas.repec.org/a/ucp/jacres/doi10.1086-690940.html .
- 11.Ugur NG, Koc T. Time for digital detox: Misuse of mobile technology and phubbing. Procedia Soc Behav Sci. 2015;195:1022–31. [Google Scholar]
- 12.Przepiorka A, Blachnio A. Time perspective in Internet and Facebook addiction. Comput Hum Behav. 2016;60:13e18. [Google Scholar]
- 13.Nazir T, Pişkin M. Phubbing: A technological invasion which connected the world but disconnected humans. Int J Indian Psychol. 2016;3:68–76. [Google Scholar]
- 14.Francisca LT. University of Granada; 2007. Feb 27, [Last accessed on 2017 Jun 14; Last Updated on 2017 Jun 14]. Mobile Phone Addiction in Teenagers May Cause Severe Psychological Disorders. Available from: http://www.news-medical.net/news/2007/02/27/22245.aspx . [Google Scholar]
- 15.WHO; [Last updated on 2017 Sep 25; Last accessed on 2017 Jun 01]. Adolescent Health. Available from: http://www.who.int/topics/adolescent_health/en/ [Google Scholar]
- 16.National Youth Policy-2014(India) [Last updated on 2014 Dec 31; Last accessed on 2017 Sep 25]. Available from: https://www.yas.nic.in/sites/default/files/National-Youth-Policy-Document.pdf .
- 17.Karadaǧ E, Tosuntaş ŞB, Erzen E, Duru P, Bostan N, Şahin BM, et al. Determinants of phubbing, which is the sum of many virtual addictions: A structural equation model. J Behav Addict. 2015;4:60–74. doi: 10.1556/2006.4.2015.005. [DOI] [PMC free article] [PubMed] [Google Scholar]
- 18.Smetaniuk P. A preliminary investigation into the prevalence and prediction of problematic cell phone use. J Behav Addict. 2014;3:41–53. doi: 10.1556/JBA.3.2014.004. [DOI] [PMC free article] [PubMed] [Google Scholar]
- 19.Przybylski AK, Murayama K, DeHaan CR, Gladwell V. Motivational, emotional, and behavioral correlates of fear of missing out. Comput Hum Behav. 2013;29:1841–8. [Google Scholar]
- 20.Tangney JP, Baumeister RF, Boone AL. High self-control predicts good adjustment, less pathology, better grades, and interpersonal success. J Pers. 2004;72:271–324. doi: 10.1111/j.0022-3506.2004.00263.x. [DOI] [PubMed] [Google Scholar]
- 21.Hendrick SS. A generic measure of relationship satisfaction. J Marriage Fam. 1988;50:93–8. [Google Scholar]
- 22.Eaton WW, Smith C, Ybarra M, Muntaner C, Tien A. Center for Epidemiologic Studies Depression Scale: Review and revision (CESD and CESD-R) The Use of Psychological Testing for Treatment Planning and Outcomes Assessment. Instruments for Adults. In: Maruish ME, editor. 3rd ed. Vol. 3. Mahwah, NJ: Lawrence Erlbaum; 2004. pp. 363–77. [Google Scholar]
- 23.DienerE, Wirtz D, Tov W, Prieto KC, Choi D, Oishi S, Diener BR. New measures of well-being: Flourishing and positive and negative feelings. Soc Indic Res. 2009;39:247–66. [Google Scholar]
- 24.Kessler RC, Barker PR, Colpe LJ, Epstein JF, Gfroerer JC, Hiripi E, et al. Screening for serious mental illness in the general population. Arch Gen Psychiatry. 2003;60:184–9. doi: 10.1001/archpsyc.60.2.184. [DOI] [PubMed] [Google Scholar]
- 25.Sivagurunathan C, Umadevi R, Rama R, Gopalakrishnan S. Adolescent health: Present status and its related programmes in India. Are we in the right direction? J Clin Diagn Res. 2015;9:LE01–6. doi: 10.7860/JCDR/2015/11199.5649. [DOI] [PMC free article] [PubMed] [Google Scholar]
- 26.Oberst U, Wegmann E, Stodt B, Brand M, Chamarro A. Negative consequences from heavy social networking in adolescents: The mediating role of fear of missing out. J Adolesc. 2017;55:51–60. doi: 10.1016/j.adolescence.2016.12.008. [DOI] [PubMed] [Google Scholar]
- 27.Thomée S, Härenstam A, Hagberg M. Mobile phone use and stress, sleep disturbances, and symptoms of depression among young adults – A prospective cohort study. BMC Public Health. 2011;11:66. doi: 10.1186/1471-2458-11-66. [DOI] [PMC free article] [PubMed] [Google Scholar]
- 28.Davey S, Davey A, Singh JV. Mobile-health approach: A critical look on its capacity to augment health system of developing countries. Indian J Community Med. 2014;39:178–82. doi: 10.4103/0970-0218.137160. [DOI] [PMC free article] [PubMed] [Google Scholar]
- 29.Davey S, Davey A. M-health- Can it improve Indian public health system. Natl J Community Med. 2013;4:545–9. [Google Scholar]
- 30.Davey S, Davey A. Mobile-health technology: Can it strengthen and improve public health systems of other developing countries as per Indian strategies? A systematic review of the literature. Int J Med Public Health. 2014;4:40–5. [Google Scholar]
- 31.Davey S, Raghav SK, Davey A, Singh N, Singh JV. Internet usage patterns among medical interns of Muzaffarnagar: A comprehensive survey analysis. Asian J Med Sci. 2015;6:99–104. [Google Scholar]
- 32.Acharya JP, Acharya I, Waghrey D. A study on some of the common health effects of cell-phones amongst college students. J Community Med Health Educ. 2013;3:214. [Google Scholar]
- 33.Goswami V, Singh DR. Impact of mobile phone addiction on adolescent's life: A literature review. Int J Home Sci. 2016;2:69–74. [Google Scholar]
- 34.Kumar LR, Chii KD, Way LC, Jetly Y, Rajendaran V. Health awareness of mobile phone hazards among university students in a Malaysian medical school. Health. 2011;3:406–15. [Google Scholar]


