

Abstract
Aims and Objectives:
The objective of this article is to focus on the dental anatomy, its influence on therapeutic choices, and decision in orthodontics.
Materials and Methods:
A sample of 80 subjects was selected and analyzed. Through the usage of the three-dimensional scanner with the C2000-Cepha and Cepha3DT software, it is now possible to calculate the volume and the dimensions of both crown and root of each tooth and compare them to the literature. Data were collected and statistically evaluated with the StatView software (version 5.0).
Results:
These references values were compared with those known in the literature redefining our approaches to treatment in orthodontics.
Conclusion:
The individual anatomical data either unique or in a group of teeth give new insights on the orthodontic therapeutic options.
KEYWORDS: Anchorage, cephalometrics, dental anatomy, three-dimensional scanner
INTRODUCTION
The rapid evolution of the imaging techniques, especially with the advent of the three-dimensional (3D) scanner, provides new opportunities in the medical field.[1]
The purpose of this study is to redefine new parameters in dental anatomy and their impact on orthodontic therapy in terms of anchorage and choice of extraction.
The 3D scanner gives accurate and precise measurements of dental anatomy.
The C2000 software helps select and reconstruct the different structures in 3D from tomographic images based on scanner and magnetic resonance imaging techniques. Moreover, C2000 software allows the segmentation of each axial cut and the selection of the structures of each tooth separating crowns and roots in 3D.[2]
It is then possible to make 3D reconstruction of crowns and roots and to calculate several parameters of the dental anatomy that are important for the orthodontic practice.
CORONAL ANATOMY
The tooth to extract is determined by the anatomy of its crown. This choice is subject to a daily debate among orthodontic schools.[3,4,5]
When extraction is indicated, some schools recommend the systematic extraction of a specific tooth rather than the other for anatomical crown reasons, i.e., removal of second maxillary premolar instead of the first.
The idea behind this concept is that avulsion of the first premolar can induce an imbalance, as well as esthetic and functional discrepancy within the arches.
RADICULAR ANATOMY
Orthodontic literature shows the importance of the radicular anatomy in orthodontic mechanics through the concept of anchorage.[6,7]
In this matter, a specific anchorage value is assigned for each tooth based on different criteria.
Several definitions of anchorage might be found following:
Root surface; the periodontal ligament opposes the movement, whatever the direction of the ligament is[6]
Orthogonal projection of the surface to the displacement knowing that only compressed area opposes the movement
Radicular length (Jarabak), i.e., a longer root is considered deeply anchored.[7]
Herein, we hypothesize that most preferable method to calculate the anchorage is to evaluate the root volume representing the 3D radicular integrity in the alveolar bone.
GLOBAL ANATOMY
In some clinical situations, global anatomy of the tooth dictates treatment plan, i.e., in case of canine replacing maxillary lateral incisor.
Nowadays, with the input of restorative and prosthetic dentistry, crown reshaping (coronoplasty) is possible but not at the radicular level.
In the latter, maxillary canine substitution with lateral incisor is feasible thanks to advances in restorative and prosthetic dentistry, allowing to mimic the crown of the canine into lateral incisor in an acceptable way which is not the case at the level of the root. Often, negative consequences of substitution treatment cannot be avoided on the periodontium.[8,9]
Besides the importance of the root and crown in terms of anchorage and choice of extraction, the tooth should be considered in its totality influencing treatment decision.
MATERIALS AND METHODS
MATERIALS
Eighty scanner examinations were selected randomly from patients consisting of 34 men, 46 women, with a mean age of 28 years (range: 15–65) having benefited from full skull scan for maxillary sinus symptoms or for maxillofacial deformities at Clinique Pasteur – Toulouse, France.
The data from these diagnostic investigations were used during the second phase once patient anonymity had been imposed.
Before 3D scan, each patient (or his/her legal representative) was required to sign informed consent form allowing using the records obtained for future research.
No ethical approval was needed since it is a retrospective study.
The 3D analysis will not require any additional radiation.
This study was performed during a period of 5 years (2008–2013).
Exclusion criteria
Patient's scanner showing bilateral agenesis or teeth extraction on any of upper or lower arches were excluded from this study.
METHODS
Capture of two-dimensional data
All the 3D scan examinations were performed on CT TWIN FLASH (ELSCINT, Haïfa, Israel).
Each test was taken with a subject in the supine position.
Using a “scout view” of the lateral skeleton, we programmed helicoidal capture from the chin to the top of the eye sockets.
Capture time varied between 35 and 55 s according to the extent of the helicoidal capture.
The usual technical conditions were as follows:
250 mm is the diameter of the field acquisition
1.3 mm is the collimation of X-ray beam
0.9–1.8 mm is the thickness of the reconstructed cut
90 KV is the voltage
512/512 is the matrix of the reconstructed cut
0.7 Mas is the pitch
For 100 Mas, 4 mGy of radiation is delivered per blade volume
For 75 Mas, 3 mGy of radiation is delivered per blade volume (information from ELSCINT).
In comparison, the radiation delivered for 60 Mas and 60 KV by a conventional teleradiographic device is 1.5 mGy when the X-ray source is located at a distance of 4 m and 6 mGy at a distance of 2 m. The delivered radiation for 60 Mas and 60 KV for a conventional orthopantomograph is thus 13.5 mGy (information supplied by Philips).
In addition, the primary beam of the computed tomography (CT) scan avoids the thyroid. The original 2D CT scans are then transferred by Ethernet network to a workstation. After being converted, they are processed by C2000 software developed by CIRAD at Montpellier, France.
The C2000 software
The software developed by CIRAD using scanner-generated data provides images and 3D biometry of the anatomical features.
In this study, the database used by the software comprises axial TDM slices of the inferior-superior dimension.
C2000 generates 3D images from the CT data using the thresholds method and the diving cube to define areas with identical values within a volume. In this way, it is possible to reconstruct the maxillofacial anatomical features (teeth or roots, bones, and skin). 3D muscle reconstruction can also be performed. Information technology can thus be deployed to isolate or, on the contrary, combine each of these features with more or less transparency and depth in relation to each of the other.
Teeth segmentation
On the native slices, C2000's cephalometric module segments the teeth, i.e., separates and attributes the different dental zones [Figure 1].
Figure 1.

Axial cut illustrating segmentation of teeth
Once the segmentation of the teeth is performed, the C2000 software can calculate the volume expressed in voxels and in cubic millimeters, density, and center of gravity, for the semi-arch and the complete arch.
In this study, two selection techniques were used.
MANUAL SELECTION
The process is done by selection and “contouring” of the different segments.
The different segments, i.e., the different anatomical structures, are segmented and contoured for each slice. The operator then attributes each anatomic structure to its appropriate zone.
SEMI-AUTOMATIC SELECTION
The thresholding technique can help recognize and confine the teeth.
Thresholding is a straightforward technique designed to take out from a native image the dots (or pixels) which have a density falling within given limits. This processing makes it possible to select dots on the image according to their level of gray. Different density zones can then be distinguished from bone and from one another. The operator, however, needs to be involved as he/she attributes a specific segment to the corresponding teeth in the event of two teeth being in contact with one another.
According to the digital data of the 2D axial cuts, C2000 software can realize a 3D reconstruction [Figure 2a–c]. After the selection, the software allows tooth volume calculation in voxels and cubic millimeters.
Figure 2.

Teeth reconstruction: (a) Frontal view. (b) Left profile view. (c) Right profile view
Segmentation of roots and crowns
Root volumes are calculated using the same procedure but by segmenting only those slices which include the root [Figure 3a–c].
Figure 3.

Root reconstruction: (a) Frontal view. (b) Left lateral view. (c) Right lateral view
The borderline slice between root and crown is defined by the C2000 software using computer tools to distinguish the gray levels [Figure 4].
Figure 4.

Axial cut showing the borderline between root and crown at the level of 17 and 27
The definition is therefore based primarily on density-related factors (enamel density being higher than other dental structures).
Verification by the operator of the anatomic segmentation is performed visually.
The crown is obtained simply by subtracting the root from the remainder of the tooth.
By segmenting each 2D axial slice of the structures belonging to each tooth or root, the C2000 software provides a 3D reconstruction of the whole teeth or the root; the C2000 software provides a 3D reconstruction of the whole teeth or the roots alone.
TRANSVERSE AND AXIAL DIMENSION MEASUREMENTS
On the axial cut, the theoretical buccolingual and mesiodistal widths are measured by the C2000 software without taking into consideration the inclination or torque of the tooth (buccolingual width) and the angulation or tip of the tooth (mesiodistal width).
True width determination of each tooth is calculated from theoretical width estimation given by the C2000 software taking into account the inclination and the angulation of the tooth according to the following formulae:
Dbt= Dbth× cos (a)
Where Dbt is the true buccolingual width
Where Dbth is the theoretical buccolingual width
Where a is the third order information angle (torque).
Dmt= Dmth× cos (b)
Where Dmt is the true mesiodistal width
Where Dmth is the theoretical mesiodistal width
Where b is the second order information (tip).
STATISTICAL ANALYSIS
Mean values and standard deviation of respectively root, crown, and entire measurements, and volumes of each tooth are calculated and matched to the available bibliographic data.
Dimensions of the different group of teeth and their relationship are analyzed using the mathematical correlation coefficients method.
RESULTS
LINEAR MEASUREMENTS
Tables 1 and 2 include linear measurements calculated according to the angle modification as described before.
Table 1.
Linear measurements for the upper arch

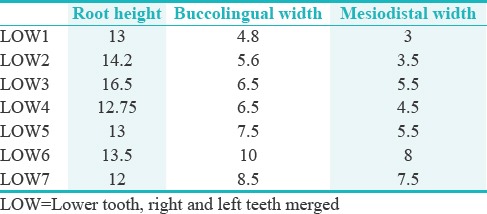
Table 2.
Linear measurements for the lower arch
VOLUME MEASUREMENTS
Following volumes are calculated in cubic millimeters.
T is tooth volume as a whole
R is radicular volume
C is coronal volume.
Difference between the two sides (right and left) is slight and does not affect the anchorage values.
For this reason, the difference in tooth size on each side was not considered and both sides were merged [Histogram 1–3].
Histogram 1.

Volume values for each category of the tooth
Histogram 3.

Crown volume values for each category of the tooth
Histogram 2.

Root volume values for each category of the tooth
The results presented in Tables 3–5 define new volume references for each type of tooth.
Table 3.
Volume values for each category of tooth

Table 5.
Volume values for each category of root

Table 4.
Volume values for each category of crown

The volume is expressed by the variation coefficient.
MEASUREMENTS OF DIFFERENT DENTAL SEGMENTS AND RELATIONSHIP AMONG THEM
Average mean and standard deviation of different dental segments
Coronal, radicular, and total dental volumes are grouped as follows:
UPP INC: 4 upper incisors (upper anterior segment)
LOW INC: 4 lower incisors (lower anterior segment)
6 UPP ANT: 4 upper incisors and canines
6 LOW ANT: 4 lower incisors and canines
UPP MOL: Upper first and second molars (upper posterior segment)
LOW MOL: Lower first and second molars (lower posterior segment)
MAXI: Whole maxillary dentition
MANDI: Whole mandibular dentition.
The two histograms [Histograms 4 and 5] show the volume values of teeth segments and root groups that are most involved throughout the course of orthodontic treatment.
Histogram 4.

Volume values of different segments of teeth
Histogram 5.

Root volume values of different segments of teeth
Correlation among dental segments
The correlation matrix among dental segments volumes of different teeth segments allows the understanding of the morphological relationship among them.
DISCUSSION
The key findings of this study were new linear and volume measurements.
LINEAR MEASUREMENTS
The comparison of our results with the bibliographic data shows that the classical authors have considered the front teeth with a more squarish shape and the molars with a more tapered anatomy.[10,11,12,13]
According to Lautrou,[14] the dimensions of the upper teeth are as follows:
Upper central incisor: L =13 mm, d = 7 mm
Upper lateral incisor: L =13 mm, d = 5 mm
Upper canine: L =17 mm, d = 5,5 mm
Upper second premolar: L =14 mm, d = 5 mm
Upper first molar: L =13 mm, d = 8 mm
Upper second molar: L =12 mm, d = 7 mm.
(Where L = length and d = mesiodistal width).
VOLUME MEASUREMENTS
We noticed that the whole volume of the tooth is unvarying than the crown volume alone, which in turn is more stable than the root volume alone and this is true for both maxilla and mandible.
By analyzing [Histograms 1–3], several remarks can be drawn.
MEANS
Classical concepts in orthodontics are questioned:
Difference between maxillary first and second premolar is not significant (around 3%). It does not dictate in itself the systematic avulsion of second premolar instead of the first as advocated by some orthodontic schools
On the other hand, difference between first and second mandibular premolar is more important (around 14%) and justifying the removal of first premolar rather than the second
Difference between mandibular central and lateral incisor is about 7.6% which is less than the values found in the literature[15,16,17]
First and second lower molar displayed almost same volume.
VARIATION COEFFICIENT
The highest variation coefficient is observed in a decreasing order on the maxillary and mandibular canine, lateral upper incisors, and lower second premolar.
These findings are unexpected for the canines but not for the other teeth mentioned before (tooth anatomy is unstable).
DIMENSIONS OF THE DIFFERENT DENTAL SEGMENTS AND WITHIN THE SEGMENTS
Average mean and standard deviation of different dental segments
Histograms 4 and 5 show the lack of precaution often neglected by some orthodontic schools when dealing with some treatments:
Maxillary incisor retraction using a base arch relying only on the maxillary first molars as anchorage
En masse retraction of the six anterior teeth (on both maxilla and mandible) when anchorage is considered on first and second molars.
Correlation among different dental segments
Correlation coefficient among teeth segments is most of the time highly significant.
In Table 6, a high correlation is found among teeth within the same maxillary and mandibular segments (UPP INC/LOW INC; UPP MOL/LOW MOL) and a less significant correlation among anterior and posterior segments of the same arch (UPP INC/UPP MOL; LOW INC/LOW MOL), which is unexpected.
Table 6.
Correlation matrix among total volumes of the different segments of teeth

Based on the size of the sample, correlation coefficient between two measurements is significant when r ≥0.2636 at the significance level of 1%, r ≥0.1606 at the significance level of 1%, and r ≥0.1353 at the significance level of 5% [Table 6].
The correlation coefficient is less significant between the anterior segment of an arch and the posterior segment of the other.
More precision and accuracy were given by the 3D scanner compared to the previous studies.[14,18]
The authors think that this study could be a starting point for systematic reviews and future researches redefining anchorage concept in orthodontics.
CONCLUSION
This research aimed to set new morphological dental values, with linear and volume measurements.
The findings of this study question the validity of inherited ideas in dental anatomy regarding average dimensions on the morphological variability. Most common example is related to dimension differences first and second premolars.
These results might interfere in treatment plan decision, thus suggesting different extraction choices.
Orthodontic mechanotherapy is likely to be modified, following a better understanding of anchorage concept.
FINANCIAL SUPPORT AND SPONSORSHIP
Nil.
CONFLICTS OF INTEREST
There are no conflicts of interest.
REFERENCES
- 1.Lee RJ, Weissheimer A, Pham J, Go L, de Menezes LM, Redmond WR, et al. Three-dimensional monitoring of root movement during orthodontic treatment. Am J Orthod Dentofacial Orthop. 2015;147:132–42. doi: 10.1016/j.ajodo.2014.10.010. [DOI] [PubMed] [Google Scholar]
- 2.Treil J, Casteigt J, Faure J, Borianne P. 3D Cephalometry: Principles and method. J L’édgewise. 2000;41:69–86. [Google Scholar]
- 3.Saghafi N, Heaton LJ, Bayirli B, Turpin DL, Khosravi R, Bollen AM, et al. Influence of clinicians’ experience and gender on extraction decision in orthodontics. Angle Orthod. 2017;87:641–50. doi: 10.2319/020117-80.1. [DOI] [PMC free article] [PubMed] [Google Scholar]
- 4.Changsiripun C, Phusantisampan P. Attitudes of orthodontists and laypersons towards tooth extractions and additional anchorage devices. Prog Orthod. 2017;18:19. doi: 10.1186/s40510-017-0174-0. [DOI] [PMC free article] [PubMed] [Google Scholar]
- 5.Jackson TH, Guez C, Lin FC, Proffit WR, Ko CC. Extraction frequencies at a university orthodontic clinic in the 21st century: Demographic and diagnostic factors affecting the likelihood of extraction. Am J Orthod Dentofacial Orthop. 2017;151:456–62. doi: 10.1016/j.ajodo.2016.08.021. [DOI] [PMC free article] [PubMed] [Google Scholar]
- 6.Freeman DC. Memphis, Tenn, USA: University of Tennessee; 1965. Root Surface area Related to Anchorage in the Begg Technique. Ph.D. Thesis. [Google Scholar]
- 7.Jarabak JR, Fizzell JA. St. Louis: The C.V. Mosby Co.; 1972. Technique and Treatment with the Light wire Appliances. [Google Scholar]
- 8.Faure J, Baron P. JUSTUMUS P. The substitution therapy: preliminary results. J Edge. 1992;25:123–47. [Google Scholar]
- 9.Kim J, Lagravére MO. Accuracy of Bolton analysis measured in laser scanned digital models compared with plaster models (gold standard) and cone-beam computer tomography images. Korean J Orthod. 2016;46:13–9. doi: 10.4041/kjod.2016.46.1.13. [DOI] [PMC free article] [PubMed] [Google Scholar]
- 10.Alam MK, Shahid F, Purmal K, Sikder MA, Saifuddin M. Human mesiodistal tooth width measurements and comparison with dental cast in a Bangladeshi population. J Contemp Dent Pract. 2015;16:299–303. doi: 10.5005/jp-journals-10024-1679. [DOI] [PubMed] [Google Scholar]
- 11.Sah SK, Zhang HD, Chang T, Dhungana M, Acharya L, Chen LL, et al. Maxillary anterior teeth dimensions and proportions in a central mainland Chinese population. Chin J Dent Res. 2014;17:117–24. [PubMed] [Google Scholar]
- 12.Celikoglu M, Nur M, Kilkis D, Sezgin OS, Bayram M. Mesiodistal tooth dimensions and anterior and overall Bolton ratios evaluated by cone beam computed tomography. Aust Orthod J. 2013;29:153–8. [PubMed] [Google Scholar]
- 13.Zhang F, Suh KJ, Lee KM. Validity of intraoral scans compared with plaster models: An in vivo comparison of dental measurements and 3D surface analysis. PLoS One. 2016;11:e0157713. doi: 10.1371/journal.pone.0157713. [DOI] [PMC free article] [PubMed] [Google Scholar]
- 14.Lautrou A. 2nd ed. France: Masson; 2006. Dental Anatomy. [Google Scholar]
- 15.Tasanapanont J, Apisariyakul J, Wattanachai T, Sriwilas P, Midtbø M, Jotikasthira D, et al. Comparison of 2 root surface area measurement methods: 3-dimensional laser scanning and cone-beam computed tomography. Imaging Sci Dent. 2017;47:117–22. doi: 10.5624/isd.2017.47.2.117. [DOI] [PMC free article] [PubMed] [Google Scholar]
- 16.Kim SR, Kim CM, Jeong ID, Kim WC, Kim HY, Kim JH, et al. Evaluation of accuracy and repeatability using CBCT and a dental scanner by means of 3D software. Int J Comput Dent. 2017;20:65–73. [PubMed] [Google Scholar]
- 17.Sang YH, Hu HC, Lu SH, Wu YW, Li WR, Tang ZH, et al. Accuracy assessment of three-dimensional surface reconstructions of in vivo teeth from cone-beam computed tomography. Chin Med J (Engl) 2016;129:1464–70. doi: 10.4103/0366-6999.183430. [DOI] [PMC free article] [PubMed] [Google Scholar]
- 18.Nelson S. 10th ed. Elsevier; 2014. sWheeler's Dental Anatomy, Physiology and Occlusion. [Google Scholar]