

Abstract
Background/aims
The purpose of the study was to create a standardised protocol for choroidal thickness measurements and to determine whether choroidal thickness measurements made on images obtained by spectral domain optical coherence tomography (SD-OCT) and swept source (SS-) OCT from patients with healthy retina are interchangeable when performed manually or with an automatic algorithm.
Methods
36 grid cell measurements for choroidal thickness for each volumetric scan were obtained, which were measured for SD-OCT and SS-OCT with two methods on 18 eyes of healthy volunteers. Manual segmentation by experienced retinal graders from the Vienna Reading Center and automated segmentation on >6300 images of the choroid from both devices were statistically compared.
Results
Model-based comparison between SD-OCT/SS-OCT showed a systematic difference in choroidal thickness of 16.26±0.725 μm (p<0.001) for manual segmentation and 21.55±0.725 μm (p<0.001) for automated segmentation. Comparison of automated with manual segmentations revealed small differences in thickness of −0.68±0.513 μm (p=0.1833). The correlation coefficients for SD-OCT and SS-OCT measures within eyes were 0.975 for manual segmentation and 0.955 for automatic segmentation.
Conclusion
Choroidal thickness measurements of SD-OCT and SS-OCT indicate that these two devices are interchangeable with a trend of choroidal thickness measurements being slightly thicker on SD-OCT with limited clinical relevance. Use of an automated algorithm to segment choroidal thickness was validated in healthy volunteers.
INTRODUCTION
The human choroid is 220–300 μm thick at posterior pole and 100–150 μm at the periphery normal subjects.1 It partially consists of blood vessels which are surrounded by melanocytes, nerves, connective tissue and watery mucinous extracellular fluid.2 Variability in vessel diameter and consequently choroidal thickness is larger in the posterior part of the choroid due to a greater concentration of arteries and large-sized and medium-sized choroidal veins.2 In normal ocular physiology, the choroid has the important role of providing nourishment, but it is also relevant in the pathogenesis of various retinal diseases. Studies have shown that changes in choroidal thickness are pathognomonic in a number of diseases such as age-related macular degeneration, diabetic retinopathy and pathological myopia.3–5
In general, three main approaches are available to image the choroid and adjacent deep structures with optical coherence tomography (OCT): using ‘enhanced depth imaging’ (EDI) in 840 nm spectral domain (SD)-OCT and positioning the zero-delay line close to the choroidal border,6 considering that objects imaged close to the zero-delay line have greater signal intensity than those further away from the zero-delay line. The second approach is using a longer central wavelength light source between 1040 and 1060 nm to enhance light transmission to the posterior choroidal boundary. The third approach is OCT angiography which provides high resolution visualisation of the vascular structure in three dimensions.7
A few studies have reported measurement of the choroid by SD-OCT with 840 and 1050 nm wavelengths with and without EDI.8–13 Others have compared measurements of choroidal thickness from different machines with one single measurement.14 Hence, no conclusion has been reached on the most reliable modality to precisely determine choroidal thickness. The primary purpose of this study was to create a standardised protocol for choroidal thickness measurements and to determine whether in patients with healthy retina the choroidal thickness data measured by SD-OCT in the EDI mode are consistent with that measured by swept source (SS)-OCT instruments at longer wavelength. Thickness measurements obtained by automated and manual segmentation of the choroid were also compared.
MATERIALS AND METHODS
Participants included in this cross-sectional study were white Caucasians, had a minimum age of 18 years, a normal condition of the retina, clear media and no pupil dilatation. Both eyes of all participants were OCT-scanned. All scans of each participant were obtained within 1 h on the same day.
The study was conducted in accordance with the tenets of the Declaration of Helsinki and the ethics committee of the Medical University of Vienna. All participants provided written informed consent prior to inclusion.
OCT imaging
Participants were imaged both with SD-OCT emitting at a central wavelength of 840 nm using the EDI mode (Spectralis OCT, Heidelberg Engineering, Dossenheim, Germany, software (V.1.5.2.0)), and with swept source (SS)-OCT (deep range imaging OCT-1, Topcon Medical Systems, Oakland, New Jersey, USA, software (V.9.10)) with a light source of 1050 nm wavelength which has a greater depth sensitivity than conventional SD-OCT. Scan patterns covering an area of 6×6 mm were used for both instruments: SD-OCT with a scanning pattern of 512×97 A-scans and automated real-time averaging activated at 50 frames and SS-OCT with a scanning pattern of 256×256 A-scans using single frames.
Reading procedures for the manual annotation
Thirty-six (2×18) volumetric scans were exported in raw format and manually annotated using customised Vienna Reading Center software. As a first step, the posterior edge of the retinal pigment epithelium (RPE)–Bruch’s membrane complex was defined as the upper border of the choroid. As a second step, the lower border of the choroid was defined as the choroid–scleral interface and manually segmented on every B-scan, obtaining a total of more than 6300 B-scans (SS-OCT: 18×256, SD-OCT: 18×97). The choroid–scleral interface was defined as a hyporeflective line between the large vessel layer of the choroid and the sclera. Every volume scan was segmented by one trained grader; in total we had five graders. Graders manually set the position of the fovea on every volumetric scan. Finally, an experienced retinal expert verified and corrected every segmentation if necessary. Local choroidal thickness was defined as the vertical distance between this segmentation line and the choroidal–scleral interface (figure 1).
Figure 1.
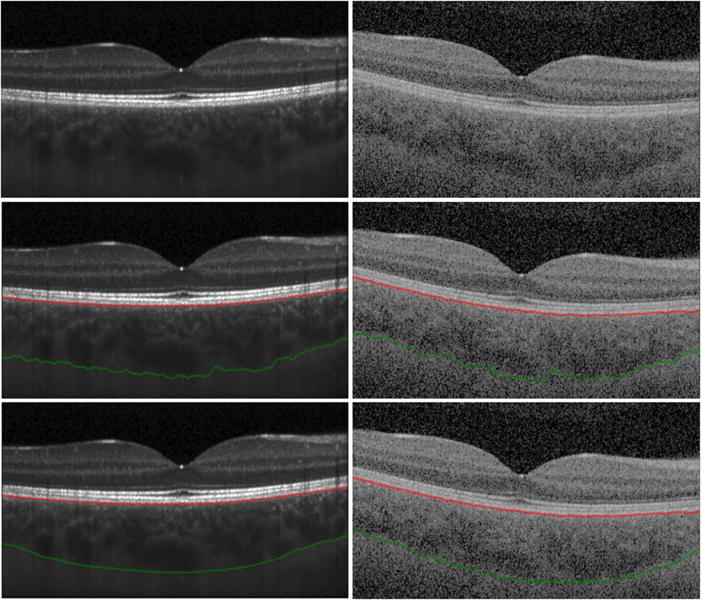
Spectral domain (SD) optical coherence tomography (OCT) and swept source (SS)-OCT B-scans with manual and automatic segmentations. (Left) B-scans from SD-OCT, (Right) B-scans from SS-OCT of the same eye. (Top) Original B-scan, (centre) retinal pigment epithelium segmentation (red line) and automated segmented choroidal–scleral interface (green line) are shown. Local choroidal thickness was defined as the vertical distance between these segmented lines; (bottom) manual segmented choroidal–scleral interface (green line) is shown.
Automated choroidal thickness measurement
Local choroidal thickness values were computed with a validated algorithm.15,16 A grid with 36 cells was chosen for comparability with commercially available software algorithms. Local choroidal thickness is calculated as the distance between Bruch’s membrane and the lower surface of the fitted thin-plate spline defining the outer surface of the choroidal vasculature as explained above. Figure 2 shows a commercial grid of the Topcon SS-OCT used in this study and an example of the computed grids.
Figure 2.
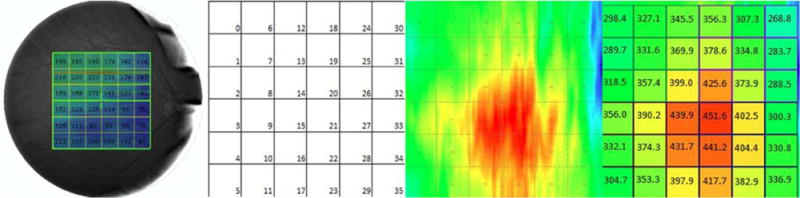
Fundus image showing choroidal thickness measures and example of choroidal thickness map of one eye from spectral domain optical coherence tomography (OCT). A square grid with 6×6 cells centred on the fovea was positioned over the choroidal thickness map. The mean choroidal thickness value was computed for every grid cell with a size of 1×1 mm2 each. All 36 (6×6) choroidal thickness values were compared between the two machines (spectral domain OCT and swept source OCT) and between manual and automated segmentations for each of the machines. (Left) Example of choroidal thickness map obtained from a commercial grid of the Topcon swept source OCT machine software. This grid consists of 6×6 cells with a length and width of 1 mm for each cell. This grid was subsequently used for developing the standardised choroidal thickness measurement method presented in this study. (Second) Choroidal grid with 6×6 cells, each cell comprising 1×1 mm2 is shown. (Third) Automated segmented map showing choroidal thickness in swept source OCT. (Right) Average choroidal thickness values for all 36 cells is shown.
Statistical analysis
A square grid with 6×6 cells centred on the fovea was positioned over the image. The mean choroidal thickness value was computed for every grid cell with a size of 1×1 mm2 each (figure 2). All 36 (6×6) choroidal thickness values were compared between the two machines (SD-OCT and SS-OCT) and between manual and automated segmentations for each of the machines. Values were presented as the mean value±SE.
A linear mixed model with machine (SS-OCT vs SD-OCT), segmentation (manual vs automatic) and the interaction between these variables as fixed effects was used to assess systematic differences between the instruments. The covariance structure of the collected data were modelled by incorporating random intercepts for eye and for cell nested in eye in the model. Thus, deviations from the usual independent sampling model have been accounted for. This model was calculated in SAS (V.9.3) and any other analysis was performed in R 3.1.3.17 The p values ≤0.05 were regarded as statistically significant.
The relation between SS-OCT and SD-OCT measures for each segmentation method were evaluated by calculating the correlation between these measures within eyes.18 We also present Bland–Altman plots to assess the agreement between SS-OCT and SD-OCT measurements.
RESULTS
Eighteen eyes from healthy participants (six men and three women) with a mean age of 23.0±1.8 years (range 21–28 years) were included in this study. As every participant was scanned with an SD-OCT and an SS-OCT, 36 volumetric scans with a total of 6354 B-scans were available. These 6354 B-scans were each manually segmented, choroidal thickness was measured and the results were compared (figure 2).
Comparison of SD-OCT and SS-OCT using manual segmentation
Total mean choroidal thickness was 315±9.7 μm when measured on SD-OCT images and 299±9.7 μm when measured on SS-OCT images with manual segmentation of the choroid. Comparison between these two machines showed a mean difference of 16.26±0.725 μm (p<0.0001) (see tables 1 and 2). A descriptive presentation of the observed differences between both measures is shown in online supplement 1, with Bland–Altman plots for illustration of SS-OCT and SD-OCT agreement processed with manual segmentation. Measurement values taken from the same eye are depicted with similar capital letters. We see that most of the observed differences range between −20 and 50 μm. Deviations outside this range are mostly observed for two eyes (marked as G and O).
Table 1.
Model-based estimates of group means
| Machine | Segmentation | Mean (μm) | SE (μm) | p Value |
|---|---|---|---|---|
| SD-OCT | 316.29 | 9.7186 | <0.0001 | |
| SS-OCT | 297.39 | 9.7186 | <0.0001 | |
| auto | 306.5 | 9.7186 | <0.0001 | |
| man | 307.18 | 9.7186 | <0.0001 | |
| SD-OCT | auto | 317.27 | 9.7254 | <0.0001 |
| SD-OCT | man | 315.31 | 9.7254 | <0.0001 |
| SS-OCT | auto | 295.73 | 9.7254 | <0.0001 |
| SS-OCT | man | 299.05 | 9.7254 | <0.0001 |
Least-square-means for choroid thickness obtained by manual or automatic segmentations.
Auto, automated; man, manual; OCT, optical coherence tomography; SD, spectral domain; SS, swept source.
Table 2.
Model-based estimates of group differences
| Machine | Segmentation | Machine | Segmentation | Mean_diff (μm) | SE (μm) | p Value |
|---|---|---|---|---|---|---|
| SD-OCT | SSOCT | 18.9023 | 0.5127 | <0.0001 | ||
| auto | man | −0.6823 | 0.5127 | 0.1833 | ||
| SD-OCT | auto | SDOCT | man | 1.9611 | 0.725 | 0.0069 |
| SD-OCT | auto | SSOCT | auto | 21.5457 | 0.725 | <0.0001 |
| SD-OCT | auto | SSOCT | man | 18.2199 | 0.725 | <0.0001 |
| SD-OCT | man | SSOCT | auto | 19.5846 | 0.725 | <0.0001 |
| SD-OCT | man | SSOCT | man | 16.2588 | 0.725 | <0.0001 |
| SS-OCT | auto | SSOCT | man | −3.3258 | 0.725 | <0.0001 |
Differences in choroidal thickness between machines and segmentation method show that SD-OCT measures are on average 18.9 μm higher than SS-OCT measures (p<0.0001). While comparison between the two methods manual (man) versus automatic (auto) shows no statistically significant differences (p=0.1833).
diff, difference; OCT, optical coherence tomography; SD, spectral domain; SS, swept source.
The functional relation between both measures is displayed in online supplement 1, with scatterplot illustrating the relationship between SS-OCT and SD-OCT measures processed with manual segmentation. Measurement values taken from the same eye are depicted with similar capital letters. A different regression line was fitted for each eye.
We see that it is reasonable to assume a tight linear relationship underlying the observed SS-OCT and SD-OCT measurements. We also see that the slope of this relation seems to be identical for all eyes. The correlation within measurements taken from the same eye was 0.975 (p<0.001).
Comparison of SD-OCT and SS-OCT using automated segmentation
Total mean choroidal thickness was 317±9.7 μm when measured on SD-OCT images and 296±9.7 μm when measured on SS-OCT images with automatic segmentation. Comparison between these two machines showed a mean difference of 21.55 ±0.725 μm (p<0.0001) (see tables 1 and 2). A descriptive presentation of the observed differences between both measures is shown in online supplement 2. We see that most of the observed differences range between −20 and 60 μm. Extreme deviations outside this range are mostly observed for two eyes (marked as Q and F).
The functional relation between both measures is displayed in online supplement 2. Measurement values taken from the same eye are depicted with similar capital letters. A different regression line was fitted for each eye.
We see that it is reasonable to assume a tight linear relationship underlying the observed SS-OCT and SD-OCT measurements. We also see that the slope of this relation seems to be identical for all eyes. The correlation within measurements taken from the same eye was 0.955 (p<0.001).
Comparison of automated and manual segmentations
Comparison between manually and automatically segmented choroidal thicknesses showed an overall difference of −0.68 ±0.513 μm (p=0.1833) (see table 2).
DISCUSSION
This study addresses the important challenge of comparing data obtained with different commercial OCT systems using different acquisition protocols and analysis methods. Comparison is most relevant for OCT images of deep ocular structures such as the choroid because sensitivity decreases with depth due to light scattering or absorption by the RPE. Thus, critical information may be missed and choroidal thickness measurements may be unreliable. A precise and fast determination of choroidal variable is essential, especially as there is evidence that many retinal pathologies such as age-related macular degeneration and diabetic retinopathy are associated with changes at the choroidal level.3,4 Investigations are currently focusing on the question how the appearance or the topography of the choroid is related to pathological retinal conditions, for example, in geographic atrophy or diabetic retinopathy, and whether the choroid itself has undergone pathological changes. To meet this need, a validated and reliable automated segmentation method such as the one presented in this study is urgently needed to evaluate choroidal thickness reliably and interchangeably from different machines’ images.
A recent study by Zhang et al compared choroidal thickness measurements between SD-OCT (Topcon) and SS-OCT (Topcon).19 They used the same automated algorithm for segmenting the choroid and compared the results on the data of both instruments and found a similar performance. Our study consisted of a complete manual segmentation (97 B-scans for each SD-OCT EDI scan, Spectralis and 256 B-scans for each SS-OCT, Topcon), which could increase reliability. We obtained mean choroidal thickness locally per grid cell (1 mm2) and compared grid versus grid between the two machines and the two methods. In addition, our method allows choroidal thickness and its changes to be measured for the entire posterior pole as ‘mean choroidal thickness’ and in specific regions of the retina in different diseases such as age-related macular degeneration and diabetic retinopathy, which have been the issue in earlier studies.3,12 The described method can also be used to compare choroidal thickness of the corresponding area of the contralateral eye or for evaluation of the corresponding area in the same eye over an extended follow-up period. Additionally, as it is an automated method, large patient groups can be studied in an efficient manner. As investigations could be more dynamic using this automated method of measuring choroidal thickness and displaying it topographically, we compared choroidal thickness between manual and automatic segmentation. The results showed a small mean difference in thickness (<1 μm), with no statistical significance. This indicates that there is no systematic bias between both methods.
Our study in healthy eyes offers a direct comparison between SD-OCT and SS-OCT machines that use different wavelengths for the analysis of choroidal thickness. Previous studies in healthy and diseased eyes used different evaluation methods ranging from single-point subfoveal manual measurement and several individual point macular manual measurements to automated choroidal thickness measurements.20–24 In this study, investigating the intermachine reproducibility of choroidal thickness measurements in healthy volunteers, we observed a good agreement between SD-OCT and SS-OCT measures with a high correlation between measures taken within one eye (0.955 for automatic and 0.975 for manual segmentation). Nevertheless, SD-OCT measures seem to be a roughly 20 μm higher on average (16.25 μm for manual and 21.26 μm for automatic segmentation). In relation to a thickness of 300 μm, this systematic deviation equals approximately 7%. Previous studies comparing choroidal thickness between SD-OCT and SS-OCT demonstrated reproducibility, however, with variable mean thickness values. These studies used different imaging and/or measurement protocols, measuring the choroidal thickness from one single B-scan at a single or at multiple points or measuring the choroidal thickness on more than one B-scan.10,11,21,23 The difference between SD-OCT and SS-OCT may be explained by different manufacturer calibrations of the pixel size for the two OCT machines yielding slight differences in absolute thickness measurements.23 Another explanation may be the different scanning protocols used. While we used data derived from a scan of 6×6 mm area with 36 averaged measurements and obtained an average choroidal thickness of the whole macular region with a geographical map of the choroid, the above-mentioned studies used data comprised from a single line scan image. Data obtained from a volume scan could be more representative of choroidal thickness in the entire macular region.
The differences that may derive from the different wavelengths of the systems or position changes of the participant being examined should also be considered. The SS-OCT has the advantage of a longer operating central wavelength, with a lower signal decay compared with SD-OCT resulting in higher contrast in the choroid: The 1050 nm OCT system penetrates deeper and consequently has increased sensitivity for the posterior choroidal boundary and the sclera, allowing superior visualisation of the chorioscleral interface, while the SD-OCT system with a light source of 840 nm does not penetrate as deeply and has a higher portion of scattered light. We obtained SD-OCT images following a state-of-the-art protocol by using EDI and automated real-time averaging activated at 50 frames to overcome the compromised depth penetration. This averaging may also be responsible for slight differences in choroidal thickness measurements due to smoothing effects.
Participants were examined on both machines within 1 h on the same day. Nevertheless, slight changes in choroidal thickness due to the participant moving from one machine to the other cannot be ruled out.22 This highlights the important influence of patient-related characteristics together with image technology and investigator-chosen protocols. All of these variables have to be defined and standardised to obtain reliable insight into in vivo choroidal measurements.
A limitation of this study is the small number of patients studied; however, because of this small number, we were able to manually segment all 6354 B-scans slices in all scans by experts, giving a better reference standard.
In conclusion, our data show that an SD-OCT machine (Spectralis) with enhanced-depth imaging and an SS-OCT machine (Topcon) in young subjects with normal eyes are interchangeable in their reliability to determine choroidal thickness with a trend of choroidal thickness measurements being slightly thicker on SD-OCT which has limited clinical importance. Automated choroidal segmentation will be valuable in large scientific studies as well as in clinic routine.
Supplementary Material
Acknowledgments
Elise Langdon-Neuner. Readers: Jasenka Palavric, Sandra Piwonka, Kim Luu, Aleksandra Ranisavljev, Mariane Rappaport-Marinkovic and Tayyebatossadat Pour Seyed Aghaei.
Funding Austrian Federal Ministry of Economy, Family and Youth and the National Foundation for Research, Technology and Development, Vienna, Austria (Gerendas, Philip, Podkowinski, Leitner, Waldstein, Simader, Zhang, Bogunovic, Abramoff, Sonka, Schmidt-Erfurth). None (Faatz, Hagmann).
Footnotes
Competing interests MDA reports personal fees from IDx LLC, outside the submitted work; In addition, MDA has a patent Michael Abramoff licensed to University of Iowa. US-E, SMW, CS, DP, A-MP, RL, BSG and HB report grants from Austrian Federal Ministry of Economy, Family and Youth, National Foundation for Research, Technology and Development, during the conduct of the study. MS reports in addition that MS has a patent Milan Sonka licensed to University of Iowa. SMW reports non-financial support from Novartis, outside the submitted work. The Christian Doppler Laboratory for Ophthalmic Image Analysis (OPTIMA) receives funding by the Austrian Federal Ministry of Economy, Family and Youth (Philip, Gerendas, Waldstein, Simader, Podkowinski, Zhang, Bogunovic, Abramoff, Sonka, Schmidt-Erfurth). Sonka and Abramoff has received NIH funding for their institution and are inventors of USA patents with regards to n-dimensional graph search from which they receive royalties. Abramoff has received funding from Veterans Administration for his institution and is the owner of IDx LLC Co., where he serves as board member and consultant. Schmidt-Erfurth is a board member for Alcon, Bayer and Novartis, serves as consultant for Alcon, Bayer, Novartis and Boehringer-Ingelheim (past) and receives payments for lectures from Novartis and Bayer. None (Faatz, Hagmann).
Contributors Design of the study: BSG, A-MP and SMW. Conduct of the study: A-MP and LZ. Development of the automated choroidal image analysis approach: MDA, HB, MS and LZ. Data analysis and interpretation: A-MP, HB, BSG, RL, SMW, LZ, MDA, MS, and MH. Collection of data: A-MP, HF and LZ. Critical review and final approval: MDA, HB, BSG, HF, RL, DP, US-E, CS, MS, SMW, LZ, MH and A-MP.
Provenance and peer review Not commissioned; externally peer reviewed.
References
- 1.Sohn EH, Khanna A, Tucker BA, et al. Structural and biochemical analyses of choroidal thickness in human donor eyes. Invest Ophthalmol Vis Sci. 2014;55:1352–60. doi: 10.1167/iovs.13-13754. [DOI] [PMC free article] [PubMed] [Google Scholar]
- 2.Buggage RR, Torczynski E, Grossniklas HE. Choroid and Suprachoroid. In: Tasman W, Jäger E, editors. Duane’s clinical ophthalmology. Vol. 1. Philadelphia: Lippincott, Williams & Wilkins; 2005. Revised edn 2005. Ch 22. [Google Scholar]
- 3.Jirarattanasopa P, Ooto S, Nakata I, et al. Choroidal thickness, vascular hyperpermeability, and complement factor H in age-related macular degeneration and polypoidal choroidal vasculopathy. Invest Ophthalmol Vis Sci. 2012;53:3663–72. doi: 10.1167/iovs.12-9619. [DOI] [PubMed] [Google Scholar]
- 4.Gerendas BS, Waldstein SM, Simader C, et al. Three-dimensional automated choroidal volume assessment on standard spectral-domain optical coherence tomography and correlation with the level of diabetic macular edema. Am J Ophthalmol. 2014;158:1039–48. doi: 10.1016/j.ajo.2014.08.001. [DOI] [PMC free article] [PubMed] [Google Scholar]
- 5.Ikuno Y, Jo Y, Hamasaki T, et al. Ocular risk factors for choroidal neovascularization in pathologic myopia. Investt Ophthalmol Vis Sci. 2010;51:3721–5. doi: 10.1167/iovs.09-3493. [DOI] [PubMed] [Google Scholar]
- 6.Spaide RF, Koizumi H, Pozzoni MC. Enhanced depth imaging spectral-domain optical coherence tomography. Am J Ophthalmol. 2009;146:496–500. doi: 10.1016/j.ajo.2008.05.032. [DOI] [PubMed] [Google Scholar]
- 7.Jia Y, Bailey ST, Hwang TS, et al. Quantitative optical coherence tomography angiography of vascular abnormalities in the living human eye. Proc Natl Acad Sci USA. 2015;112:E2395–402. doi: 10.1073/pnas.1500185112. [DOI] [PMC free article] [PubMed] [Google Scholar]
- 8.Regatieri CV, Branchini L, Fujimoto JG, et al. Choroidal imaging using spectral domain optical coherence tomography. Retina. 2012;32:865–76. doi: 10.1097/IAE.0b013e318251a3a8. [DOI] [PMC free article] [PubMed] [Google Scholar]
- 9.Yasuno Y, Hong Y, Makita S, et al. In vivo high-contrast imaging of deep posterior eye by 1-microm swept source optical coherence tomography and scattering optical coherence angiography. Opt Express. 2007;15:6121–39. doi: 10.1364/oe.15.006121. [DOI] [PubMed] [Google Scholar]
- 10.Agawa T, Miura M, Ikuno Y, et al. Choroidal thickness measurement in healthy Japanese subjects by three-dimensional high-penetration optical coherence tomography. Graefes Arch Clin Exp Ophthalmol. 2011;249:1485–92. doi: 10.1007/s00417-011-1708-7. [DOI] [PubMed] [Google Scholar]
- 11.Copete S, Flores-Moreno I, Montero JA, et al. Direct comparison of spectral-domain and swept-source OCT in the measurement of choroidal thickness in normal eyes. Br J Ophthalmol. 2014;98:334–8. doi: 10.1136/bjophthalmol-2013-303904. [DOI] [PubMed] [Google Scholar]
- 12.Tan CS, Ngo WK, Cheong KX. Comparison of choroidal thicknesses using swept source and spectral domain optical coherence tomography in diseased and normal eyes. Br J Ophthalmol. 2015;99:354–8. doi: 10.1136/bjophthalmol-2014-305331. [DOI] [PubMed] [Google Scholar]
- 13.Matsuo Y, Sakamoto T, Yamashita T, et al. Comparisons of choroidal thickness of normal eyes obtained by two different spectral-domain OCT instruments and one swept-source OCT instrument. Invest Ophthalmol Vis Sci. 2013;54:7630–6. doi: 10.1167/iovs.13-13135. [DOI] [PubMed] [Google Scholar]
- 14.Rahman W, Chen FK, Yeoh J, et al. Repeatability of manual subfoveal choroidal thickness measurements in healthy subjects using the technique of enhanced depth imaging optical coherence tomography. Investt Ophthalmol Vis Sci. 2011;52:2267–71. doi: 10.1167/iovs.10-6024. [DOI] [PubMed] [Google Scholar]
- 15.Zhang L, Lee K, Niemeijer M, et al. Automated segmentation of the choroid from clinical SD-OCT. Invest Ophthalmol Vis Sci. 2012;53:7510–19. doi: 10.1167/iovs.12-10311. [DOI] [PMC free article] [PubMed] [Google Scholar]
- 16.Garvin MK, Abramoff MD, Kardon R, et al. Intraretinal layer segmentation of macular optical coherence tomography images using optimal 3-D graph search. IEEE Trans Med Imaging. 2008;27:1495–505. doi: 10.1109/TMI.2008.923966. [DOI] [PMC free article] [PubMed] [Google Scholar]
- 17.R Core Team. R: A language and environment for statistical computing. Vienna, Austria: R Foundation for Statistical Computing; 2015. http://www.R-project.org/ [Google Scholar]
- 18.Bland JM, Altman DG. Calculating correlation coefficients with repeated observations: Part 1—correlation within subjects. British Medical Journal. 1995;310:446. doi: 10.1136/bmj.310.6977.446. [DOI] [PMC free article] [PubMed] [Google Scholar]
- 19.Zhang L, Buitendijk GH, Lee K, et al. Validity of Automated Choroidal Segmentation in SS-OCT and SD-OCT. Invest Ophthalmol Vis Sci. 2015;56:3202–11. doi: 10.1167/iovs.14-15669. [DOI] [PMC free article] [PubMed] [Google Scholar]
- 20.Shao L, Xu L, Chen CX, et al. Reproducibility of subfoveal choroidal thickness measurements with enhanced depth imaging by spectral-domain optical coherence tomography. Invest Ophthalmol Vis Sci. 2013;54:230–3. doi: 10.1167/iovs.12-10351. [DOI] [PubMed] [Google Scholar]
- 21.Branchini L, Regatieri C, Flores-Moreno I, et al. Reproducibility of choroidal thickness measurements across three spectral domain optical coherence tomography systems. Ophthalmology. 2012;119:119–23. doi: 10.1016/j.ophtha.2011.07.002. [DOI] [PMC free article] [PubMed] [Google Scholar]
- 22.Mansouri K, Medeiros FA, Tatham AJ, et al. Evaluation of retinal and choroidal thickness by swept-source optical coherence tomography: repeatability and assessment of artifacts. Am J Ophthalmol. 2014;157:1022–32. doi: 10.1016/j.ajo.2014.02.008. [DOI] [PMC free article] [PubMed] [Google Scholar]
- 23.Margolis R, Spaide RF. A pilot study of enhanced depth imaging optical coherence tomography of the choroid in normal eyes. Am J Ophthalmol. 2009;147:811–15. doi: 10.1016/j.ajo.2008.12.008. [DOI] [PubMed] [Google Scholar]
- 24.Yamashita T, Yamashita T, Shirasawa M, et al. Repeatability and reproducibility of subfoveal choroidal thickness in normal eyes of Japanese using different SD-OCT devices. Invest Ophthalmol Vis Sci. 2012;53:1102–7. doi: 10.1167/iovs.11-8836. [DOI] [PubMed] [Google Scholar]
Associated Data
This section collects any data citations, data availability statements, or supplementary materials included in this article.