Abstract
It has been demonstrated that long non-coding RNAs (lncRNAs) are important in the gene regulatory network and their dysregulated expression has been implicated in cardiovascular disease. However, little is known regarding lncRNA expression patterns and their function in the progression of acute coronary syndromes (ACSs). In the present study, the expression profiles of lncRNAs from 52 patients with ACS were analyzed by re-annotating existing microarray data. The lncRNA expression profiles in the two distinct clinical entities of ACS, myocardial infarction (MI) and unstable angina (UA), were examined. Out of the 2,332 lncRNAs assessed, it was identified that 18 lncRNAs were upregulated and 35 lncRNAs were downregulated in patients with MI compared to those with UA. Furthermore, the expression profiles of patients with ACS were compared at different time points and significantly altered lncRNA expression was observed during the progression of ACS. A total of 7 candidate lncRNA biomarkers were identified and an lncRNA-based classifier was developed to predict MI risk based on the expression data of the 7 lncRNAs using random forest and support vector machine strategies. This achieved a classification accuracy of 90.38% with a sensitivity of 100% and a specificity of 68.75%. Additionally, functional analysis suggested that these 7 lncRNAs may be involved in known MI-associated biological processes and pathways.
Keywords: acute coronary syndrome, long non-coding RNAs, expression profiles, diagnosis
Introduction
Acute coronary syndrome (ACS), one of the most severe cardiovascular diseases, remains the leading cause of morbidity and mortality worldwide (1). ACS represents a spectrum of diseases arising from coronary atherosclerotic plaque rupture, ranging from unstable angina (UA) to ST-segment elevated myocardial infarction (2,3). Clinical management and patient outcomes may be improved by the early diagnosis and treatment of ACS. Therefore, it is necessary to identify novel biomarkers associated with the development and progression of ACS.
Advances in genomics and transcriptomics demonstrated that only 2% of the human genome is made up of protein-coding sequences and that the majority of the genome is transcribed into non-coding RNAs (ncRNAs) (4). Furthermore, ncRNAs may be divided into two distinctive types based on their size: Small ncRNAs and long non-coding RNAs (lncRNAs). LncRNAs are a class of ncRNAs ranging in length from ~200 nucleotides to 100 kilobases (kb) and they have gained widespread attention (5). Accumulating evidence has suggested that lncRNAs are a key component of the gene regulatory network (6). Furthermore, a large number of studies have highlighted the important roles lncRNAs serve in various biological processes, including epigenetics, genomic imprinting, nuclear organization, alternative splicing and nuclear import, by regulating gene expression at the transcriptional, post-transcriptional and epigenetic levels (7,8).
Aberrant expression patterns of lncRNAs have been widely observed in various diseases, such as cancer (9–11) and dysregulated lncRNAs may serve oncogenic or tumor suppressive roles in the development and progression of different types of cancer (12). For example H19, a lncRNA 2.3 kb long, exhibits oncogenic and tumor suppression properties in cancer (13). Additionally, previous studies have determined that the dysregulated lncRNA expression contributes to the development of cardiovascular diseases. It has been determined that lncRNA ANRIL is an important risk factor for coronary disease due to its involvement in regulating histone methylation (14,15). Furthermore, the lncRNA myocardial infarction-associated transcript is associated with myocardial infarction (MI) (16). However, knowledge of lncRNA expression patterns and their function in the progression of ACSs remains in its infancy.
In the present study, a genome-wide expression profile analysis was performed to identify the expression patterns between UA and MI, as well between patients with ACS 7 days post MI or UA and those patients with ACS 30 days post MI or UA. The present study aimed to determine the expression pattern of lncRNAs and facilitate the identification of functional lncRNAs associated with ACS progression.
Materials and methods
Patient dataset
The gene expression profiles of patients with ACS were collected from the GEO database (http://www.ncbi.nlm.nih.gov/geo/) under the accession number GSE29111 (https://www.ncbi.nlm.nih.gov/geo/query/acc.cg i?acc=GSE29111). This dataset measured the genome-wide gene expression on the blood samples from 36 patients with MI and 16 patients with UA at 7 and 30 days post-ACS using an Affymetrix HG-U133 Plus 2.0 Microarray (Affymetrix; Thermo Fisher Scientific, Inc., Waltham, MA, USA).
Acquisition and analysis of lncRNA expression profiles in patients with ACS
Probe annotation sequences for the Affymetrix HG-U133 Plus 2.0 Microarray were obtained from the Affymetrix website (http://www.affymetrix.com/). Raw gene expression data profiled from the Affymetrix HG-U133 Plus 2.0 Microarray for the GSE29111 dataset were downloaded and normalized using the Robust Multichip Average algorithm for background adjustment (17) and were log-transformed (base 2). To obtain the data for lncRNA expression, probes were re-annotated to known lncRNA sequences based on the annotation from the GENCODE project (http://www.gencodegenes.org, release 23) using protocols described in previous studies (18,19). A total of 3,578 lncRNA-specific probes were generated to represent 2,332 lncRNAs. If 1 lncRNA matched >1 probe, the expression of this lncRNA was calculated in accordance with the average expression value of all its corresponding probes.
Differentially expressed lncRNAs between patients with MI and those with UA, as well as between patients 7 days post MI or UA and those 30 days post MI or UA, respectively, were identified using the two-tailed Student's t-test. LncRNAs with P<0.01 were regarded as differentially expressed. Hierarchical clustering of levels of differentially expressed lncRNAs was performed with R software (version 3.2.3, https://www.r-project.org/) using the metric of euclidean distance and complete linkage. The χ2 test was utilized to test the significance of the association between the expression pattern of lncRNAs and disease status.
Statistics for classification and prediction
The support vector machine (SVM) method with the sigmoid kernel was used to perform classification analysis according to the expression of lncRNAs. R package e1071 (https://CRAN.R-project.org/package=e1071) was used for SVM-based classification. The performance of the lncRNA-based classifier, including its accuracy, sensitivity and specificity, was accessed using leave one out cross-validation (LOOCV). Briefly, in this procedure, only one patient served as a test sample and the remaining patients were training samples. This was repeated until all patients had been used as test samples. The area under a receiver operating characteristic (ROC) curve (AUC) was also used to evaluate the performance of the lncRNA-based classifier. The ROC curve was generated by plotting true positive rates (sensitivity) against false positive rates (1-specificity). All statistical analyses were performed using R statistical software (version 3.2.3, https://www.r-project.org/).
Bioinformatics analysis
Pearson's correlation coefficient (PCC) between the expression values of lncRNAs and mRNAs in the GSE29111 was initially calculated. The top 1% mRNAs (according to the PCC value) were selected as significantly co-expressed with lncRNAs. Subsequently, functional enrichment analysis was performed for these co-expressed mRNAs to identify the potential biological processes and pathways lncRNA may be involved in. This was performed using the DAVID Bioinformatics Tool (https://david.ncifcrf.gov/, version 6.8 limited to Gene Ontology (GO) terms in the ‘Biological Process’ (GOTERM-BP-FAT) and Kyoto Encyclopedia of Genes and Genomes (KEGG) pathway categories (20). Biological processes and pathways with P<0.05 and an enrichment score of >1.5 obtained from DAVID Bioinformatics Tool (https://david.ncifcrf.gov/, version 6.8) were considered as a significant functional annotation.
Results
Altered lncRNA expression pattern between UA and MI
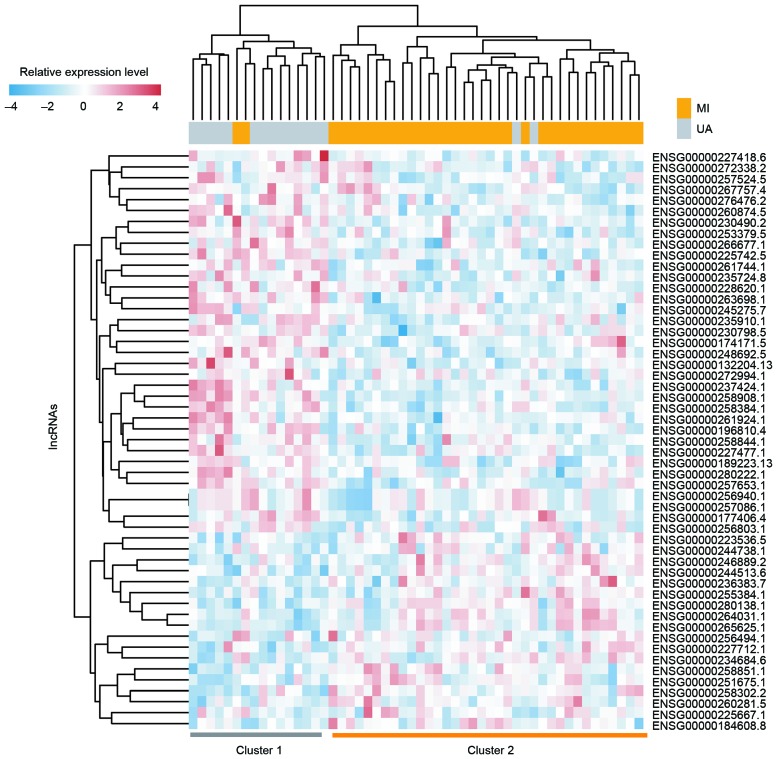
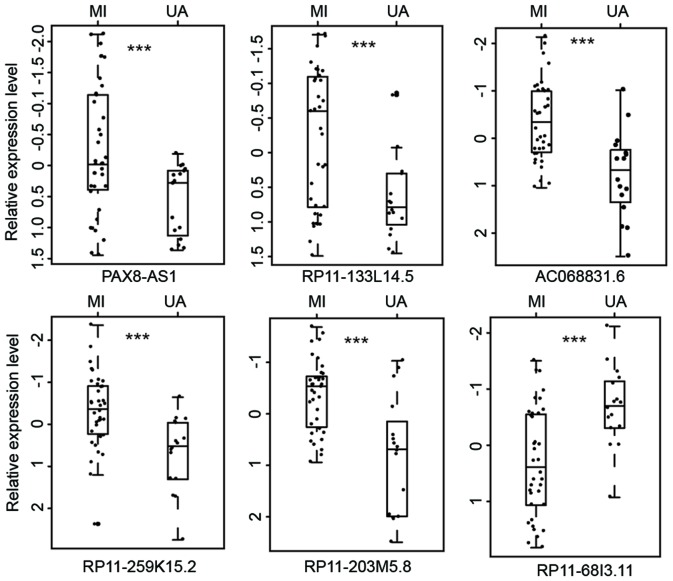
To investigate the expression patterns of lncRNA in UA and MI, the lncRNA expression profiles of 16 patients with UA and 36 with MI were compared to identify dysregulated lncRNAs. Among the 2,332 lncRNAs analyzed, differential expression between UA and MI was observed in 53 lncRNAs (P<0.01). Among these differentially expressed lncRNAs, 18 lncRNAs were upregulated and 35 lncRNAs were downregulated in patients with MI compared with patients with UA. Furthermore, unsupervised hierarchical clustering of 52 patients in the GSE29111 cohort was performed according to the expression pattern of these differentially expressed lncRNAs. The results revealed that all patients in the GSE29111 cohort were grouped into two distinctive patient clusters (16 patients in cluster 1 vs. 36 patients in cluster 2), which exhibited a strong association with clinical symptoms (P=2.356×10⁻⁸, χ2 test; Fig. 1). A total of 14 out of the 16 patients with UA (87.5%) were grouped into cluster 1 and 34 out of the 36 patients with MI (94.4%) were grouped into cluster 2 (Fig. 1). The 6 most differentially expressed lncRNAs with the lowest P-values in MI and UA are presented in Table I and Fig. 2. Of these 6 lncRNAs, 5 (AC068831.6, RP11-133L14.5, PAX8-AS1, RP11-259K15.2 and RP11-203M5.8; all P<0.001) were significantly upregulated and 1 (RP11-68I3.11, P<0.001) was significantly downregulated in patients with MI compared with those with UA (Table I).
Figure 1.
Two-dimensional hierarchical clustering of 52 patients with acute coronary syndromes based on the expression pattern of differentially expressed long non-coding RNAs in patients with myocardial infarction compared with those with unstable angina. All patients in the GSE29111 cohort were grouped into two distinctive patient clusters (16 patients in Cluster 1 vs. 36 patients in Cluster 2).
Table I.
The six most differentially expressed lncRNAs in MI and UA.
| lncRNA id | Ensemble name | Genome location | P-value | T-statistics | Fold-change |
|---|---|---|---|---|---|
| ENSG00000265625.1 | RP11-68I3.11 | Chromosome 17: 29,644,796–29,645,847 (−) | 2.017×10⁻⁴ | 4.102 | 1.475 |
| ENSG00000258384.1 | AC068831.6 | Chromosome 15: 90,952,239–90,955,225 (−) | 2.939×10⁻⁴ | −4.160 | 0.873 |
| ENSG00000256803.1 | RP11-133L14.5 | Chromosome 12: 10,015,240–10,030,606 (−) | 7.726×10⁻⁴ | −3.632 | 0.654 |
| ENSG00000189223.13 | PAX8-AS1 | Chromosome 2: 113,211,522–113,276,581 (+) | 7.733×10⁻⁴ | −3.592 | 0.835 |
| ENSG00000258844.1 | RP11-259K15.2 | Chromosome 14: 36,214,607–36,235,608 (+) | 8.311×10⁻⁴ | −3.720 | 0.888 |
| ENSG00000258908.1 | RP11-203M5.8 | Chromosome 14: 20,474,789–20,477,089 (−) | 9.441×10⁻⁴ | −3.865 | 0.679 |
lnRNA, long non-coding RNA; MI, myocardial infarction; UA, unstable angina.
Figure 2.
The six most differentially expressed long non-coding RNAs between MI and UA. ***P<0.001. MI, myocardial infarction; UA, unstable angina.
Identification of lncRNAs associated with the progression of UA
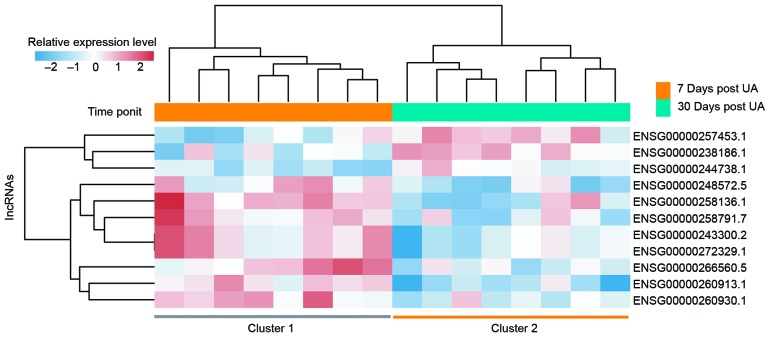
To identify the lncRNAs associated with the progression of UA, differentially expressed lncRNAs were identified between patients 7 days post UA and those 30 days post UA using a two-tailed Student's t-test. As a result, it was revealed that 11 lncRNAs were involved in UA progression (P<0.01). Of these, 3 lncRNAs are upregulated and 8 downregulated in the progression of UA. Subsequently, unsupervised hierarchical clustering analysis was performed for the 16 patients with UA according to the expression of the 11 differentially expressed lncRNAs. As expected, patients at different time points post-UA were grouped into two distinctive clusters following hierarchical clustering analysis (Fig. 3). One lncRNA (LINC01254) was regarded as the most differentially expressed between patients 7 days post UA and those 30 days post UA (Table II and Fig. 4). This lncRNA was significantly upregulated following the progression of UA (P<0.001).
Figure 3.
Two-dimensional hierarchical clustering of the 16 patients with UA based on the expression pattern of differentially expressed long non-coding RNAs between patients 7 days post UA and those 30 days post UA. Patients at different time points post UA were grouped into two distinctive clusters by hierarchical clustering analysis. UA, unstable angina.
Table II.
The most differentially expressed lncRNA between patients 7 days post UA and those 30 days post UA.
| lncRNA id | Ensemble name | Genome location | P-value | T-statistics | Fold change |
|---|---|---|---|---|---|
| ENSG00000260913.1 | LINC01254 | Chromosome 18: 10,405,133–10,414,515 (−) | 6.129×10⁻⁴ | 4.709 | 1.014 |
lncRNA, long non-coding RNA; UA, unstable angina.
Figure 4.
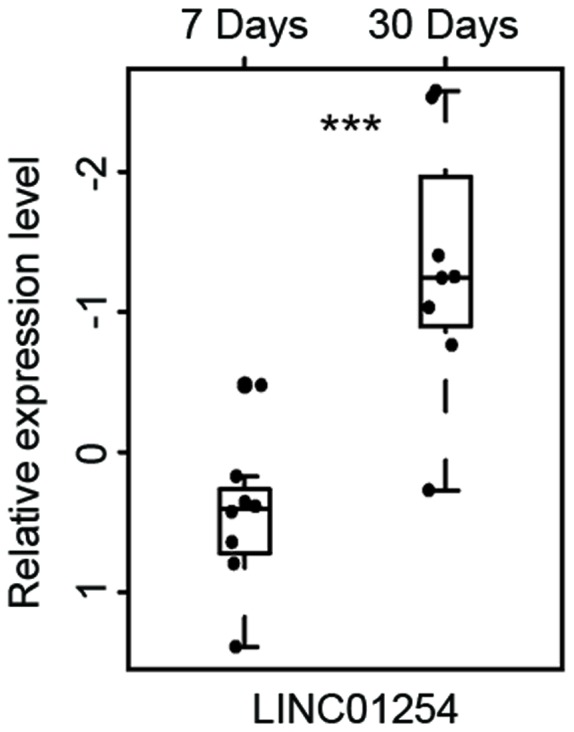
The most differentially expressed long non-coding RNA between patients 7 days post UA and patients 30 days post UA. ***P<0.001. MI, myocardial infarction; UA, unstable angina.
Identification of lncRNAs associated with the progression of MI
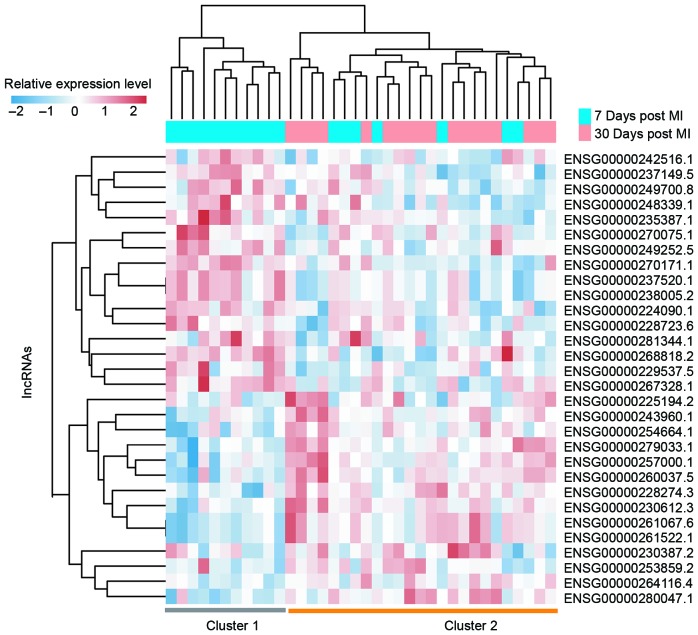
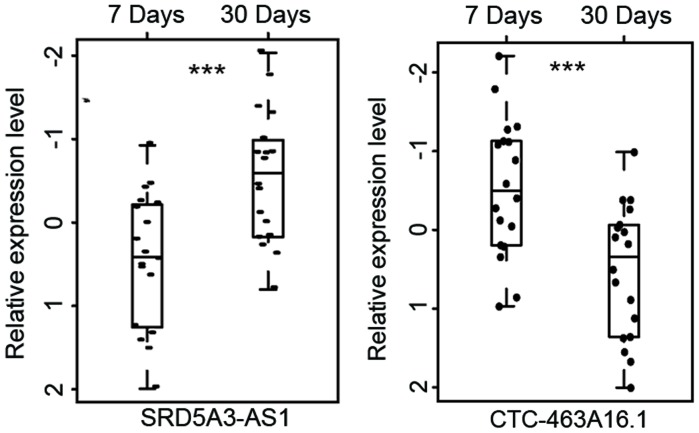
Comparative analyses of lncRNA expression profiles were performed between patients 7 days post MI and those 30 days post MI. A total of 30 lncRNAs were found to be associated with MI progression. Of these, 15 lncRNAs were upregulated and 15 were downregulated following MI progression (P<0.01). To determine the reliability of the aforementioned results, the same hierarchical clustering analysis for patients with MI was conducted. As expected, patients with MI were also clustered into two distinctive groups, which were significantly associated with MI status (P=4.653×10⁻⁴, χ2 test; Fig. 5). As observed in Fig. 5, 11 out of the 18 patients 7 days post MI (61.1%) were grouped into Cluster 1 and all patients 30 days post MI (100%) were grouped into Cluster 2. The two most differentially expressed lncRNAs between patients 7 days post MI and those 30 days post MI are presented in Table III and Fig. 6. Of these 2 lncRNAs, 1 lncRNA (CTC-463A16.1) was significantly upregulated (P<0.001) and the other lncRNA (SRD5A3-AS1) was significantly downregulated following MI progression (P<0.001).
Figure 5.
Two-dimensional hierarchical clustering of the 36 patients with MI based on the expression pattern of differentially expressed long non-coding RNAs between patients 7 days post MI and those 30 days post MI. Patients at different time points post MI were grouped into two distinctive clusters by hierarchical clustering analysis. MI, myocardial infarction.
Table III.
The two most differentially expressed lncRNAs between patients 7 days post MI and those 30 days post MI.
| lncRNA id | Ensemble name | Genome location | P-value | T-statistics | Fold change |
|---|---|---|---|---|---|
| ENSG00000249700.8 | SRD5A3-AS1 | Chromosome 4: 55,363,971–55,395,847 (−) | 7.305×10⁻⁴ | 3.713 | 1.113 |
| ENSG00000280047.1 | CTC-463A16.1 | Chromosome 5: 142,165,767–142,168,387 (+) | 8.507×10⁻⁴ | −3.659 | 0.901 |
lncRNA, long non-coding RNA; MI, myocardial infarction.
Figure 6.
The two most differentially expressed long non-coding RNAs between patients 7 days post MI and patients 30 days post MI. ***P<0.001. MI, myocardial infarction; UA, unstable angina.
Predictive value of lncRNAs in the diagnosis of MI
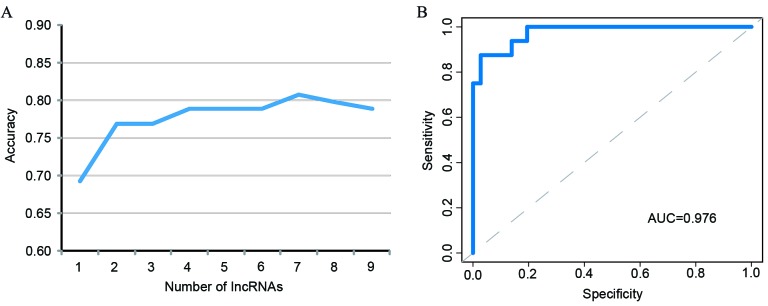
To identify potential lncRNA biomarkers in the diagnosis of MI, random forest and SVM strategies were used to determine the optimal lncRNA combination amongst the 9 most differentially expressed lncRNAs associated with ACS. The optimal number of lncRNAs in predicting the risk of MI was 7. The use of 7 lncRNAs had a 80.77% classification accuracy (Fig. 7A) and so were the most effective at distinguishing between patients with MI and those with UA. Therefore, the top 7 lncRNAs (RP11-68I3.11, AC068831.6, RP11-133L14.5, PAX8-AS1, RP11-259K15.2, RP11-203M5.8 and LINC01254) according to their random forest importance value were selected as candidate biomarkers. Subsequently, an SVM classifier was developed based on these 7 candidate lncRNA biomarkers and the accuracy of the classifier was evaluated using the LOOCV procedure. In this procedure, 51 patients were utilized as a training set and testing was performed on the remaining one patient. The classification of 52 samples in the GSE29111 cohort using 7 candidate lncRNA biomarkers achieved an accuracy of 90.38% with a sensitivity of 100% and a specificity of 68.75%. The discriminatory power measured by AUC was 0.976 (Fig. 7B).
Figure 7.
Performance evaluation of lncRNA-based classifier. (A) The accuracy of different combinations of the most differentially expressed lncRNAs. (B) The receiver operating characteristics curves in the GSE29111 dataset based on the 7 lncRNAs. lncRNA, long non-coding RNA; AUC, area under the curve.
Functional analysis of candidate lncRNA biomarkers in ACS
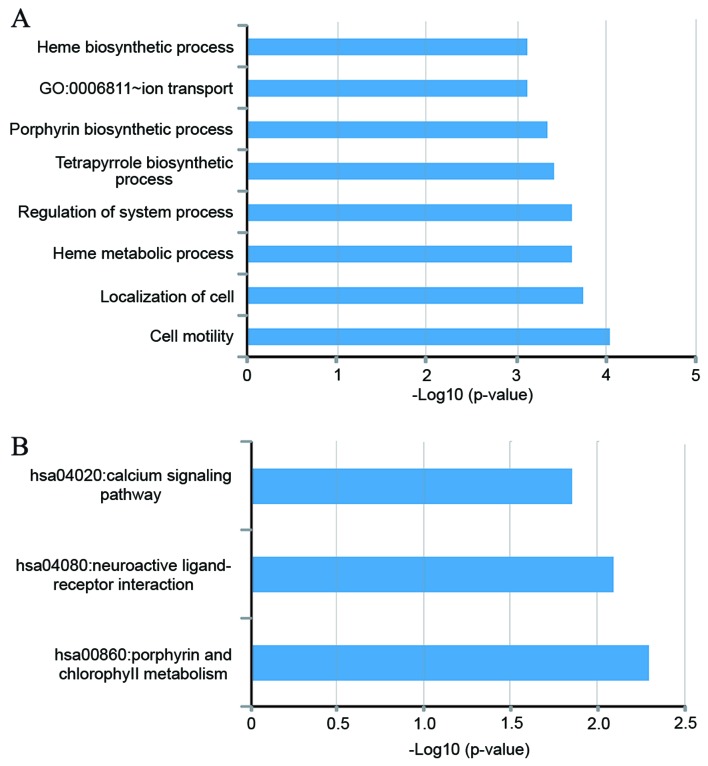
In order to investigate the functional roles of candidate lncRNA biomarkers in the progression of ACS, bioinformatics analysis was performed to predict potential biological processes or pathways involved in candidate lncRNA biomarkers in ACS. Co-expressed mRNAs were obtained with 7 candidate lncRNA biomarkers in ACS by calculating the PCC between the expression levels of lncRNAs and that of mRNAs. Functional enrichment analysis of these co-expressed mRNAs with the 7 candidate lncRNA biomarkers indicated that 8 biological processes in GO, including the heme biosynthetic process, ion transportation, porphyrin biosynthetic process, tetrapyrrole biosynthetic process, regulation of system process, heme metabolic process, localization of cells and cell motility were significantly enriched (P<0.01; Fig. 8A) and three pathways in KEGG were significantly enriched, including the porphyrin and chlorophyll metabolism, neuroactive ligand-receptor interaction and calcium signaling pathway (P<0.01; Fig. 8B), implicating that these candidate lncRNA biomarkers may be involved in ACS.
Figure 8.
Functional analysis for the 7 long non-coding RNAs deemed to be biomarkers for myocardial infarction. (A) Significantly enriched Gene Ontology terms. (B) Significantly enriched Kyoto Encyclopedia of Genes and Genomes pathways.
Discussion
Over the past few decades, the molecular mechanisms underlying ACS have been widely studied (21,22); however, they remain to be elucidated. Following advances in genomics and transcriptomics, it has been determined that lncRNAs are a major class of ncRNAs. LncRNAs are involved in a wide range of biological processes and their dysregulated expression has been implicated in various diseases (23), including cancer, and cardiovascular disease. Recently, it was determined that lncRNAs serve important functional roles in cardiac development and pathophysiology (24). However, the regulatory mechanism and functional roles of lncRNAs in the progression of ACS remain unclear. In the current study, genome-wide lncRNA expression was obtained from 52 patients with ACS by re-annotating existing microarray data and the expression pattern of lncRNAs during the progression of ACS was analyzed. The lncRNA expression profiles were initially examined in two distinct clinical entities of ACS: MI and UA. Among the 2,332 lncRNAs investigated, 18 lncRNAs were upregulated and 35 lncRNAs were downregulated in patients with MI compared with those with UA. Furthermore, the expression profiles of patients with ACS at different time points were compared and significantly altered lncRNA expression in the progression of ACS was observed. To the best of our knowledge, the present study is the first to characterize the lncRNA expression profile in the progression of ACS and compare the expression pattern of lncRNAs between MI and UA.
Due to the high morbidity and mortality rates of patients with ACS (25), early detection and treatment of ACS may substantially improve patient prognosis. Molecular biomarkers have been used to assist in the early diagnosis of ACS and identify high-risk patients. Similar to protein-coding genes and microRNAs, lncRNAs are becoming recognized as novel biomarkers in the diagnosis and prognosis of diseases, including cancer (24,26–33). The mortality rates of patients with UA are lower than in patients with MI (25), therefore the aim of the current study was to determine the potential roles of lncRNAs and identify novel lncRNA biomarkers from the most significantly differentially expressed lncRNAs in MI. To achieve this goal, the expression data of the 9 most differentially expressed lncRNAs and random forest strategy were used to identify the optimal number of lncRNAs to diagnose MI, which was determined to be 7. Following the feature selection procedure, an SVM-based classifier was developed to predict MI risk based on the expression data of the 7 lncRNAs. Using this lncRNA-focus classifier, the LOOCV method was used to estimate the prediction performance in the GSE29111 dataset. The overall classification exhibited 90.38% accuracy, 100% sensitivity and 68.75% specificity. These results suggest that these 7 lncRNAs may be potential biomarkers for MI.
Although novel lncRNAs are still being identified and the number of lncRNAs will continue to increase, only a small proportion of lncRNAs have been studied in detail and the majority of lncRNAs have not yet been functionally annotated. Previous studies have identified that lncRNAs are involved in various biological processes by interacting with other molecular partners, including mRNAs (34,35). In the present study, to infer the potential biological processes and pathways that lncRNAs are involved in, protein-coding genes were identified that are co-expressed with these 7 lncRNAs in MI. GO and KEGG function enrichment analyses were performed for these protein-coding genes (Fig. 6). Functional analysis demonstrated that lncRNAs are involved in a wide range of biological processes and pathways, including ion transportation, the heme biosynthetic process, the porphyrin biosynthetic process, the tetrapyrrole biosynthetic process, regulation of the system process, the heme metabolic process, localization of cells and cell motility, porphyrin and chlorophyll metabolism, neuroactive ligand-receptor interactions and the calcium signaling pathway. A number of these biological processes and pathways are involved in the development of MI. Heme is an important molecule for cardiovascular physiology, however increased heme accumulation may exacerbate ischemic injury (36).
In conclusion, to the best of our knowledge, the present study was the first to identify altered lncRNA expression patterns in ACS progression. Furthermore, 7 lncRNAs with diagnostic values that predict the risk of MI in patients with ACS were identified. These novel functional lncRNAs may be developed as candidate diagnostic biomarkers and therapeutic targets. However, further experimental studies are required to determine the molecular mechanism of these novel lncRNAs in the progression of ACS.
References
- 1.Oerlemans MI, Mosterd A, Dekker MS, de Vrey EA, van Mil A, Pasterkamp G, Doevendans PA, Hoes AW, Sluijter JP. Early assessment of acute coronary syndromes in the emergency department: The potential diagnostic value of circulating microRNAs. EMBO Mol Med. 2012;4:1176–1185. doi: 10.1002/emmm.201201749. [DOI] [PMC free article] [PubMed] [Google Scholar]
- 2.Falk E, Nakano M, Bentzon JF, Finn AV, Virmani R. Update on acute coronary syndromes: The pathologists' view. Eur Heart J. 2013;34:719–728. doi: 10.1093/eurheartj/ehs411. [DOI] [PubMed] [Google Scholar]
- 3.West NE. The year in cardiology 2012: Acute coronary syndromes. Eur Heart J. 2013;34:422–426. doi: 10.1093/eurheartj/ehs462. [DOI] [PubMed] [Google Scholar]
- 4.Djebali S, Davis CA, Merkel A, Dobin A, Lassmann T, Mortazavi A, Tanzer A, Lagarde J, Lin W, Schlesinger F, et al. Landscape of transcription in human cells. Nature. 2012;489:101–108. doi: 10.1038/nature11233. [DOI] [PMC free article] [PubMed] [Google Scholar]
- 5.Kung JT, Colognori D, Lee JT. Long noncoding RNAs: Past, present, and future. Genetics. 2013;193:651–669. doi: 10.1534/genetics.112.146704. [DOI] [PMC free article] [PubMed] [Google Scholar]
- 6.Rinn JL, Chang HY. Genome regulation by long noncoding RNAs. Annu Rev Biochem. 2012;81:145–166. doi: 10.1146/annurev-biochem-051410-092902. [DOI] [PMC free article] [PubMed] [Google Scholar]
- 7.Kornienko AE, Guenzl PM, Barlow DP, Pauler FM. Gene regulation by the act of long non-coding RNA transcription. BMC Biol. 2013;11:59. doi: 10.1186/1741-7007-11-59. [DOI] [PMC free article] [PubMed] [Google Scholar]
- 8.Mercer TR, Mattick JS. Structure and function of long noncoding RNAs in epigenetic regulation. Nat Struct Mol Biol. 2013;20:300–307. doi: 10.1038/nsmb.2480. [DOI] [PubMed] [Google Scholar]
- 9.Gibb EA, Vucic EA, Enfield KS, Stewart GL, Lonergan KM, Kennett JY, Becker-Santos DD, MacAulay CE, Lam S, Brown CJ, Lam WL. Human cancer long non-coding RNA transcriptomes. PLoS One. 2011;6:e25915. doi: 10.1371/journal.pone.0025915. [DOI] [PMC free article] [PubMed] [Google Scholar]
- 10.Sun J, Shi H, Wang Z, Zhang C, Liu L, Wang L, He W, Hao D, Liu S, Zhou M. Inferring novel lncRNA-disease associations based on a random walk model of a lncRNA functional similarity network. Mol Biosyst. 2014;10:2074–2081. doi: 10.1039/C3MB70608G. [DOI] [PubMed] [Google Scholar]
- 11.Zhou M, Wang X, Li J, Hao D, Wang Z, Shi H, Han L, Zhou H, Sun J. Prioritizing candidate disease-related long non-coding RNAs by walking on the heterogeneous lncRNA and disease network. Mol Biosyst. 2015;11:760–769. doi: 10.1039/C4MB00511B. [DOI] [PubMed] [Google Scholar]
- 12.Prensner JR, Chinnaiyan AM. The emergence of lncRNAs in cancer biology. Cancer Discov. 2011;1:391–407. doi: 10.1158/2159-8290.CD-11-0209. [DOI] [PMC free article] [PubMed] [Google Scholar]
- 13.Raveh E, Matouk IJ, Gilon M, Hochberg A. The H19 long non-coding RNA in cancer initiation, progression and metastasis-a proposed unifying theory. Mol Cancer. 2015;14:184. doi: 10.1186/s12943-015-0458-2. [DOI] [PMC free article] [PubMed] [Google Scholar]
- 14.Broadbent HM, Peden JF, Lorkowski S, Goel A, Ongen H, Green F, Clarke R, Collins R, Franzosi MG, Tognoni G, et al. Susceptibility to coronary artery disease and diabetes is encoded by distinct, tightly linked SNPs in the ANRIL locus on chromosome 9p. Hum Mol Genet. 2008;17:806–814. doi: 10.1093/hmg/ddm352. [DOI] [PubMed] [Google Scholar]
- 15.Yap KL, Li S, Muñoz-Cabello AM, Raguz S, Zeng L, Mujtaba S, Gil J, Walsh MJ, Zhou MM. Molecular interplay of the noncoding RNA ANRIL and methylated histone H3 lysine 27 by polycomb CBX7 in transcriptional silencing of INK4a. Mol Cell. 2010;38:662–674. doi: 10.1016/j.molcel.2010.03.021. [DOI] [PMC free article] [PubMed] [Google Scholar]
- 16.Ishii N, Ozaki K, Sato H, Mizuno H, Saito S, Takahashi A, Miyamoto Y, Ikegawa S, Kamatani N, Hori M, et al. Identification of a novel non-coding RNA, MIAT, that confers risk of myocardial infarction. J Hum Genet. 2006;51:1087–1099. doi: 10.1007/s10038-006-0070-9. [DOI] [PubMed] [Google Scholar]
- 17.Irizarry RA, Hobbs B, Collin F, Beazer-Barclay YD, Antonellis KJ, Scherf U, Speed TP. Exploration, normalization, and summaries of high density oligonucleotide array probe level data. Biostatistics. 2003;4:249–264. doi: 10.1093/biostatistics/4.2.249. [DOI] [PubMed] [Google Scholar]
- 18.Du Z, Fei T, Verhaak RG, Su Z, Zhang Y, Brown M, Chen Y, Liu XS. Integrative genomic analyses reveal clinically relevant long noncoding RNAs in human cancer. Nat Struct Mol Biol. 2013;20:908–913. doi: 10.1038/nsmb.2591. [DOI] [PMC free article] [PubMed] [Google Scholar]
- 19.Zhou M, Guo M, He D, Wang X, Cui Y, Yang H, Hao D, Sun J. A potential signature of eight long non-coding RNAs predicts survival in patients with non-small cell lung cancer. J Transl Med. 2015;13:231. doi: 10.1186/s12967-015-0556-3. [DOI] [PMC free article] [PubMed] [Google Scholar]
- 20.Huang da W, Sherman BT, Lempicki RA. Bioinformatics enrichment tools: Paths toward the comprehensive functional analysis of large gene lists. Nucleic Acids Res. 2009;37:1–13. doi: 10.1093/nar/gkn923. [DOI] [PMC free article] [PubMed] [Google Scholar]
- 21.Libby P. Mechanisms of acute coronary syndromes. N Engl J Med. 2013;369:883–884. doi: 10.1056/NEJMc1307806. [DOI] [PubMed] [Google Scholar]
- 22.Libby P. Mechanisms of acute coronary syndromes and their implications for therapy. N Engl J Med. 2013;368:2004–2013. doi: 10.1056/NEJMra1216063. [DOI] [PubMed] [Google Scholar]
- 23.Wapinski O, Chang HY. Long noncoding RNAs and human disease. Trends Cell Biol. 2011;21:354–361. doi: 10.1016/j.tcb.2011.04.001. [DOI] [PubMed] [Google Scholar]
- 24.Hu Y, Chen HY, Yu CY, Xu J, Wang JL, Qian J, Zhang X, Fang JY. A long non-coding RNA signature to improve prognosis prediction of colorectal cancer. Oncotarget. 2014;5:2230–2242. doi: 10.18632/oncotarget.1895. [DOI] [PMC free article] [PubMed] [Google Scholar]
- 25.Kolansky DM. Acute coronary syndromes: Morbidity, mortality, and pharmacoeconomic burden. Am J Manag Care. 2009;15(2 Suppl):S36–S41. [PubMed] [Google Scholar]
- 26.Crea F, Watahiki A, Quagliata L, Xue H, Pikor L, Parolia A, Wang Y, Lin D, Lam WL, Farrar WL, et al. Identification of a long non-coding RNA as a novel biomarker and potential therapeutic target for metastatic prostate cancer. Oncotarget. 2014;5:764–774. doi: 10.18632/oncotarget.1769. [DOI] [PMC free article] [PubMed] [Google Scholar]
- 27.Su X, Malouf GG, Chen Y, Zhang J, Yao H, Valero V, Weinstein JN, Spano JP, Meric-Bernstam F, Khayat D, Esteva FJ. Comprehensive analysis of long non-coding RNAs in human breast cancer clinical subtypes. Oncotarget. 2014;5:9864–9876. doi: 10.18632/oncotarget.2454. [DOI] [PMC free article] [PubMed] [Google Scholar]
- 28.Zhou M, Diao Z, Yue X, Chen Y, Zhao H, Cheng L, Sun J. Construction and analysis of dysregulated lncRNA-associated ceRNA network identified novel lncRNA biomarkers for early diagnosis of human pancreatic cancer. Oncotarget. 2016;7:56383–56394. doi: 10.18632/oncotarget.10891. [DOI] [PMC free article] [PubMed] [Google Scholar]
- 29.Zhou M, Sun Y, Sun Y, Xu W, Zhang Z, Zhao H, Zhong Z, Sun J. Comprehensive analysis of lncRNA expression profiles reveals a novel lncRNA signature to discriminate nonequivalent outcomes in patients with ovarian cancer. Oncotarget. 2016;7:32433–32448. doi: 10.18632/oncotarget.8653. [DOI] [PMC free article] [PubMed] [Google Scholar]
- 30.Zhou M, Wang X, Shi H, Cheng L, Wang Z, Zhao H, Yang L, Sun J. Characterization of long non-coding RNA-associated ceRNA network to reveal potential prognostic lncRNA biomarkers in human ovarian cancer. Oncotarget. 2016;7:12598–12611. doi: 10.18632/oncotarget.7181. [DOI] [PMC free article] [PubMed] [Google Scholar]
- 31.Zhou M, Xu W, Yue X, Zhao H, Wang Z, Shi H, Cheng L, Sun J. Relapse-related long non-coding RNA signature to improve prognosis prediction of lung adenocarcinoma. Oncotarget. 2016;7:29720–29738. doi: 10.18632/oncotarget.8825. [DOI] [PMC free article] [PubMed] [Google Scholar]
- 32.Zhou M, Zhang Z, Zhao H, Bao S, Cheng L, Sun J. An immune-related six-lncRNA signature to improve prognosis prediction of glioblastoma multiforme. Mol Neurobiol. 2017 May 19; doi: 10.1007/s12035-017-0572-9. (Epub ahead of print) [DOI] [PubMed] [Google Scholar]
- 33.Zhou M, Zhao H, Xu W, Bao S, Cheng L, Sun J. Discovery and validation of immune-associated long non-coding RNA biomarkers associated with clinically molecular subtype and prognosis in diffuse large B cell lymphoma. Mol Cancer. 2017;16:16. doi: 10.1186/s12943-017-0580-4. [DOI] [PMC free article] [PubMed] [Google Scholar]
- 34.Ma H, Hao Y, Dong X, Gong Q, Chen J, Zhang J, Tian W. Molecular mechanisms and function prediction of long noncoding RNA. ScientificWorldJournal. 2012;2012:541786. doi: 10.1100/2012/541786. [DOI] [PMC free article] [PubMed] [Google Scholar]
- 35.Cheng L, Shi H, Wang Z, Hu Y, Yang H, Zhou C, Sun J, Zhou M. IntNetLncSim: An integrative network analysis method to infer human lncRNA functional similarity. Oncotarget. 2016;7:47864–47874. doi: 10.18632/oncotarget.10012. [DOI] [PMC free article] [PubMed] [Google Scholar]
- 36.Sawicki KT, Shang M, Wu R, Chang HC, Khechaduri A, Sato T, Kamide C, Liu T, Naga Prasad SV, Ardehali H. Increased heme levels in the heart lead to exacerbated ischemic injury. J Am Heart Assoc. 2015;4:e002272. doi: 10.1161/JAHA.115.002272. [DOI] [PMC free article] [PubMed] [Google Scholar]


