Abstract
microRNA (miR) are a class of endogenous small non-coding RNA that are aberrantly expressed and are critical in tumorigenesis. Amongst them, miR-152 was reported to be dysregulated in epithelial ovarian cancer (EOC). However, the function and mechanism of miR-152 is not well understood. In the present study, total RNA was extracted from 58 ovarian epithelial carcinoma tissue samples and adjacent non-tumor tissues and measured by reverse transcription-quantitative polymerase chain reaction. The observations of the present study revealed that the expression of miR-152 was significantly downregulated in EOC specimens, as well as three ovarian cancer (OC) cell lines. The higher expression of miR-152 indicated a better overall survival rate in patients with EOC. Following miR-152 mimic transfection into SKOV3 or OVCAR3 cells, MTT assay revealed that cell proliferation was significantly inhibited (P<0.05). Although miR-152 had no effect on SKOV3 cell migration, miR-152 inhibited OVCAR3 cell migration. Bioinformatics analyses and luciferase reporter assays demonstrated that miR-152 targeted the 3′-untranslated region (3′-UTR) of the forkhead box protein 1 (FOXP1). Furthermore, introducing FOXP1 without the 3′-UTR abrogated the effect of miR-152-induced proliferation and migration alteration, respectively. In addition, the expression level of FOXP1 was higher in the EOC tumor tissues and cell lines. Additionally, the level of miR-152 and FOXP1 was inversely correlated in grade 3 and 4 ovarian tumor tissues. Altogether, these observations indicated that miR-152 may be involved in the inhibition of OC through repression of FOXP1. In the future, miR-152 and FOXP1 may act as novel biomarkers for early detection of EOC or therapeutic targets.
Keywords: microRNA-152, ovarian cancer, proliferation, invasion, forkhead box protein 1
Introduction
Ovarian cancer (OC) is one of the most common types of cancer in women and the most frequent cause of tumor-related mortality in women worldwide (1). Amongst the types of OC, epithelial ovarian cancer (EOC) accounts for 80–90% of all cases (2). Although recent advances have been made in clinical and experimental oncology, the 5-year survival rate for patients with advanced-stage EOC is only 35% (3). The main cause of this may be due to the biomarkers and therapies for EOC being deficient, and early detection remaining a challenge (4). Thus, exploring the potential mechanisms that underly the development and progression of EOC may be useful in finding novel biomarkers and therapeutic strategies for the treatment of EOC.
MicroRNA (miR) are a class of non-coding RNA, which are highly conserved and are comprised of 18–25 nucleotides (5). By binding to the 3′-untranslated region (3′-UTR) of the target mRNA, miR may induce translational repression or target mRNA degradation (5,6). Research has indicated that these human miR are aberrantly expressed in several types of cancer (7,8) and are implicated in the regulation of various essential processes, including cell growth, apoptosis and differentiation (9). Depending on the expression pattern and function, miR may be classified as oncogenes or tumor suppressors in the regulation of EOC initiation and progression (10).
miR-152 is a member of the miR-148/152 family and is aberrantly expressed in various types of cancer (11). According to a growing body of evidence, miR-152 may act as a tumor suppressor gene by regulating target genes in different cancer types, including targeting phosphoinositide 3-kinase regulatory subunit 3 in colorectal cancer (12). By targeting KIT in CD133+ liver cancer stem cells, miR-152 inhibits cell proliferation and colony formation (13). Furthermore, by targeting Kruppel-like factor 4, miR-152 inhibits cell proliferation, migration and invasion and induces apoptosis in glioblastoma in vitro and in vivo (14). A study by Dou et al (15) reported that circulating miR-152 may develop into a non-invasive and rapid diagnostic tool in non-small-cell lung carcinomas. However, in EOC, the function of miR-152 requires further investigation.
Forkhead box protein 1 (FOXP1) belongs to the subfamily P of the forkhead box transcription factor family. FOXP1 expression has been reported to be closely associated with the degree of malignancy of EOC and may be a reliable index for the prognosis of OC (16). Function and bioinformatics analyses have revealed that FOXP1 was negatively related with miR-152 (17). Therefore, the present study aimed to reveal the mechanism between miR-152 and FOXP1.
Materials and methods
Cell lines and cell culture
The human ovarian epithelial cancer cell lines SKOV3, OVCAR3 and A2780 were all purchased from the American Type Culture Collection (ATCC; Manassas, VA, USA) and cultured in Dulbecco's modified Eagle's medium (DMEM)/F12 Ham's supplemented with 10% fetal bovine serum (FBS; Invitrogen; Thermo Fisher Scientific, Inc., Waltham, MA, USA) supplemented with 1% penicillin-streptomycin (HyClone; GE Healthcare, Logan, UT, USA). Normal ovarian epithelial cells were obtained from Yangzhou Hongyue Biotechnology Co., Ltd. (Beijing, China), and cultured using a relative kit (Human Ovarian PrimaCell: Normal Ovarian Epithelial Cells, 3–0393; Yangzhou Hongyue Biotechnology Co., Ltd.), according to the Institutional Review Board and Health Insurance Portability and Accountability (Beijing, China). The cells were cultured at 37°C in a humidified atmosphere with 5% CO2.
Tissue samples
A total of 58 paired ovarian epithelial carcinoma tissue samples and adjacent non-tumor tissues (located >5 cm away from the tumors) were obtained from patients (age, 30–60 years), who underwent primary surgical resection at The First Affiliated Hospital of Guangxi Medical University (Nanning, China) between June 2010 and December 2013. EOC histological classification was assessed according to the World Health Organization Histological Classification criteria (18). The details are demonstrated in Table I. Fresh samples were snap-frozen in liquid nitrogen following surgery and stored at −80°C immediately. The present study was approved by the Ethics Committee of The First Affiliated Hospital of Guangxi Medical University and patient consent was obtained from each patient prior to study initiation.
Table I.
Clinical and pathological variables in 58 patients with ovarian carcinoma.
| ΜicroRNA-152 expression, n | ||||
|---|---|---|---|---|
| Variable | n | Low | High | P-value |
| Age, years | 0.724 | |||
| <60 | 34 | 20 | 14 | |
| ≥60 | 24 | 13 | 11 | |
| Grade | 0.014 | |||
| I–II | 36 | 16 | 20 | |
| III–IV | 22 | 17 | 5 | |
| Response to treatment | 0.094 | |||
| Complete response | 35 | 23 | 12 | |
| Progressive disease | 23 | 10 | 13 | |
Plasmid transfection
miR-152 mimics and a negative control (ctrl) RNA duplex were designed and chemically synthesized by Shanghai GenePharma Co., Ltd. (Shanghai, China). Cells (2×10⁵) were seeded into 6-well plates 24 h prior to transfection, and a final concentration of 50 nM miR mimics and ctrl. FOXP1 or transfected with pcDNA3.1(+)-FOXP1 that did not contain a 3′-UTR were transfected into the cells using Lipofectamine 2000 reagent (Invitrogen; Thermo Fisher Scientific, Inc.), according to the manufacturer's instructions. The details were as previously described (19).
RNA isolation and reverse transcription-quantitative polymerase chain reaction (RT-qPCR)
Total RNA was isolated from frozen tissues and cultured cells with TRIzol (Invitrogen; Thermo Fisher Scientific, Inc.), according to the manufacturer's instructions. miR was isolated with an mirVana miRNA isolation kit (Ambion; Thermo Fisher Scientific, Inc.). RNA was purified using phenol-chloroform extraction and ethanol precipitation. DNase was used to degrade the DNA (TransGen Biotech Co., Ltd., Beijing, China). After dissolving in RNase-free water, the RNA concentration was assessed using a nanophotometer UV/VIS spectrophotometer (Implen GmbH, München, Germany). Subsequently, the cDNA was synthesized using a PrimeScript 1st strand cDNA Synthesis kit (Takara Biotechnology Co., Ltd., Dalian, China) and then was subjected to qPCR on a 7500 real-time PCR system (Applied Biosystems; Thermo Fisher Scientific, Inc.) using the SYBR-Green Mixture kit (Roche Diagnostics, Basel, Switzerland). The expression of miR-152 was measured using TaqMan miR assay primers (Applied Biosystems; Thermo Fisher Scientific, Inc.). GAPDH or U6 was used as an internal control, and relative expression levels were determined using the 2−ΔΔCq method, and the details were as described (19). The PCR amplification conditions were: 95°C for 5 min, 35 cycles of 95°C for 15 sec, 60°C for 20 sec and 72°C for 30 sec, then 4°C for 10 min. The primers used were as follows: GAPDH forward, 5′-GAGAAGTATGACAACAGCCTC-3′ and reverse, 5′-ATGGACTGTGGTCATGAGTC-3′; FOXP1 forward, 5′-GAAACCACAGGCAACAATCA-3′ and reverse, 5′-GCTGTACTTCTATCGTCCAG-3′; miR-152 forward, 5′-TCAGTGCATGACAGAACTTGGAA-3′ and reverse, 5′-GCTGTCAACGATACGCTACGT-3′; U6 forward, 5′-CTCGCTTCGGCAGCACA-3′ and reverse, 5′-AACGCTTCACGAATTTGCGT-3′.
Western blotting
Cellular extracts were lysed in radioimmunoprecipitation assay buffer (Sigma-Aldrich; Merck KGaA, Darmstadt, Germany) with 1% protease inhibitor cocktail (Roche Diagnostics). The protein was quantified using a BCA kit (Thermo Fisher Scientific, Inc.). Subsequently, equal amounts of protein (30 µg) were separated on 12 or 8% SDS-PAGE and transferred onto a polyvinylidene difluoride membrane (EMD Millipore, Billerica, MA, USA). Following blocking with 5% non-fat dried milk for 1 h at 4°C, the membrane was incubated with primary antibodies at 4°C overnight. The antibodies used were as follows: Anti-FOXP1 antibody (1:1,000, cat. no. ab16645) and anti-GAPDH antibody (1:1,000, cat. no. ab181602) (both from Abcam, Cambridge, MA, USA). Following washing with Tris-buffered saline Tween-20 five times, the membranes were incubated with horseradish peroxidase-linked secondary antibody goat anti-mouse IgG-HRP (sc-2005, 1:3,000) and anti-rabbit IgG-HRP (sc-2004, 1:3,000) (both Santa Cruz Biotechnology, Inc., Dallas, TX, USA) at room temperature for 1 h and visualized using an enhanced chemiluminescence system (western blotting detection system; Thermo Fisher Scientific, Inc.), according to the manufacturer's instructions.
Bioinformatics analysis
TargetScan 6.2 (www.targetscan.org) was used to screen the potential target. Briefly, ‘miR-152’ was entered into the ‘Enter a microRNA name’ field and submitted. FOXP1 was identified as one of the miR-152 candidate targets.
Luciferase-reporter activity assay
The 3′-UTRs of the FOXP1 genes with two putative miR-152 binding sites were amplified by PCR from cDNA according to the aforementioned protocol and inserted into the pmirGLO vector (Promega, Madison, WI, USA). miR-152-modified EOC cells (1×10⁵/well) were seeded in 24-well plates and transfected with 1 µg pmirGLO, pmirGLO-3′-UTR-wild-type (WT) or pmirGLO-3′-UTR-mutant (MUT) using Lipofectamine 2000 (Invitrogen; Thermo Fisher Scientific, Inc.). At 24 h after transfection, luciferase activity was measured using a dual-luciferase reporter assay system (Promega), according to the manufacturer's instructions. For each construct, the firefly luciferase activity was compared to that of the pmirGLO, and the Renilla luciferase activity was used for normalization.
MTT assay
The MTT assay was performed in 96-well plates (5,000 cells/well) with cells transfected with relative miR or plasmid. Twenty-four hours after transfection, 20 µl MTT (5 mg/ml) was added to the appropriate wells, and the cells were incubated for a further 48 h at 37°C. Subsequently, 150 µl dimethyl sulfoxide was used to stop the reaction, and the absorbance of each well was measured at a wavelength of 570 nm on a microplate reader (Sunrise; Tecan, Männedorf, Switzerland) for three independent experiments.
Transwell assay
The Transwell assay was performed using 24-well plates (8.0-µm pore size; Corning, Inc., Corning, NY, USA). A total of 1×10⁵ SKOV3 or OVCAR3 cells transfected with relative miRNA or plasmid per well were plated into the upper chamber without DMEM. Furthermore, DMEM supplemented with 10% FBS was added to the lower chamber and incubated for 24 h at 37°C with 5% CO2. Cells remaining on the upper surface of the membrane were removed with a cotton-tipped swab, while cells in the lower chamber were fixed in 75% ethanol for 30 min at room temperature and stained with 0.5% crystal violet for 5 min at room temperature before being washed with PBS 3 times (5 min/wash). Additionally, images were captured and cell numbers were counted using an inverted microscope at ×20 magnification (Olympus, Tokyo, Japan). Three independent experiments were performed. The data were presented as fold of change compared with miR-control group.
Statistical analysis
Data were presented as the mean ± standard deviation for at least three independent experiments. Differences between two groups were analyzed using the Student's t-test. Non-parametric tests were performed to measure the association between miR-152 expression and clinicopathological features. Furthermore, correlation coefficients of miR-152 and FOXP1 were evaluated using Pearson correlation coefficient, and a survival analysis was performed using the Kaplan-Meier method. P<0.05 was considered to indicate a statistically significant difference.
Results
Higher expression of miR-152 indicates an improved prognosis in EOC tissues
In the EOC tissue samples, the expression of miR-152 was quantitated in 58 ovarian epithelial carcinoma tissue samples and adjacent non-tumor tissues by RT-qPCR. The results revealed a significantly reduced expression level of miR-152 in EOC tissues compared with the normal ovarian tissues (P<0.05; Fig. 1A). Additionally, a significantly decreased expression of miR-152 was observed in three OC cells lines, SKOV3 (P<0.01), OVCAR3 (P<0.05) and A2780 (P<0.05), compared with the normal ovarian tissue cells (Fig. 1B). Finally, a Kaplan-Meier estimator was drawn to determine whether miR-152 expression was correlated with the overall 5-year survival rates. As demonstrated in Fig. 1C, the log-rank test P-values obtained were 0.0447, indicating that there was a higher survival rate in patients with higher expression levels of miR-152.
Figure 1.
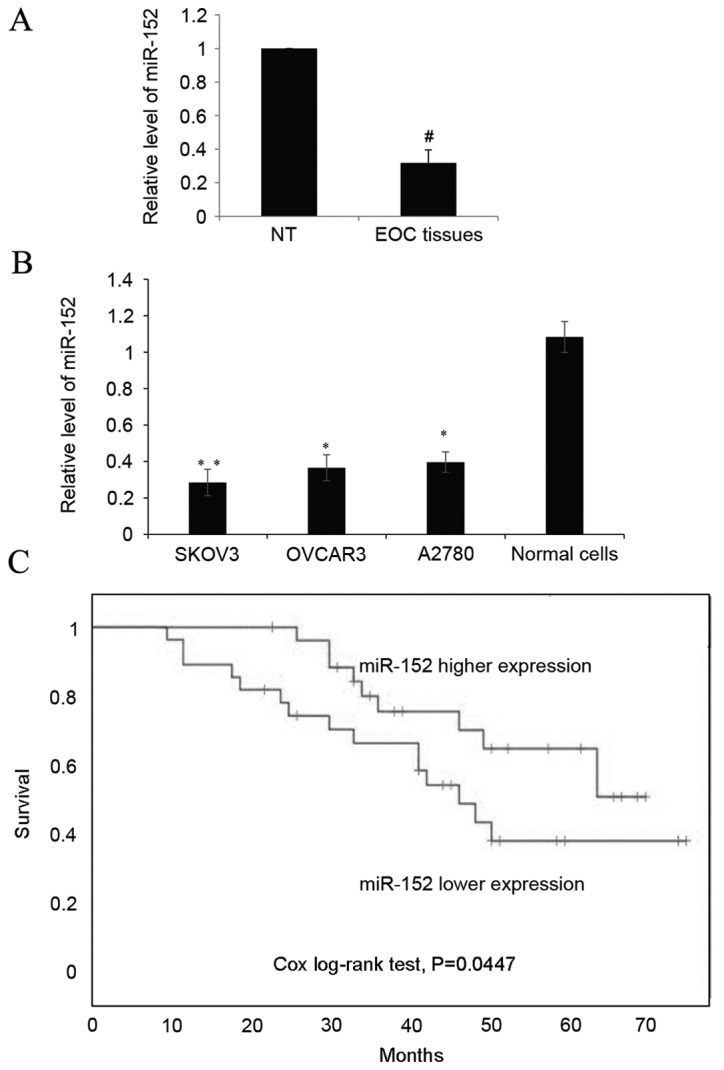
Higher expression of miR-152 indicates an improved prognosis in EOC tissues. (A) The expression of miR-152 was determined by reverse transcription-quantitative polymerase chain reaction in paired EOC tissue and adjacent NT tissues. Each sample was analyzed in triplicate. Data are presented as the mean + SD of the mean as determined by Student's t-test. (B) The expression of miR-152 was measured in three OC cell lines, SKOV3, OVCAR3 and A2780, and normal ovarian tissue cells. miR-152 levels are relative to normal ovarian epithelium tissue cells, and the experiment was repeated three times. Data are presented as the mean ± SD. (C) Kaplan-Meier estimator was drawn according to the miR-152 expression to analyze the overall survival rate, and the Cox log-rank test was used for comparison. The cut-off value was identified by receiver operating characteristic curve analysis and according to the cut-off value the object was divided into two groups. #P<0.05 vs. NT tissue; *P<0.05 and **P<0.01 vs. normal cells. miR, microRNA; NT, non-tumor; EOC, epithelial ovarian cancer; OC, ovarian cancer; SD, standard deviation.
miR-152 suppresses EOC cell proliferation and migration in vitro
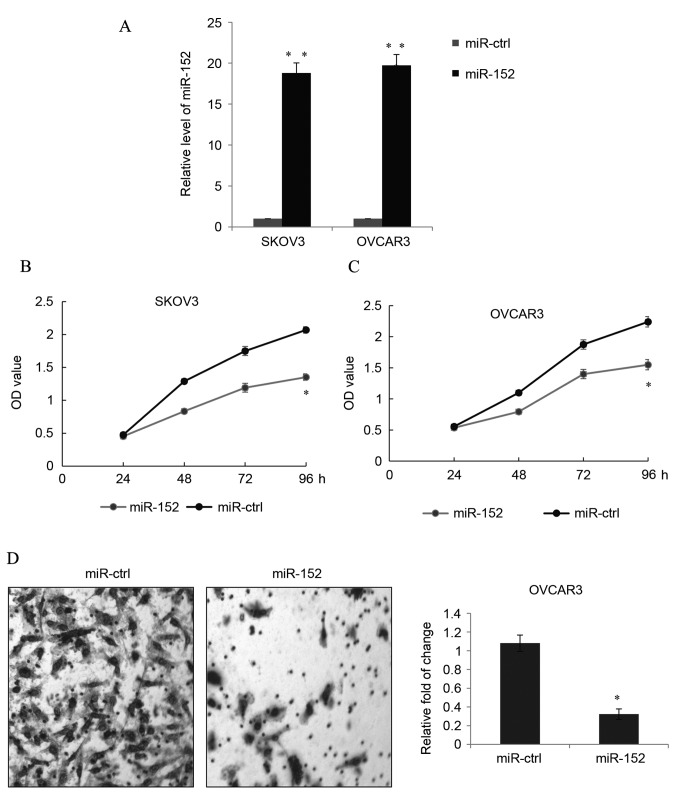
Following transfection with miR-152 mimics and miR-ctrl in SKOV3 or OVCAR3 cells, the transfection efficiency was tested by detecting the expression of miR-152, as demonstrated in Fig. 2A. Transfection with miR-152 mimics significantly increased the miR-152 expression level in SLOV3 and OVCAR3 cells compared with the levels in cells transfected with miR-ctrl (P<0.01). This indicated that the transfection was effective, allowing for subsequent experiments to be conducted.
Figure 2.
miR-152 suppresses EOC cell proliferation and migration in vitro. (A) miR-152 was overexpressed in EOC cell lines, SKOV3 and OVCAR3, by transfection with miR-152 mimic, or cells were transfected with miR-ctrl. The transfection efficiency was confirmed by reverse transcription-quantitative polymerase chain reaction. Data are presented as the mean + SD. MTT proliferation assay was used to detect the growth ability of (B) SKOV3 and (C) OVCAR3 cells transfected with miR-152 mimic or miR-ctrl. Data are presented as the mean ± SD. (D) Transwell assay was used to detect the migration of OVCAR3 cells transfected with miR-152 mimic or miR-ctrl. In total, 48 h after transfection, the cells were allowed to invade toward the lower chamber and the relative photos were captured under a microscope at ×20 magnification (stain, crystal violet). Data are presented as the mean + SD. Each result represents an average of triplicates. *P<0.05 and **P<0.01 vs. miR-ctrl. miR, microRNA; EOC, epithelial ovarian cancer; ctrl, control; SD, standard deviation; OD, optical density.
MTT growth assays were performed to measure the proliferation of transfected SKOV3 cells. Overexpression of miR-152 significantly reduced the proliferation of SKOV3 cells compared to the miR-ctrl group 96 h post-transfection (P<0.05; Fig. 2B). Similarly, in OVCAR3 cells, the proliferation was also significantly inhibited by transfection with the miR-152 mimic compared with cells transfected with miR-ctrl at 96 h (P<0.05; Fig. 2C).
A Transwell assay was used to measure EOC migration in vitro. In OVCAR3 cells, ectopic miR-152 expression significantly decreased cell migration compared with cells transfected with miR-ctrl (P<0.05; Fig. 2D). However, in the SKOV3 cells with miR-152 overexpression, no significant difference was observed between the miR-152 transfection and miR-ctrl groups (data not shown), which was similar to what was reported in a study by Zhou et al (19).
miR-152 directly targets FOXP1
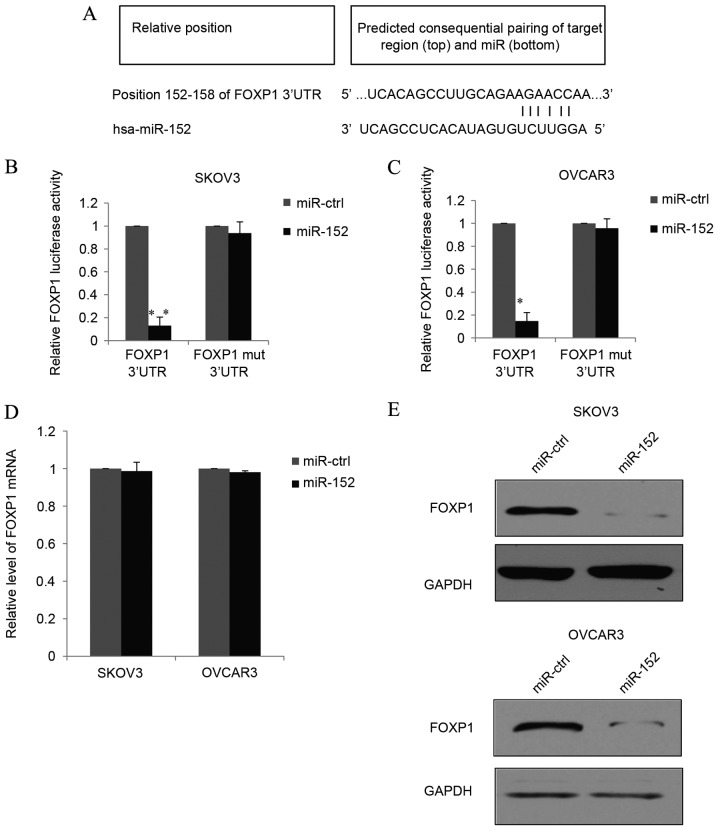
TargetScan analysis predicted one target region for miR-152 in the 3′-UTR of the FOXP1 gene (Fig. 3A), suggesting that miR-152 may directly target FOXP1. Furthermore, luciferase reporter assays were performed, where the full-length WT 3′-UTR of FOXP1 was cloned into the pmirGLO vector to generate pmirGLO-FOXP1 constructs. Co-transfection of pmirGLO-FOXP1 and miR-152 into SKOV3 cells resulted in a significantly lower luciferase activity than the pmirGLO-FOXP1 and miR-ctrl vector group (P<0.01; Fig. 3B). In addition, the target sequences of the FOXP1 3′UTR were point-mutated and ligated to the 3′-end of luciferase RNA. The MUT constructs were then co-transfected with miR-152 or miR-ctrl into SKOV3 cells. As demonstrated in Fig. 3B, the MUT miR-152 binding sites from the 152–158 3′-UTR of FOXP1 eliminated the effect of miR-152 on the luciferase activity, and there was no significant difference between the effects of the target-B mutation and control groups. Similar results were observed in OVCAR3 cells (Fig. 3C). These results indicated that the 152–158 3′-UTR of FOXP1 is a direct target of miR-152. In order to further demonstrate the function of miR-152 as an endogenous regulator of FOXP1 in EOC, SKOV3 or OVCAR3 cells transfected with miR-152 or miR-ctrl were used to measure FOXP1 mRNA and protein expression levels. The data demonstrated that although overexpression of miR-152 did not alter the mRNA expression level of FOXP1 (Fig. 3D), miR-152 overexpression markedly decreased FOXP1 protein expression levels (Fig. 3E). Additionally, these results indicated that miR-152 could suppress FOXP1 protein translation through post-transcription in EOC.
Figure 3.
miR-152 directly targets FOXP1. (A) The predicted miR152 binding sites in the FOXP1 3′-UTR were identified using bioinformatics analyses. The pmirGLO-FOXP1 reporter gene with putative miR-52 binding sites was cloned into the pmirGLO-control vector. (B) SKOV3 and (C) OVCAR3 cells were transfected with pmirGLO-FOXP1 or pmirGLO-FOXP1-mut together with a miR-152 mimic or miR-ctrl. The relative luciferase activities are demonstrated. (D) mRNA and (E) protein expression levels of FOXP1 were quantified using TaqMan quantitative polymerase chain reaction and western blotting, respectively, in SKOV3 or OVCAR3 cells transfected with the miR-152 mimic or miR-ctrl. GAPDH was used as an internal control. Data are presented as the mean + standard deviation of triplicate experiments. *P<0.05 and **P<0.01 vs. miR-ctrl with FOXP1 3′UTR. FOXP1, forkhead box protein 1; UTR, untranslated region; miR, microRNA; ctrl, control; mut, mutant.
Inhibition of EOC malignant phenotype by miR-152 is through the suppression of FOXP1
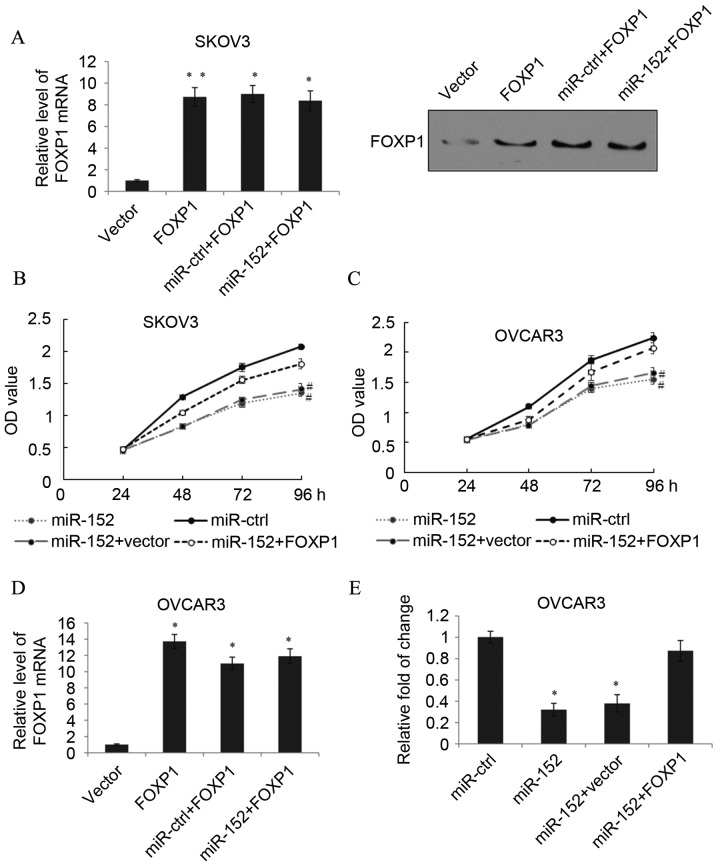
To determine whether the function of miR-152 was mediated by FOXP1, SKOV3 cells were transfected with pcDNA3.1(+)-FOXP1 that did not contain a 3′-UTR. As detected by RT-qPCR and western blotting, transfection with FOXP1 significantly increased the FOXP1 expression level compared with the vector (P<0.01). When miR-152 was also transfected into these cells, the expression of FOXP1 was not downregulated and remained significantly higher than the expression level in the vector group (P<0.05; Fig. 4A). Subsequently, an MTT assay in SKOV3 cells transfected with miR-ctrl, miR-152, miR-152+vector or miR-152+FOXP1 was performed. As expected, the ectopic expression of FOXP1 significantly rescued cell proliferation inhibition caused by miR-152 expression at 96 h (P<0.05; Fig. 4B). Similarly, in the OVCAR3 cells, the function of miR-152 expression could also be eliminated by FOXP1 overexpression (Fig. 4C). In the OVCAR3 cells, transfection with FOXP1 without a 3′-UTR also significantly increased the FOXP1 expression level compared with the vector group (P<0.05), and when miR-152 was transfected into these cells, the expression of FOXP1 was not significantly downregulated (Fig. 4D). We further examined the possibility that miR-152 may somehow inhibit OVCAR3 cell migration through the repression of FOXP1, and a Transwell assay was performed. As demonstrated in Fig. 4E, transfection with FOXP1 reduced the effect of miR-152 on EOC cell migration. These results indicated that miR-152 regulated EOC proliferation and migration through the miR-152 binding sites on the 3′-UTR of FOXP1.
Figure 4.
Inhibition of EOC malignant phenotype by miR-152 is by suppression of FOXP1. (A) The mRNA and protein expression level of FOXP1 in SKOV3 cells was measured by transfection with vector, FOXP1, miR-ctrl+FOXP1 or miR-152+FOXP1. Data are presented as the mean + SD. An MTT assay was performed in (B) SKOV3 and (C) OVCAR3 cells transfected with miR-ctrl, miR-152, miR-152+vector or miR-152+FOXP1. Data are presented as the mean ± SD. (D) The mRNA level of FOXP1 in OVCAR3 cells was measured following transfection with vector, FOXP1, miR-ctrl+FOXP1 or miR-152+FOXP1. (E) A Transwell assay was performed in OVCAR3 cells transfected with miR-ctrl, miR-152, miR-152+vector or miR-152+FOXP1. Data are presented as the mean + SD. *P<0.05 and **P<0.01 vs. vector; #P<0.05 vs. miR-152+FOXP1 at 96 h. EOC, epithelial ovarian cancer; miR, microRNA; FOXP1, forkhead box protein 1; ctrl, control; SD, standard deviation; OD, optical density.
Increased FOXP1 is detected and inversely correlated with miR-152 in EOC tissues and cell lines
Significantly higher expression levels of FOXP1 were detected in EOC tissues than in adjacent non-tumor tissues from the same EOC patient (P<0.05; Fig. 5A). With regard to EOC cell lines, the expression of FOXP1 was also significantly higher than the normal ovarian tissues cells (P<0.05; Fig. 5B). In order to determine the correlation between miR-152 and FOXP1, correlation analysis using the EOC grade 3 and 4 samples was performed, and a significant inverse correlation between miR-152 and FOXP1 was detected (Fig. 5C; P<0.05). The above data indicated the presence of a causal link between miR-152 and FOXP1 in EOC tissues and cell lines.
Figure 5.
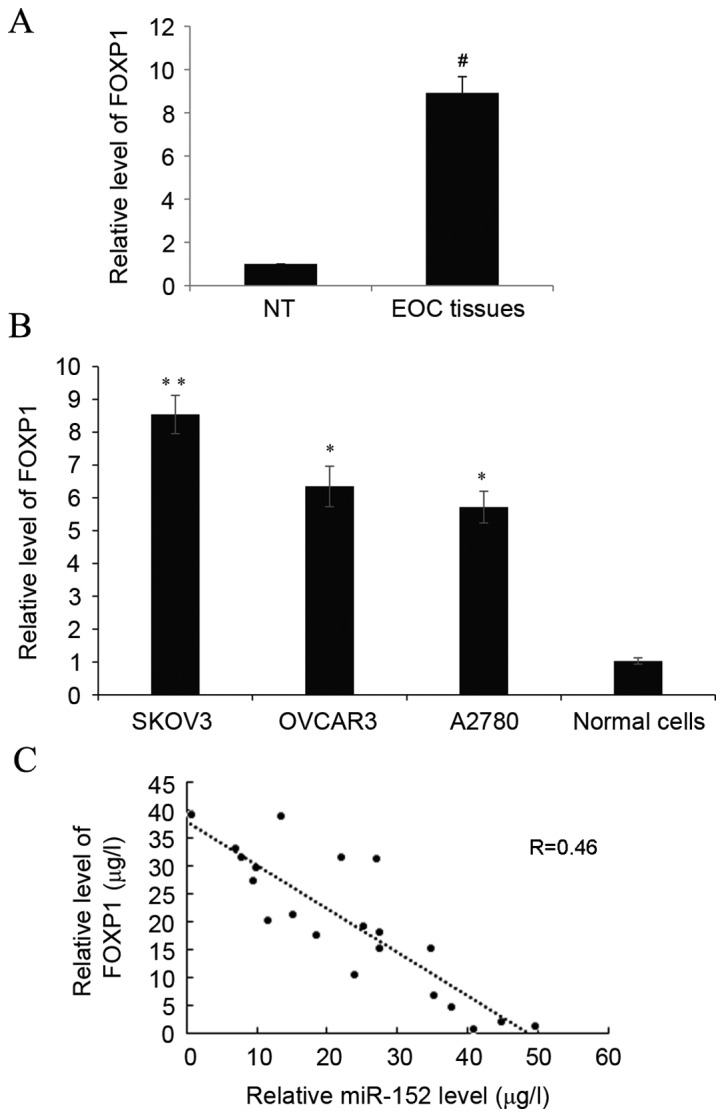
Increased FOXP1 is detected and is inversely correlated with miR-152 in EOC tissues and cell lines. (A) The expression of FOXP1 was determined by reverse transcription-quantitative polymerase chain reaction in paired EOC and adjacent NT tissues. Data are presented as the mean + SD. (B) The expression of FOXP1 was measured in three ovarian cancer cell lines, SKOV3, OVCAR3 and A2780, and normal ovarian tissues cells. Data are presented relative to normal ovarian epithelium tissues cells. Data are presented as the mean ± SD of triplicate experiments. (C) Correlation of miR-152 and FOXP1 expression in grade 3 and 4 ovarian cancer samples. #P<0.05 vs. NT; *P<0.05 and **P<0.01 vs. normal cells. FOXP1, forkhead box protein 1; miR, microRNA; EOC, epithelial ovarian cancer; NT, non-tumor; SD, standard deviation.
Discussion
Various research has specifically implicated the function of miR in OC. For example, a study by Zheng et al (20) reported that miR-101 inhibits OC cell proliferation and invasion by downregulation of suppressor of cytokine signaling-2 expression. A study by Wuerkenbieke et al (21) indicated that miR-150 downregulation could contribute to pertuzumab resistance in OC through the phosphoinositide 3-kinase-protein kinase B pathway. Furthermore, a study by Mitamura et al (22) described that miR-31 was found to bind to the 3′-UTR of mRNA of MET, and the decrease in MET was correlated with a higher sensitivity to Paclitaxel. Finally, as Zhou et al (19) reported in 2012, the expression of miR-152 was downregulated in OC tissues compared with normal ovarian tissues, and an MTT cell proliferation assay demonstrated that cell proliferation was significantly inhibited by miR-152 mimic transfection. The present study further demonstrated the function of miR-152 in OC migration.
The data of the present study revealed that the level of miR-152 in EOC tissues was inversely correlated with the levels of FOXP1 in EOC patients. Overexpression of miR-152 in different EOC cell lines could suppress cell proliferation and migration. Although miR-152 did not affect FOXP1 mRNA expression levels, it was capable of altering the protein level. A luciferase reporter assay further confirmed the binding of miR-152 on FOXP1 3′-UTR. In addition, miR-152-mediated changes of FOXP1 appeared to be the result of miR-152 triggering cell proliferation and migration. FOXP1 expression is closely related to the degree of malignancy of EOC (16). Furthermore, a study by Choi et al (23) stated that FOXP1 promoted EOC cancer stem cell-like characteristics, since knockdown of FOXP1 in different OC cells could decrease spheroid formation and repress epithelial to mesenchymal transition-related genes, which resulted in the inhibition of cell migration.
As previously mentioned, higher levels of FOXP1 were demonstrated in EOC tissues and cell lines. Furthermore, there was a strong inverse correlation between miR-152 and FOXP1 in the EOC grade 3 and 4 samples in the present study. The data from the present study indicated the presence of a causal link between miR-152 and FOXP1 in EOC tissues and cell lines, which further indicated contrasting roles of miR-152 and FOXP1 in EOC progression. As demonstrated in the present study, higher expression of miR-152 was associated with an improved overall survival, and miR-152 was indicated to be capable of inhibiting OVCAR3 cell migration, as well as SKOV3 and OVCAR3 cell proliferation.
In conclusion, miR-152 may be involved in EOC by targeting FOXP1, and may contribute to the inhibition of cell proliferation and migration. In the future, more evidence should be provided to confirm miR-152 as a novel biomarker for early detection of EOC and to investigate the use of FOXP1 as a therapeutic target of OC.
References
- 1.Jemal A, Bray F, Center MM, Ferlay J, Ward E, Forman D. Global cancer statistics. CA Cancer J Clin. 2011;61:69–90. doi: 10.3322/caac.20107. [DOI] [PubMed] [Google Scholar]
- 2.Chan JK, Cheung MK, Husain A, Teng NN, West D, Whittemore AS, Berek JS, Osann K. Patterns and progress in ovarian cancer over 14 years. Obstet Gynecol. 2006;108:521–528. doi: 10.1097/01.AOG.0000231680.58221.a7. [DOI] [PubMed] [Google Scholar]
- 3.Siegel R, Naishadham D, Jemal A. Cancer statistics, 2012. CA Cancer J Clin. 2012;62:10–29. doi: 10.3322/caac.20138. [DOI] [PubMed] [Google Scholar]
- 4.Gloss BS, Samimi G. Epigenetic biomarkers in epithelial ovarian cancer. Cancer Lett. 2014;342:257–263. doi: 10.1016/j.canlet.2011.12.036. [DOI] [PubMed] [Google Scholar]
- 5.Lewis BP, Burge CB, Bartel DP. Conserved seed pairing, often flanked by adenosines, indicates that thousands of human genes are microRNA targets. Cell. 2005;120:15–20. doi: 10.1016/j.cell.2004.12.035. [DOI] [PubMed] [Google Scholar]
- 6.Shukla GC, Singh J, Barik S. MicroRNAs: Processing, maturation, target recognition and regulatory functions. Mol Cell Pharmacol. 2011;3:83–92. [PMC free article] [PubMed] [Google Scholar]
- 7.Calin GA, Sevignani C, Dumitru CD, Hyslop T, Noch E, Yendamuri S, Shimizu M, Rattan S, Bullrich F, Negrini M, et al. Human microRNA genes are frequently located at fragile sites and genomic regions involved in cancers; Proc Natl Acad Sci USA; 2004; pp. 2999–3004. [DOI] [PMC free article] [PubMed] [Google Scholar]
- 8.Esquela-Kerscher A, Slack FJ. Oncomirs-microRNAs with a role in cancer. Nat Rev Cancer. 2006;6:259–269. doi: 10.1038/nrc1840. [DOI] [PubMed] [Google Scholar]
- 9.Alvarez-Garcia I, Miska EA. MicroRNA functions in animal development and human disease. Development. 2005;132:4653–4662. doi: 10.1242/dev.02073. [DOI] [PubMed] [Google Scholar]
- 10.Iorio MV, Visone R, Di Leva G, Donati V, Petrocca F, Casalini P, Taccioli C, Volinia S, Liu CG, Alder H, et al. MicroRNA signatures in human ovarian cancer. Cancer Res. 2007;67:8699–8707. doi: 10.1158/0008-5472.CAN-07-1936. [DOI] [PubMed] [Google Scholar]
- 11.Liu X, Li J, Qin F, Dai S. miR-152 as a tumor suppressor microRNA: Target recognition and regulation in cancer. Oncol Lett. 2016;11:3911–3916. doi: 10.3892/ol.2016.4509. [DOI] [PMC free article] [PubMed] [Google Scholar]
- 12.Li B, Xie Z, Li B. miR-152 functions as a tumor suppressor in colorectal cancer by targeting PIK3R3. Tumour Biol. 2016;37:10075–10084. doi: 10.1007/s13277-016-4888-2. [DOI] [PubMed] [Google Scholar]
- 13.Huang H, Hu M, Li P, Lu C, Li M. Mir-152 inhibits cell proliferation and colony formation of CD133(+) liver cancer stem cells by targeting KIT. Tumour Biol. 2015;36:921–928. doi: 10.1007/s13277-014-2719-x. [DOI] [PubMed] [Google Scholar]
- 14.Ma J, Yao Y, Wang P, Liu Y, Zhao L, Li Z, Li Z, Xue Y. miR-152 functions as a tumor suppressor in glioblastoma stem cells by targeting Kruppel-like factor 4. Cancer Lett. 2014;355:85–95. doi: 10.1016/j.canlet.2014.09.012. [DOI] [PubMed] [Google Scholar]
- 15.Dou H, Wang Y, Su G, Zhao S. Decreased plasma let-7c and miR-152 as noninvasive biomarker for non-small-cell lung cancer. Int J Clin Exp Med. 2015;8:9291–9298. [PMC free article] [PubMed] [Google Scholar]
- 16.Hu Z, Zhu L, Gao J, Cai M, Tan M, Liu J, Lin B. Expression of FOXP1 in epithelial ovarian cancer (EOC) and its correlation with chemotherapy resistance and prognosis. Tumour Biol. 2015;36:7269–7275. doi: 10.1007/s13277-015-3383-5. [DOI] [PubMed] [Google Scholar]
- 17.Mehrian-Shai R, Yalon M, Moshe I, Barshack I, Nass D, Jacob J, Dor C, Reichardt JK, Constantini S, Toren A. Identification of genomic aberrations in hemangioblastoma by droplet digital PCR and SNP microarray highlights novel candidate genes and pathways for pathogenesis. BMC Genomics. 2016;17:56. doi: 10.1186/s12864-016-2370-6. [DOI] [PMC free article] [PubMed] [Google Scholar]
- 18.Silasi DA, Illuzzi JL, Kelly MG, Rutherford TJ, Mor G, Azodi M, Schwartz PE. Carcinosarcoma of the ovary. Int J Gynecol Cancer. 2008;18:22–29. doi: 10.1111/j.1525-1438.2007.00948.x. [DOI] [PubMed] [Google Scholar]
- 19.Zhou X, Zhao F, Wang ZN, Song YX, Chang H, Chiang Y, Xu HM. Altered expression of miR-152 and miR-148a in ovarian cancer is related to cell proliferation. Oncol Rep. 2012;27:447–454. doi: 10.3892/or.2011.1482. [DOI] [PubMed] [Google Scholar]
- 20.Zheng HB, Zheng XG, Liu BP. miRNA-101 inhibits ovarian cancer cells proliferation and invasion by down-regulating expression of SOCS-2. Int J Clin Exp Med. 2015;8:20263–20270. [PMC free article] [PubMed] [Google Scholar]
- 21.Wuerkenbieke D, Wang J, Li Y, Ma C. miRNA-150 downregulation promotes pertuzumab resistance in ovarian cancer cells via AKT activation. Arch Gynecol Obstet. 2015;292:1109–1116. doi: 10.1007/s00404-015-3742-x. [DOI] [PubMed] [Google Scholar]
- 22.Mitamura T, Watari H, Wang L, Kanno H, Hassan MK, Miyazaki M, Katoh Y, Kimura T, Tanino M, Nishihara H, et al. Downregulation of miRNA-31 induces taxane resistance in ovarian cancer cells through increase of receptor tyrosine kinase MET. Oncogenesis. 2013;2:e40. doi: 10.1038/oncsis.2013.3. [DOI] [PMC free article] [PubMed] [Google Scholar]
- 23.Choi EJ, Seo EJ, Kim DK, Lee SI, Kwon YW, Jang IH, Kim KH, Suh DS, Kim JH. FOXP1 functions as an oncogene in promoting cancer stem cell-like characteristics in ovarian cancer cells. Oncotarget. 2016;7:3506–3519. doi: 10.18632/oncotarget.6510. [DOI] [PMC free article] [PubMed] [Google Scholar]


