Abstract
Multiplexed single cell experimental techniques like mass cytometry measure 40 or more features and enable deep characterization of well-known and novel cell populations. However, traditional data analysis techniques rely extensively on human experts or prior knowledge, and novel machine learning algorithms may generate unexpected population groupings. Marker enrichment modeling (MEM) creates quantitative identity labels based on features enriched in a population relative to a reference. While developed for cell type analysis, MEM labels can be generated for a wide range of multidimensional data types and MEM works effectively with output from expert analysis and diverse machine learning algorithms. MEM is implemented as an R package and includes three steps: 1) calculation of MEM values that quantify each feature’s relative enrichment in the population, 2) reporting of MEM labels as a heatmap or as a text label, and 3) quantification of MEM label similarity between populations. The protocols here show MEM analysis using datasets from immunology and oncology. These MEM implementations provide a way to characterize population identity and novelty in the context of computational and expert analyses.
Keywords: Single cell, flow cytometry, mass cytometry, machine learning, cell identity, cytotype, computational biology, bioinformatics, marker enrichment modeling (MEM)
Introduction
The size and complexity of single-cell data is increasing with advances in laboratory techniques, such as the ability to analyze cells in more than 40 dimensions with mass cytometry (Bandura et al., 2009; Spitzer & Nolan, 2016). Numerous recent studies have used mass cytometry for multi-dimensional single cell analysis, yielding novel biological insights (Aghaeepour et al., 2017; Cavrois et al., 2017; Lakshmikanth et al., 2017; Seshadri et al., 2017; Wei et al., 2017). The high dimensionality of the data resulting from these types of studies has driven the development of novel computational analysis methods and machine learning tools that can parse meaningful information from the increasingly complex data (Diggins, Ferrell, & Irish, 2015; DiGiuseppe, Cardinali, Rezuke, & Pe’er, 2017; Levine et al., 2015; Lun, Richard, & Marioni, 2017; Newell & Cheng, 2016; Saeys, Gassen, & Lambrecht, 2016; Wang, Zhu, Pierson, Ramazzotti, & Batzoglou, 2017; Weber & Robinson, 2016). However, characterizing populations discovered using these automated or semi-automated approaches is generally left to expert interpretation, a process that can be both time consuming and susceptible to subjectivity or bias.
To address the need for automated population characterization, marker enrichment modeling (MEM) was developed to automatically generate a label describing cell populations that is both human understandable and machine readable, paving the way for further innovation in machine learning approaches to single-cell research (Diggins, Greenplate, Leelatian, Wogsland, & Irish, 2017).
MEM quantifies population-specific feature enrichment and provides these values as population labels (Eq. 1). MEM outputs the relative enrichment of cell features, such as cell markers and protein expression, allowing for comparison between cell populations and providing insight into potential unique features of cell populations.
| (Equation 1) |
The MEM equation finds the difference between each marker’s expression on the population and its reference and then scales this factor up if the marker is expressed more homogeneously on the population than on the reference. MEM values reflect protein enrichment better than other metrics, such as z-score or K-S (Diggins et al., 2017).
When the difference between MAGpop and MAGref is negative, meaning that the feature is more highly expressed on the population’s reference than on the population, the MEM score is negated to show negative enrichment (i.e. a relative lack). In contrast, positive MEM values are obtained when MAGpop is greater than MAGref and are interpreted as a relative enrichment.
Protocol 1 demonstrates analysis of healthy human blood cell populations using built-in mass cytometry data. Protocol 2 demonstrates use of MEM to characterize cells from melanoma patient blood analyzed by mass cytometry and provides an example of incorporating a set of new files. Protocol 3 demonstrates quantitative comparison of MEM labels using RMSD as a surrogate measure of population similarity that is effective across data types, instruments, and laboratory groups.
Strategic Planning
Data quality control and pre-processing
After data collection, quality control should be performed on the data to ensure that results of the MEM analysis arise from biological variation rather than technical artifacts. Common steps in quality control are bead normalization (Finck et al., 2013), pre-gating for nucleic acid positive events, scaling and transformation, and compensation (for fluorescence flow cytometry data).
Pre-gating should be performed after normalization and scale transformations. Typically, pre-gating involves creating an intact-cell gate of collected events that were positive for the nucleic acid marker. Additional pre-gating for immune cells may involve gating out all non-CD45 positive events.
Population identification
Populations for MEM analysis can be defined manually or automatically. Many tools exist for supervised and unsupervised data classification, gating, and clustering (Aghaeepour et al., 2013; Bruggner, Bodenmiller, Dill, Tibshirani, & Nolan, 2014; Diggins et al., 2015; Saeys et al., 2016; Shekhar, Brodin, Davis, & Chakraborty, 2014; Wang et al., 2017; Weber & Robinson, 2016).
MEM requires each cell to be associated with a numerical cluster ID. Biaxial gates or cell subsets identified by other supervised approaches should be systematically numbered to enable MEM analysis. Many automated clustering tools provide numerical cluster IDs that can be extracted for MEM analysis.
File types accepted by MEM
MEM accepts three file types: Flow Cytometry Standard files (FCS), tab-delimited text files (TXT), and comma-separated values files (CSV). FCS files are generated by the flow cytometer and contain the raw, single-cell median intensity values, as well as meta-data with details about the machine, the analysis parameters, the samples, and the channel or feature names and tags. These files must be parsed using specialized software or programs in order to access the raw data. This data can be accessed within R using the flowCore package (B. Ellis, 2017). Commonly used flow cytometry data analysis platforms like Cytobank (J. Paul Robinson (Ed.), 2010) and FlowJo (www.flowjow.com) can also access, analyze, and extract the information stored in FCS files. Any table of data in CSV format where events are in rows (e.g. cells, patients) and features are in columns can be analyzed by MEM. Thus, MEM is data type agnostic, and while the examples here analyze protein measurements in cells, MEM can also be applied to groups of patients where clinical features have been quantified. It is important in this case to consider the scale of the data. It may be useful to transform the readings for each feature to a comparable scale space prior to using MEM or other quantitative analysis tools.
Data structure accepted by MEM
Data that is entered as input for the MEM function must be pre-clustered or gated, and unless each input file corresponds to one discrete cluster, the last column of each file should contain a column labeled “cluster” that provides a non-zero, numeric cluster ID for each cell. The data can be provided to MEM as a single file or multiple files where either 1) all data are contained in one matrix with a “cluster” column that specifies the cluster ID of each cell (e.g. Protocol 1), 2) the data are divided between multiple files where each file only contains cells from one cluster (e.g. Protocol 2), or 3) the data are divided between multiple files, each of which contains cells from multiple clusters and therefore includes a column specifying the cluster ID of each cell.
Basic Protocol 1: MEM analysis of internal data
MEM function parameters
The MEM function is defined as:
MEM(input_data, transform = TRUE, cofactor = 5, choose.markers = FALSE,
choose.ref = FALSE, rename.markers = FALSE, file.is.clust = FALSE, add.fileID
= FALSE, IQR_thresh = NULL)
Input data
Input data should meet the requirements outlined above (see Strategic Planning section). Briefly, data must be in the form of a matrix or multiple matrices with one event per row and one channel or marker per column. The data must also include pre-determined, numeric cluster IDs for each cell. The data can either be provided the form of an R matrix or as a list of file names in the working directory that are of the type FCS, TXT, or CSV.
Transform and cofactor
The argument transform should be set to either TRUE or FALSE to specify if a hyperbolic arcsine transformation should be applied to the data.
The hyperbolic arcsine transformation (asinh for short) is a log-like transformation commonly applied to flow cytometry data that brings the raw data values, which can vary by orders of magnitude on a given channel, into a comparable scale range to facilitate statistical and visual comparisons. If the distances between populations are misrepresented by incorrect scaling, automated population identification methods and statistical analyses will incorrectly group cells and produce erroneous statistical results.
The cofactor argument in MEM should specify the cofactor to be used for the transformation. The default cofactor used when transform=TRUE is 5, which is generally appropriate for most mass cytometry data.
A larger cofactor has the effect of compressing values more tightly around 0, while a smaller cofactor spreads them out around 0. Visualizing transformed values on a histogram for each channel can help you decide whether or not the cofactor is appropriate. If the cofactor is too high, the cell events will pile up in tall, narrow peaks near zero with little space between populations. If the cofactor is too low, there may be a wide distribution of cells around zero or even a hole in the peaks around 0, giving the appearance of two or more distinct populations of cells when these cells actually belong to the same population. A good rule of thumb is that an appropriate cofactor enables you to manually draw clear distinctions between real populations of cells on a histogram or biaxial plot. If in doubt, a control sample containing stained (positive) and unstained (negative) cells on the channel or channels in question can be run and then analyzed with a variety of cofactors to determine at which cofactor the positive and negative peaks are most distinct.
Fluorescence flow cytometry data often requires a different cofactor for each channel, as well as compensation to account for signal spillover. If this is the case, these pre-processing steps should be applied to the data prior to MEM analysis, and the data entered into MEM should include post-compensated, post-transformed values only with the argument transform = FALSE.
Choose markers
FCS files contain more columns than just the measured features of interest, such as blank channels, viability or nucleic acid markers, and event length or forward and side scatter. There may also be markers in the dataset that are not of interest and that you wish to leave out of the analysis. The MEM function argument choose.markers allows you to select which columns in the file to keep for the analysis. If choose.markers = TRUE, you will be prompted in the console to enter the column numbers to include. The function will print out a list of column names and their corresponding index to clarify which channel corresponds to which feature or parameter. By default, this argument is FALSE and all markers will be included in the analysis. Note that the final step of MEM score calculation scales results to a −10 to +10 scale across all MEM values in the data, so if a column is included in the analysis that contains off-scale values (e.g. the Time channel in mass cytometry derived FCS files), all of the MEM scores will be affected during scaling.
Rename markers
In flow cytometry data, the column names often contain the name of the metal or fluorophore tag, sometimes in place of the name of the marker measured on the given channel. For example, if CD45 were measured on the channel Sm(154)Di, the column could be labeled as Sm(154)Di instead of as “CD45.” The column name depends on how you labeled the channels during instrument panel setup. Because channel names frequently do not match the marker name, MEM() includes the option to rename markers. If rename.markers = TRUE, the original column names will be printed to the console and the user will be prompted to enter new column names, in order, separated by commas.
Choose reference
The argument choose.reference is FALSE by default and specifies whether or not you want to select a specific population to be used as the reference in the MEM calculation. By default, for each population, MEM designates the reference population as all other populations in the data set excluding that specific population. However, in some cases it may be useful to compare the populations to one specific cluster, such as stem cells or a healthy control. In this case, you should set choose.reference = TRUE and, when prompted, enter the numeric population ID of the desired reference population. Note that only one population can be selected, so if there are multiple populations to be used as a custom reference, they should be combined prior to the MEM analysis such that they share one population ID.
IQR threshold
MEM uses interquartile range (IQR) as a metric of spread in expression values within each population. In the MEM equation (Eq. 1), the IQR component increases the MEM score when the given marker is expressed more “tightly” or with less variance on the population than on its reference. However, when the expression value is very low or near zero on a population, the IQR will also be very low or near zero. The IQR component of the equation is a ratio, meaning that a very low denominator will result in a very high ratio and therefore a disproportionately high MEM score. This is especially important when MEM scales MEM scores to a −10 to +10 scale, so very high or very low MEM scores resulting from near-zero MEM scores can skew the scaling and ultimately misrepresent the degree of enrichment on other features. Setting a lower threshold for the IQR values is therefore necessary to prevent inflated MEM values due to low IQR values.
The IQR threshold is set by default to 0.5, a value found to work well across multiple datasets. Below 0.5, the IQR value is more likely to inflate the overall MEM score high enough to skew the −10 to +10 scaling and thereby obscure other highly enriched but slightly more variable markers. If the IQR threshold is too low, there may be one or two very high positive or negative MEM scores while the majority of MEM scores in the analysis fall near 0. Conversely, if the IQR threshold is too high, MEM scores will be approximately equal to the difference in medians because of the very low IQR component.
The IQR_threshold argument can be manually set to a different value if 0.5 is believed to be inadequate depending on the data type or structure. The MEM package also has the option to set IQR_threshold = “auto”, meaning that it will automatically calculate an IQR ratio based on the provided data. The “auto” IQR threshold is calculated as the IQR value corresponding to the second quartile median value across all of the populations and their corresponding reference populations.
The IQR component of the equation, (IQR_Ref/IQR_Pop −1), is only applied when the IQR of the reference is greater than the IQR of the population, ensuring that the magnitude difference is only scaled up when the marker is more homogenously expressed on the population than on the reference. Therefore, when the marker is more variably expressed on the population, the MEM score is equal to the difference in population magnitudes.
Working with multiple files as input
When the input data consists of multiple files, the arguments file.is.clust and add.fileID should be used to specify the structure of the data. If each file is comprised of cells from only one cluster, set file.is.clust = TRUE. The function will add numerical cluster IDs corresponding to the file order. A numbered list of file names is then output as a text file in the “output files” folder to specify which numerical ID corresponds to which file name.
If each file contains cells from multiple clusters, set file.is.clust = FALSE and add.fileID = TRUE or FALSE. For example, if each file contains cells from one patient but those cells belong to multiple clusters (designated in a “cluster” column), set add.fileID = TRUE to append a file ID value to the cluster ID. This modified cluster ID will be included in the final MEM output to specify both the cluster and the file from which it came. For example, cells from the first file and first cluster will be labeled as “1.1.”
MEM() output
When running MEM, the output of the function should be stored in an R object (as opposed to simply printing the results to the console). For example, in the following example, the MEM output is stored in an object named MEM_vals:
MEM_vals <- MEM(PBMC, transform = TRUE, cofactor = 5, choose.markers
= FALSE, choose.ref = FALSE, rename.markers = FALSE, file.is.clust =
FALSE, add.fileID = FALSE, IQR_thresh = NULL)
The structure of the MEM output is a list of matrices (populations in rows, features in columns) in the following order:
MAGpop: the median intensity values for each population on each marker.
MAGref: the median intensity values for each population’s reference.
IQRpop: the IQR values for each population.
IQRref: the IQR values for each population’s reference.
MEM matrix: MEM scores for each population.
Build.heatmaps() function parameters
The function build.heatmaps() takes the list of matrices provided by the MEM() function and generates heatmaps displaying population medians, IQRs, and MEM scores. The build.heatmaps() function is defined as:
build.heatmaps(MEM_vals, cluster.MEM = "none", cluster.medians = "none",
cluster.IQRs = “none”, display.thresh = 0, newWindow.heatmaps=FALSE,
output.files = FALSE)
Input
The input for build.heatmaps() is the R object containing the list of matrices generated by MEM().
Clustering heatmaps
The output heat maps can be hierarchically clustered using the arguments cluster.MEM, cluster.medians, and cluster.IQRs. Settings for these arguments can include “none”, “row”, “col”, or “both.” If “row” or “both” are entered, the populations will be clustered, and if “both” or “col” are entered, the features will be clustered.
If cluster.MEM is clustered by row and/or column, and cluster.medians and cluster.IQRs are set to “none”, the medians and IQRs heatmaps will be ordered according to the clustering of the MEM heatmap. The clustering method used by build.heatmaps() employs the default complete linkage hierarchical clustering algorithm in the hclust package.
Display threshold
The argument display.thresh accepts a numerical input from 0–10 that specifies which markers to display as labels on the heatmap depending on their MEM scores. For example, if display.thresh = 5, only markers with an absolute MEM score of 5 or more will be included in the population MEM label and written to the “enrichment scores” output file.
Output
When the argument output.files = TRUE, the results of build.heatmaps() are written to a folder that the function creates as a subdirectory of the working directory, labeled “output files”. This output includes 1) a TXT file with the matrix of MEM scores, where populations are in rows and markers are in columns, ordered to match the heat map clustering order; 2) a TXT file with the matrix of population median expression levels, arranged according to clustering; 3) a TXT file with the matrix of population IQR values; 4) a TXT file containing the population labels as character strings; and 5) if there are multiple files, a TXT file containing a list of numbered file names to indicate which cluster number corresponds to each file.
If newWindow.heatmaps = TRUE, the IQR, median and MEM heatmaps that are displayed by build.heatmaps() will be displayed in a new R window as opposed to within the RStudio GUI. If newWindow.heatmaps = FALSE and the size of the heat map is too large to fit the allotted space in the GUI Plot panel, an error message will be displayed in the console stating that the figure margins are too large.
Note that users working on the MAC platform must install XQuartz (https://www.xquartz.org/index.html) in order to run the X11() command, which is needed to open new windows in R.
Root-mean-square distance for population similarity comparison
The MEM_RMSD() function is defined as:
MEM_RMSD(MEM_vals,format=NULL,newWindow.heatmaps=FALSE,output.matrix=FALSE)
MEM_RMSD to determine population similarity
An optional, final step of the MEM analysis is to compare population MEM scores to determine how similar populations are in terms of their feature enrichment.
The MEM R package includes a function , MEM_RMSD, that performs a pairwise comparison of population MEM scores given the output of MEM() as input. MEM_RMSD calculates the average root-mean-square distance between populations’ MEM score. The resulting values are therefore a relative measure of how similar each pair of populations are to one another.
RMSD is calculated as the square root of the averaged sum of squared differences between marker A on population 2 and on population 1, marker B on population 2 and population 1, through n markers in the data set (Eq. 2 and Eq. 3). The maximum RMSD is calculated as the maximum RMSD value across all pairwise comparisons in the matrix.
| (Equation 2) |
| (Equation 3) |
| (Equation 4) |
The percent max RMSD values (Eq. 4) can be displayed in a clustered heatmap and written to a tab-delimited text file in the output files folder by setting output.matrix= TRUE. In the clustered heatmap, cells that are more similar to one another in terms of feature enrichment will group together, while those with different enrichment profiles will cluster apart.
Necessary Resources
R/Rstudio Software
R is a statistical programming environment that is commonly used for biostatistics and bioinformatics analyses. The associated graphical user interface (GUI), RStudio, provides a user-friendly platform for writing and executing R code. So, while an installation of R provides a basic console interface for writing and running code, using RStudio makes that process easier and more intuitive.
RStudio requires that R is also installed in order to run. Both can be downloaded and installed for your particular machine and platform. R can be downloaded from http://cran.r-project.org/bin/windows/base/ and RStudio can be downloaded from http://www.rstudio.com/products/RStudio. Many tutorials and guides also exist for those who are beginners to R/RStudio.
To open the webpages where R and RStudio are available for download or update, you can also run the following lines of code:
> browseURL("http://cran.r-project.org/bin/windows/base/", browser =
getOption("browser"), encodeIfNeeded = FALSE)
> browseURL("http://www.rstudio.com/products/RStudio/", browser =
getOption("browser"), encodeIfNeeded = FALSE)
MEM R package
MEM is implemented as an R package. The most recent version of MEM and its associated files can be downloaded from mem.vueinnovations.com. To open the browser and download the files, run the following command:
> browseURL("https://mem.vueinnovations.com/", browser =
getOption("browser"), encodeIfNeeded = FALSE)
The download will be available within 24 hours. Download the files and save them in a new folder. Be sure to unzip the files and use the unzipped files for running MEM.
Example Data Sets
Internal data: Normal Human PBMC
The dataset included with the MEM package as internal data is a mass cytometry dataset from analysis of normal human peripheral blood mononuclear cells (PBMCs) (Leelatian, Diggins, & Irish, 2015). This dataset is downloaded as a component of the MEM package itself, and is contained in the MEM package data folder. It can be accessed from within R at the command line (described in Protocol 1). The data are comprised of raw (pre-transformation) median intensity values and includes a total of 25 surface markers. The cells have been pre-gated into seven major populations: 1) CD4+ T cells, 2) CD8+ T cells, 3) Dendritic cells (DCs), 4) IgM- B cells, 5) IgM+ B cells, 6) Monocytes, and 7) Natural killer (NK) cells. These data were generated using an early version of CyTOF software, and therefore the optimal arcsinh cofactor is 15 rather than the current default of 5.
External data: Melanoma patient blood
Blood was collected from 5 melanoma patients treated with anti-PD1 therapy, before and after treatment. Mass cytometry analysis was performed as previously described (Greenplate et al., 2016b). The data were clustered using flowSOM (Support Protocol 1) to yield 25 clusters of cells across all patients and timepoints. The data can be downloaded from flow repository (https://flowrepository.org/experiments/1394). The study was conducted in accordance with the Declaration of Helsinki and was approved by Vanderbilt University Medical Center Institutional Review Board.
CD4+ T cell and B cell MEM Scores
MEM scores were previously calculated for 80 populations of cells: 39 B cell subsets and 41 CD4+ T cell subsets (Diggins et al., 2017). The same population of stem cells was used as the reference for all the populations during the MEM calculations. These populations of cells were identified either manually or computationally from data sets collected across institutions, platforms (fluorescence vs mass cytometry), tissues (peripheral blood, bone marrow, and tonsil), and stimulation conditions (unstimulated vs stim with SEB). Details of each sample and population can be found in the Excel file included with the Supplementary Data and well as in Diggins et al. (Diggins et al., 2017). The MEM score files used in Protocol 3 is available in the flow repository experiment (https://flowrepository.org/experiments/1394) as an attached zip folder.
Protocol Steps
-
Install MEM and dependent packages.
Download the MEM files from https://mem.vueinnovations.com/ and determine the path to the downloaded folder. For example, if after downloading and extracting the file it was placed in the Documents folder, the path might be “C:/Users/You/Documents.” The following lines of code can be run to 1) set the path to the folder, 2) view the files in the folder to check that the path is correct, and 3) install the package. Note that RStudio must be run as an administrator in order to allow direct package installation and updates.
MEM also depends on the base packages “stats”, “tools”, “grDevices”, and “utils”. These are included with the R download and do not have to be manually installed.
> MEM_path = “C:/Users/You/Documents/MEM_files/MEM”
> list.files(MEM_path)
> install.packages(MEM_path, type="source", repos=NULL)
MEM depends on the packages “gplots” and “flowCore.” These can be installed directly at the R command line using the following commands.
> install.packages("gplots") > source("https://bioconductor.org/biocLite.R") > biocLite("flowCore") > install.packages(MEM_path, type="source", repos=NULL) -
Set up R environment to run analysis.
> library(MEM)
> library(flowCore)
> library(gplots)
Use the library() command to load the required packages into the RStudio environment.
The commands setwd() and getwd() can be used to set and get (i.e. check) your working directory, respectively. The working directory is the folder path where data files are located and where MEM output files will be written. Running getwd() prints out your current working directory path to the console, which is useful if you aren’t sure what working directory is currently set in your R environment.
> setwd(“C:/Users/You/Path”)
> getwd()
[1] "C:/Users/You/Path"
-
Set MEM() parameters and run the function.
To perform a MEM analysis on the internal PBMC dataset, run MEM() with the following settings:
> MEM_vals <- MEM(PBMC, transform = TRUE, cofactor = 15,
choose.markers = FALSE, choose.ref = FALSE, rename.markers = FALSE,
file.is.clust = FALSE, add.fileID = FALSE, IQR_thresh = NULL)
This should take only a few seconds to execute. The results of the analysis will be stored in the R variable MEM_vals.
-
View MEM output in console (optional).
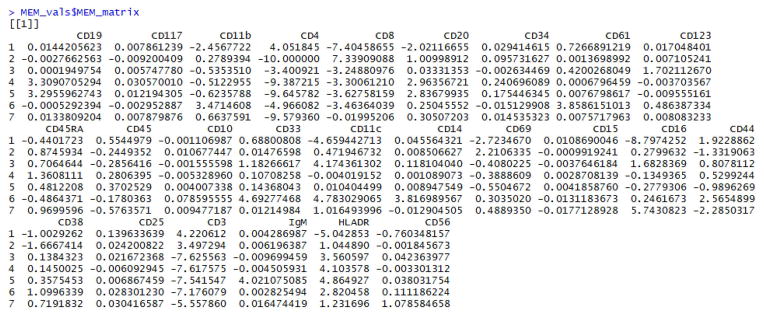
The individual matrices generated by MEM()can be viewed in the RStudio console by entering the commands: MEM_vals$MAGpop, MEM_vals$MAGref, MEM_vals$IQRpop, MEM_vals$IQRref, and MEM_vals$MEM_matrix (Fig. 1).
-
Set build.heatmaps() parameters and run the function.
The build.heatmaps() function takes the output of MEM() as input. In this example, the output from MEM() is stored in the object MEM_vals. Because newWindow.heatmaps = TRUE and cluster.MEM = ”both”, the heatmaps will display in new windows and the MEM heatmap will be clustered on rows and columns. The median and IQR heatmaps will be displayed with the same row and column order as the clustered MEM heatmap.
>
build.heatmaps(MEM_vals,newWindow.heatmaps=TRUE,cluster.MEM="both",c
luster medians=”none” display thresh=0 output files=FALSE)
-
View and interpret heatmaps.
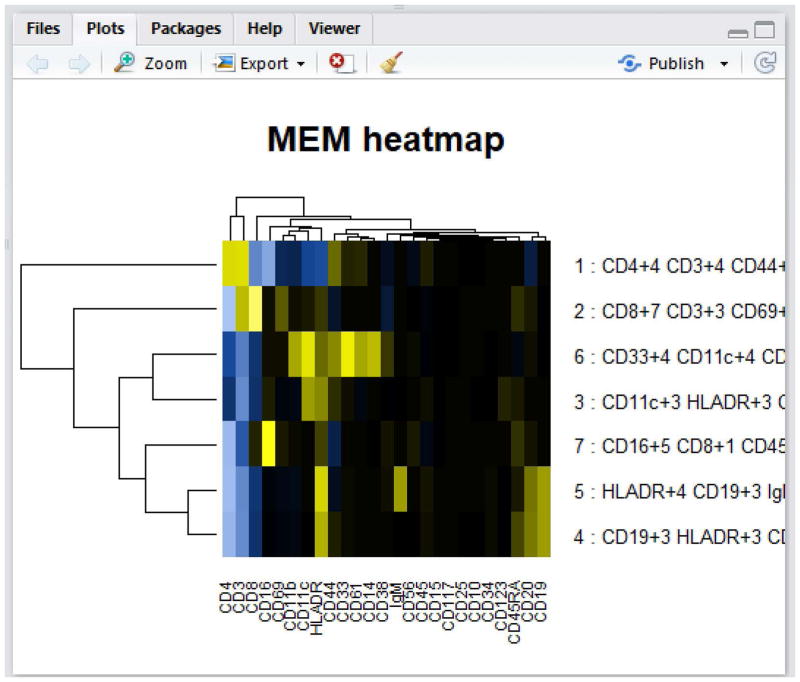
When newWindow.heatmaps = FALSE, the heatmaps will output in the lower right panel of the RStudio GUI in the Plots tab (Fig. 2). Navigate through the plots by clicking the arrows at the top of the Plots tab. Note that large matrices will not display properly in the GUI panel and an error message will appear. It is therefore best practice to set newWindow.heatmaps = TRUE unless the dataset contains approximately ten populations or fewer.
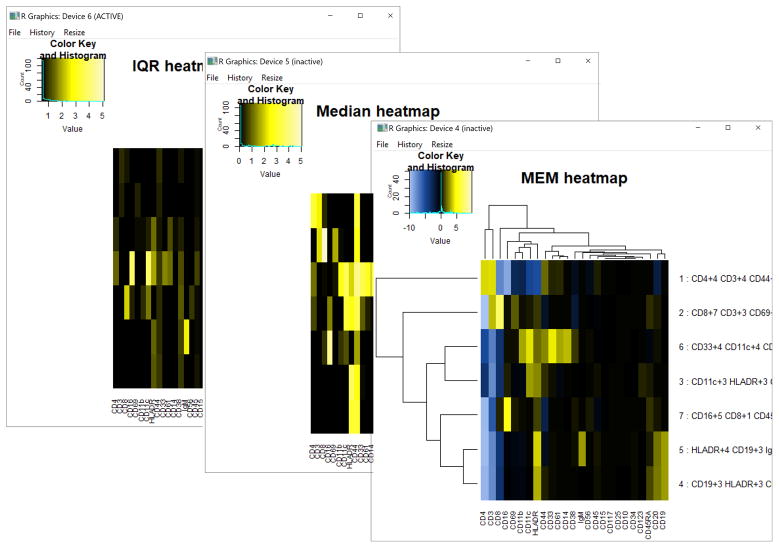
When newWindow.heatmaps = TRUE, one pop-out R window will appear for each of the heatmaps: IQRpop, MAGpop, and MEM (Fig. 3).
The row names of populations in the MEM heatmap are set as the population ID followed by the MEM label. Due to their length, the labels are often cut off of the plot window. To view them in full, a saved PDF of the MEM heatmap can be opened in programs like Adobe Illustrator or other editing programs. These MEM labels are also written to the output files folder as “[date-time stamp] enrichment row-names.txt” and can be viewed there in full.
-
Access MEM output files in subdirectory folder.
The outputs folder generated by build.heatmaps() when output.files = TRUE can be found within the working directory folder (see Step 2). In the outputs folder, you will see three tab-delimited text files containing the population MEM labels (enrichment scores), the matrix of MEM scores, and the matrix of population medians. The TXT files are labeled with a date and time stamp appended to the generic file name (Fig. 4). In cases where multiple files were entered as input to MEM(), the list of numbered file names will also appear in this folder.
-
Calculate and visualize the RMSD comparison of population MEM scores.
The MEM_RMSD() function can be run using either a matrix of MEM scores or the list of matrices from MEM() output as input. In the following example, the list of matrices, MEM_vals, is provided as input to MEM_RMSD.
> pop_compare = MEM_RMSD(MEM_vals, newWindow.heatmaps=TRUE,
output.matrix=TRUE)
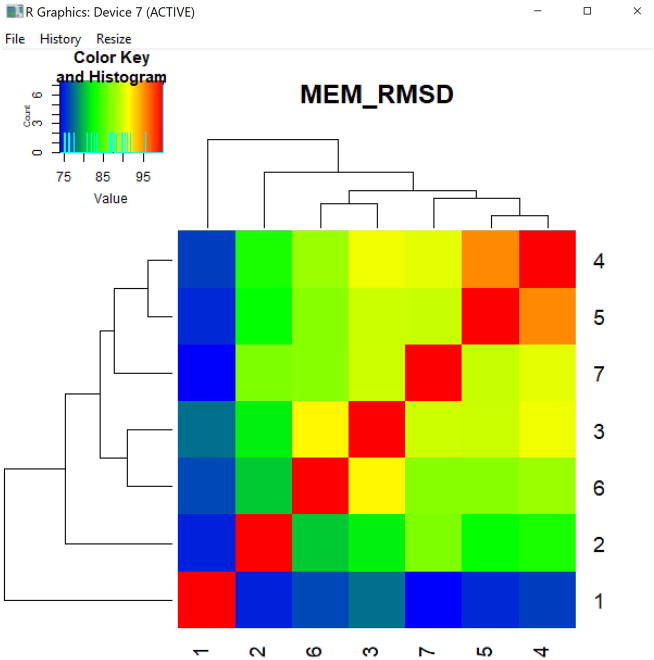
In this example, the values displayed in the MEM_RMSD heatmap are stored in the object pop_compare. The MEM_RMSD function produces the percent maximum RMSD scores between each pair of populations and displays those values as a heatmap (Fig. 5). The arguments newWindow.heatmaps and output.matrix are FALSE by default. If TRUE, the heatmap will output to a new R window and the matrix of pairwise percent max RMSD scores will be written to the output files folder as a tab-delimited text file. The output heatmap is hierarchically clustered by rows and columns.
Reformat heatmaps and text labels for publication. The heatmaps can be saved as PDFs from within RStudio and modified in Adobe Illustrator and other editing programs.
Figure 1. View the output matrices from the MEM function in the RStudio console.
The output of MEM is a list of matrices: MAGpop, MAGref, IQRpop, IQRref, and MEM_matrix. These can be viewed in the console by entering the name of the MEM output object (e.g. MEM_vals) as a command at the command line. Individual matrices can be viewed using the $ operator to subset them by name. Here, the MEM_matrix object is displayed using MEM_vals$MEM_matrix.
Figure 2. View output of build.heatmaps() in the RStudio GUI.
Small heatmaps can be displayed in the R GUI Plots panel. Here the output is shown from build.heatmaps() in RStudio.
Figure 3. Heatmaps generated by build.heatmaps().
Heatmaps are shown in new windows when newWindow.heatmaps = TRUE. Output is shown resulting from setting cluster.MEM = “both.” These plots can be saved as PDF files from the dropdown menu in the window’s File tab.
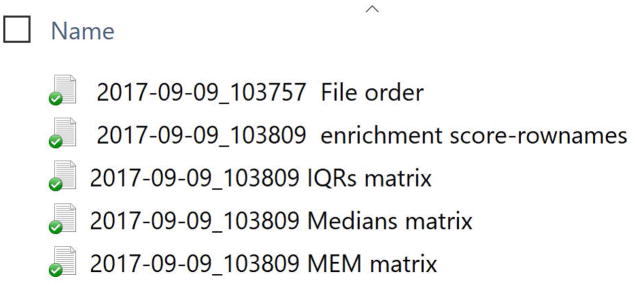
Figure 4. View files in output files folder.
Build.heatmaps() creates a new folder called output files as a subdirectory of the working directory and writes output as tab-delimited text files. The files include 1) the population MEM labels (enrichment score row names) that are displayed in the MEM_matrix heatmap, 2) the matrix of population median values, and 3) the matrix of MEM scores.
Figure 5. MEM_RMSD heatmap.
Heatmap of percent maximum RMSD values calculated pairwise between the seven populations in the PBMC dataset, given their MEM scores as input to MEM_RMSD(). Each population is compared to the others, including itself.
Basic Protocol 2: Analyzing external data with MEM
In Protocol 2, data were clustered for MEM analysis using FlowSOM. FlowSOM uses self-organizing maps (SOM) to cluster data and visualizes the results as a minimum spanning tree. Given multi-dimensional data as input and a desired number of clusters, the algorithm computes meta-clusters and provides cell-level cluster IDs as well as a minimum spanning tree visualization of the clusters. FlowSOM has been shown to classify single-cell data with a high level of accuracy compared to manual biaxial gating analysis (Van Gassen et al., 2015; Weber and Robinson, 2016). FlowSOM is implemented as an R package (Van Gassen S, 2017). See Support Protocol 1 for details.
Necessary resources
See Basic Protocol 1.
Protocol Steps
-
Cluster or gate data.
The data shown in this example were clustered using viSNE and FlowSOM (See Support Protocol 1 below).
-
Download data in a designated folder on your computer.
The example data set used here can be downloaded from flow repository (https://flowrepository.org/experiments/1394). Once downloaded, extract the files and put them into a new folder. For example, if the zipped folder is downloaded from flow repository and then extracted into a folder called “Data files” in the Documents folder, the complete path on a Windows platform would be “C:/Users/Me/Documents/Data files.” Note that the folder should only contain the files to be analyzed by MEM.
Remember that for any data set, the file formats and file types must meet the requirements outlined in “Data formatting for R and MEM analysis”.
-
Reformat data if necessary.
If the data are not in the form of cells in rows and markers in columns, with a column labeled “cluster” as the last channel to designate cell cluster IDs (unless each file contains one discrete cluster), it should be reformatted prior to loading it into R or from within R prior to MEM analysis. This can be done in programs such as Microsoft Excel or in R, depending on the type and extent of required formatting. The example dataset here is already correctly formatted and does not require modification.
-
Set up R environment for MEM analysis.
Setting up the R environment entails setting your working directory, loading required packages, and loading data files into R. In the following example, the file path is set to the location of the downloaded and extracted data files (a folder called “Data files”). Note that if you have not installed MEM and its required packages, this must be completed before running your MEM analysis. See “Strategic Planning” section for details on how to install these packages.
The files to be analyzed by MEM are loaded into R as the list of file names found in the working directory and stored in an object. Here, that object is a list called infiles. The command dir() retrieves all file names in the working directory.
> setwd(“C:/Users/Me/Documents/Data files”)
> library(MEM)
> library(flowCore)
> infiles <- dir()
To test that the correct files have been loaded into R, enter the name of the file list object (e.g. infiles) as a command in the console. The list of file names will print in the console.
> infiles
[1] "Diggins et al_melanoma patient blood_Cluster 1.fcs"
  [2] "Diggins et al_melanoma patient blood_Cluster 10.fcs"
  [3] "Diggins et al_melanoma patient blood_Cluster 11.fcs"
  [4] "Diggins et al_melanoma patient blood_Cluster 12.fcs"
  [5] "Diggins et al_melanoma patient blood_Cluster 13.fcs"
  [6] "Diggins et al_melanoma patient blood_Cluster 14.fcs"
  [7] "Diggins et al_melanoma patient blood_Cluster 15.fcs"
  [8] "Diggins et al_melanoma patient blood_Cluster 16.fcs"
  [9] "Diggins et al_melanoma patient blood_Cluster 17.fcs"
[10] "Diggins et al_melanoma patient blood_Cluster 18.fcs"
[11] "Diggins et al_melanoma patient blood_Cluster 19.fcs"
[12] "Diggins et al_melanoma patient blood_Cluster 2.fcs"
[13] "Diggins et al_melanoma patient blood_Cluster 20.fcs"
[14] "Diggins et al_melanoma patient blood_Cluster 21.fcs"
[15] "Diggins et al_melanoma patient blood_Cluster 22.fcs"
[16] "Diggins et al_melanoma patient blood_Cluster 23.fcs"
[17] "Diggins et al_melanoma patient blood_Cluster 24.fcs"
[18] "Diggins et al_melanoma patient blood_Cluster 25.fcs"
[19] "Diggins et al_melanoma patient blood_Cluster 3.fcs"
[20] "Diggins et al_melanoma patient blood_Cluster 4.fcs"
[21] "Diggins et al_melanoma patient blood_Cluster 5.fcs"
[22] "Diggins et al_melanoma patient blood_Cluster 6.fcs"
[23] "Diggins et al_melanoma patient blood_Cluster 7.fcs"
[24] "Diggins et al_melanoma patient blood_Cluster 8.fcs"
[25] "Diggins et al_melanoma patient blood_Cluster 9.fcs"
-
Set MEM parameters and run function.
> MEM_vals = MEM(infiles,
transform=TRUE,cofactor=5,choose.markers=TRUE,rename.markers=TRUE,file.i
s.clust=TRUE)
The example dataset contains raw median values and therefore requires arcsinh transformation with a cofactor of 5. Because these files are raw FCS files, they also contain columns than will not be used for the MEM analysis. To exclude these and rename the marker that are included, choose.markers and rename.markers should be set to TRUE. The file.is.clust argument is also be TRUE because each file contains cells from one discrete cluster.
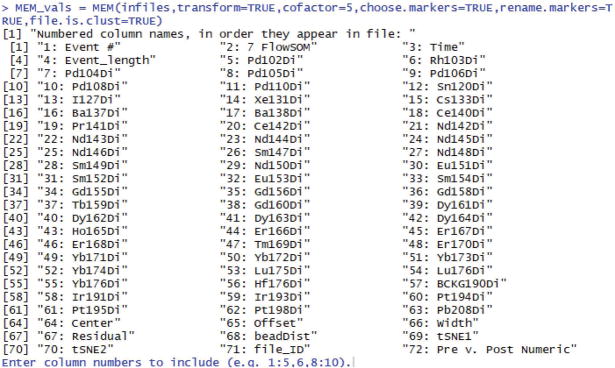
You will first be prompted to enter which columns to include (Fig. 6). In this case, the columns 19:20, 22:40, 42:53, and 55 (where “:” indicates “through”) contain the markers of interest. The other columns are either blank channels or non-marker information, such as event length (column 4) or t-SNE channels (columns 69 and 70).
Enter column numbers to include (e.g. 1:5,6,8:10). 19:20,
22:40, 42:53, 55
Enter the desired column numbers at the prompt:
Next, you will be prompted to rename the columns (Fig. 7).
Enter new marker names, in same order they appear above, separated
by commas.
              No spaces allowed in name.
            CD49D,CD19,CD5,CD69,CD4,CD8a,CD7,CD16,CD25,CD134,CD14,CD95,Tim
            3,CD45,CD279,CD183,CD194,CD197,CD28,CD152,Ki67,CD161,CD45RO,CD
            44,CD27,CD278,CD45RA,CD3,CD9,CD5,CD137,HLADR,LAG3,CD127
Enter the column names at the prompt:
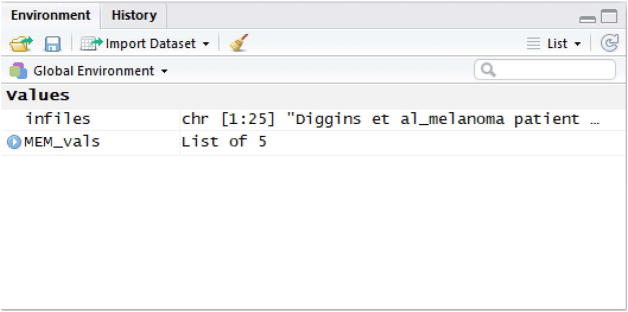
The MEM function will complete the run. This may take a couple of minutes. Once completed, the cursor will reappear at the command line and the MEM_vals object will appear in the Environment panel of RStudio (Fig. 8).
-
Set build.heatmaps() parameters and run the function.
>
build.heatmaps(MEM_vals,cluster.MEM="both",cluster.medians=”none”,cluste
r.IQRs=”none”,newWindow.heatmaps=TRUE,output.files=TRUE)
The build.heatmaps() function takes the output of MEM() as input. In this example, that output is stored in the MEM_vals object. Here, cluster.MEM = “both”, meaning that both rows and columns of the MEM heatmap will be clustered. The medians and IQRs heatmaps will be ordered according to the clustered row and column order of the MEM heatmap. The argument newWindow.heatmaps and output.files are set to TRUE, so the heatmaps will be displayed in new windows and the matrix values will be written to file in the output files folder. Note that because there are multiple data files, the output files folder will also contain a text file listing the file names and their corresponding cluster ID.
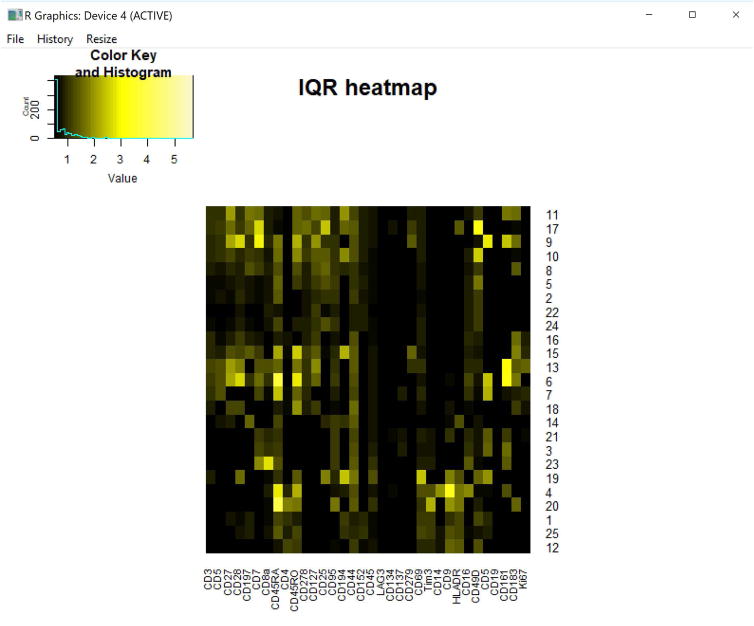
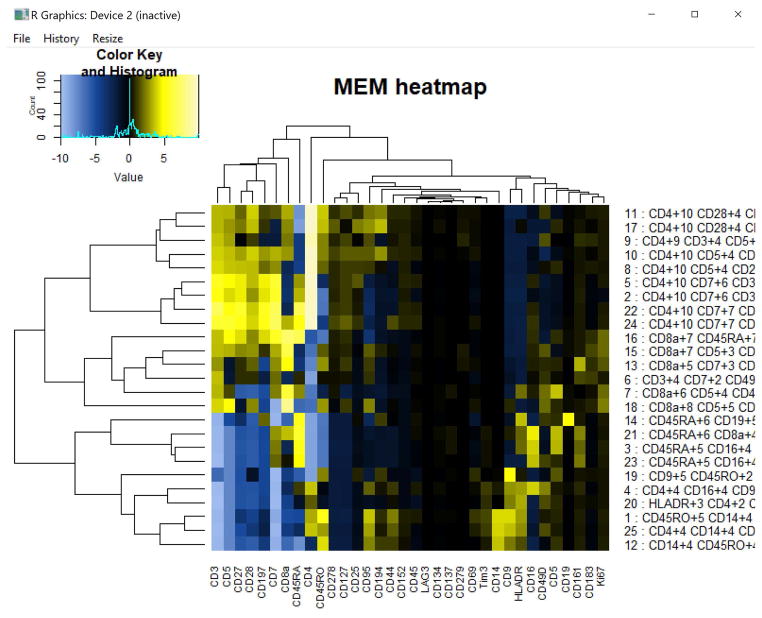
The three heatmaps will display as new windows (Fig. 9–11). You can resize the windows to spread out the rows and columns for easier viewing. The heatmaps can also be saved to file (e.g. as a PDF, PNG, JPEG file) using the dropdown File menu in the heatmaps’ display window.
The output files are written to the output files folder in the working directory (Fig. 12). The enrichment scores file contains the row names that are cut off in the output heatmap.
-
Set MEM_RMSD parameters and run function.
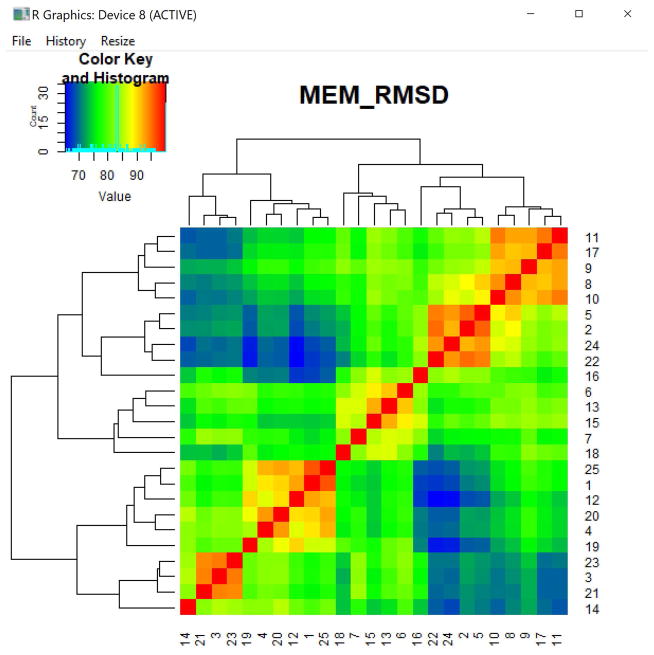
MEM_RMSD, described above, can be used to compare how similar populations are to one another given their MEM scores. In the following example, the heatmap will display in a new window (Fig. 13) and the values will be written to a text file in the output files folder.
> RMSD_vals =
MEM_RMSD(MEM_vals,newWindow.heatmaps=TRUE,output.matrix=TRUE)
The same results can be obtained by handing MEM_RMSD()a matrix as input, where populations are in rows and markers are in columns. For example, in the following example, the MEM matrix is extracted from the list of MEM_vals matrices and used as input to MEM_RMSD, yielding the same results.
> RMSD_vals =
MEM_RMSD(MEM_vals$MEM_matrix,newWindow.heatmaps=TRUE,output.matrix=TRUE)
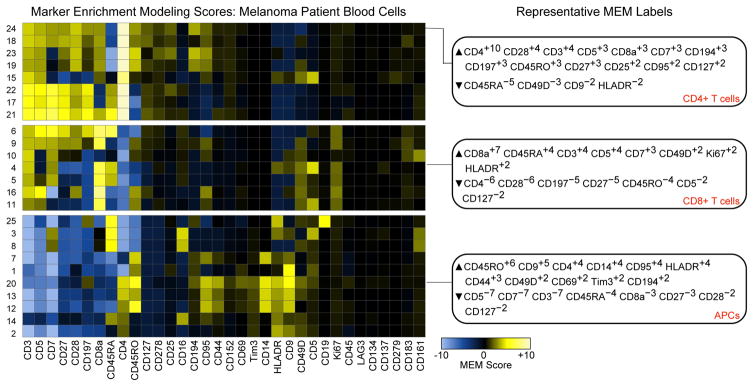
Format heatmaps for publication. Save the heatmaps as PDF files and edit from Adobe Illustrator or other graphics editing program. MEM labels can be formatted to show enrichment scores as superscripts to facilitate visualization, and heatmap groups can be broken apart (Figure 14).
Figure 6. R console prompt to enter columns to include in MEM analysis.
This prompt will appear when the argument choose.markers=TRUE.
Figure 7. Prompt to enter marker names.
This prompt will be displayed if rename.markers=TRUE.
Figure 8. Environment panel in RStudio.
All variables and values are displayed in this panel. After the MEM analysis completes, the MEM_vals object, a list of 5 matrices, will appear here.
Figure 9. IQR heatmap of 25 clusters melanoma patient blood.
Output heatmap of population IQR values from 25 clusters of melanoma patient blood cells. Rows and columns are ordered the same as the MEM heatmap (Fig. 12) because cluster.IQRs=”none”.
Figure 11. MEM heatmap of 25 clusters from melanoma patient blood.
Hierarchically clustered MEM scores of 25 cell clusters from melanoma patient blood. Dendrograms are displayed on the rows and columns, and the MEM labels (marker and respective enrichment score) are displayed as row names. When these row names are cut off, as they are above, they can be viewed in the output files folder in the “enrichment score- row names” file or by saving the heatmap as a PDF file and opening it in Adobe Illustrator or other editing programs.
Figure 12. Output files in Output Files folder found in working directory.
View of the output files folder, located in your working directory, after running build.heatmaps() with the argument output.files=TRUE. If you are unsure of where this folder is located, run the command getwd() at the R command line, and the path to your working directory will print to the console.
Figure 13. Heatmap of percent maximum RMSD values comparing 25 clusters.
Pairwise comparison of each population in the analysis using RMSD to compare their MEM scores. The row and column numbers correspond to the file number for each cluster (or row number of the population, when the input to MEM() was a single file). The numbered list of file names corresponding to these values can be found in the output files folder.
Figure 14. MEM heatmap shows features enriched on melanoma patient blood cells.
MEM heatmap was modified using Adobe Illustrator to show major breakpoints in the clustered heatmap. Representative MEM labels are shown for 3 of the 25 cell populations, including CD4 T cells, CD8 T cells, and APCs.
Support Protocol 1: viSNE and FlowSOM clustering of mass cytometry data
Melanoma patient blood samples were collected and analyzed by mass cytometry (Greenplate et al., 2016a). For each of five patients, a sample was collected before and after Pembrolizumab (anti-PD-1) treatment, yielding a total of 10 data files. Here, the samples are clustered in a two-step process: 1) viSNE analysis to reduce the dimensionality and visualize the data in a 2D map, and 2) automatic clustering of data using FlowSOM in R. This cluster analysis yields 25 cell clusters across all patients and timepoints.
ViSNE Analysis
Analyze data using viSNE (Amir el et al., 2013). In this example, data were first analyzed by viSNE in Cytobank (www.cytobank.org). viSNE is also available from http://www.c2b2.columbia.edu/danapeerlab/html/index.html, and the underlying t-SNE algorithm can be run in R using the packages “tsne” (https://CRAN.R-project.org/package=tsne) or “Rtsne” (https://CRAN.R-project.org/package=Rtsne ).
For the viSNE analysis, sample cells equally from the 10 FCS files and select all measured markers for dimensionality reduction. Download files as FCS files containing the t-SNE channels.
FlowSOM R package
FlowSOM is implemented as an R package. It can be downloaded at: https://github.com/SofieVG/FlowSOM (Van Gassen et al., 2015). To install the package:
> source("https://bioconductor.org/biocLite.R")
> biocLite("FlowSOM")
FlowSOM analysis
FlowSOM can be run using a single FCS file or multiple FCS files. In this example, 10 FCS files from the viSNE analysis are analyzed separately. Files can also be concatenated for FlowSOM analysis using the Cytobank concatenation tool (https://support.cytobank.org/hc/en-us/articles/206336147-FCS-file-concatenation-tool).
Use FlowSOM to generate clusters across all patient files. 25 clusters are generated in this example using t-SNE channels as input for clustering. The per-cell cluster ID is added back to the file which can then be uploaded to Cytobank for visualization and formatting, or input directly into MEM within R. Here, the data are gated in Cytobank into 25 clusters and download as 25 files, one for each cluster. These files are available for download from Flow Repository ((https://flowrepository.org/experiments/1394).
Protocol Steps
-
Run flowSOM. Note that here, only the tSNE channels are used for clustering. Alternatively, all or a subset of the measured features can be used for the clustering step.
> library(FlowSOM)
> setwd(“C:/Users/You/Path to folder containing data files”)
> datafiles <- dir(pattern="*.fcs")
> fSOM <- FlowSOM(datafiles, pattern = ".fcs", compensate = FALSE, transform =
TRUE, toTransform=c(68:69), scale = TRUE, colsToUse = c(68:69), xdim = 10, ydim
= 10, nClus = 25, seed = 42)
See Step 9 to run MEM directly on the FlowSOM clusters generated here. Steps 2–8 describe methods for visualizing the flowSOM results on the original viSNE axes and gating the clusters into individual files.
-
Create a flowSOM plot with meta-clusters overlaid
> PlotStars(fSOM[[1]])
> PlotStars(fSOM$FlowSOM,backgroundValues = as.factor(fSOM$metaclustering))
-
Obtain cluster IDs and export to a CSV file.
> flowSOM.clustering <- as.matrix(fSOM[[2]][fSOM[[1]]$map$mapping[,1]])
> write.csv(flowSOM.clustering, file="melanomadatasetFlowSOM.csv")
Copy FlowSOM cluster IDs into concatenated CSV file. For those familiar with R, concatenating the cluster IDs to the files can also be done in R/RStudio.
Import CSV file with FlowSOM cluster IDs into flow cytometry data analysis platform (here, we used Cytobank).
Gate by FlowSOM ID. This can be done by plotting FlowSOM ID as the X and Y axis and gating around each unique FlowSOM ID.
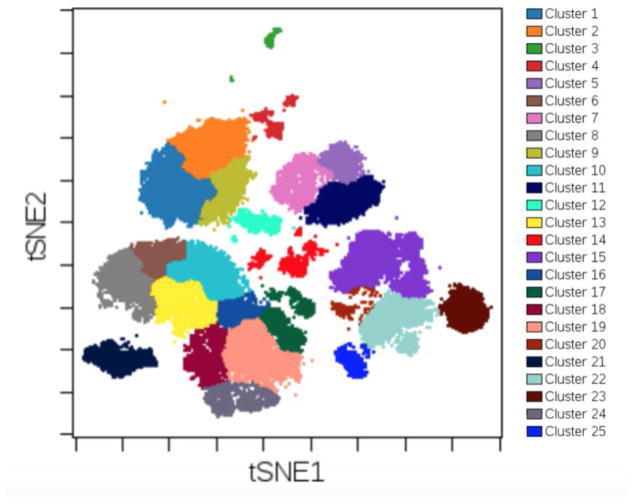
Plot t-SNE1 and t-SNE2 on the x and y axis and visualize FlowSOM IDs as the overlaid figure dimension to see where FlowSOM clusters lie relative to t-SNE axes (Fig .15).
Export FCS file with FlowSOM cluster IDs for use in MEM analysis. See Protocol 2.
-
You can also run MEM directly on the clusters generated by FlowSOM without visualizing and gating the results. Combine the FCS files into a single matrix and add the FlowSOM clustering results as the last column using the following code:
> tempfile = exprs(read.FCS(datafiles[1])) > allfiles <- matrix(nrow=0,ncol=ncol(tempfile)) > for(i in 1:length(datafiles)){ datafile <- exprs(read.FCS(datafiles[i])) allfiles <- rbind(allfiles,datafile) } > all_clustered = cbind(allfiles,as.numeric(flowSOM.clustering)) > colnames(all_clustered) = c(colnames(allfiles),"cluster") -
Run MEM on the FlowSOM clusters and build heatmaps. See Protocol 2, Step 5 for marker indices and names to enter when prompted. These are the same data files as those used for Protocol 2 and therefore include the same parameters.
> MEM_vals <- MEM(all_clustered, transform=TRUE, cofactor=5,
choose.markers=TRUE, rename.markers=TRUE)
>
build.heatmaps(MEM_vals,cluster.MEM="both",cluster.medians=”none”,cluster.IQRs=
”none” newWindow heatmaps=TRUE output files=TRUE)
Figure 15. Plot t-SNE axes and view FlowSOM clusters as the overlaid dimension.
FlowSOM clusters can be displayed on top of the t-SNE axes on which FlowSOM clustered. This method can be used to visually check whether or not the clustering captures expected populations of cells. The number of clusters and other FlowSOM parameters can then be adjusted to optimize the clustering.
Basic Protocol 3: Calculate RMSD similarity on populations from separate MEM analyses
It may sometimes be useful to use to compare populations from one MEM analysis to those from another analysis. This analysis can be performed using the MEM_RMSD() function.
The MEM_RMSD() function can accept a file path as input, pointing to a folder containing a set of files where each file includes MEM scores for a single population. These should be tab-delimited text files that each contain 2 columns: 1) the marker names and 2) the corresponding MEM score.
For each pair of populations, the MEM_RMSD() function determines which markers they have in common and then calculates the percent maximum RMSD between the two populations as described above using their common markers’ MEM scores. Therefore, populations can be compared even if they were not measured using the exact same antibody panel. Note that marker names must match each other exactly in order for the function to consider them the same.
Figure 2 of Diggins et al. (Diggins et al., 2017) shows the comparison of 80 immune cell populations from multiple experiments. In this example, the same populations of cells described in Diggins et al. are compared using the MEM_RMSD() function. These data, as well as a Microsoft Excel workbook containing file details, can be found in Supplemental Data downloadable from Flow Repository (https://flowrepository.org/experiments/1394).
Protocol Steps
-
Download files (Supplemental Data).
Download and extract the zipped folder of files into a new folder on your computer. There are 80 tab-delimited text files, one for each population. Each is formatted as a 2-column matrix, where the first column is the marker name and the second column contains the corresponding MEM score.
This folder also contains the Microsoft Excel file describing the samples. Move this file out of the folder prior to running MEM_RMSD().
-
Set working directory in R to the folder containing the downloaded files in Step 1.
Set your working directory to the folder containing the downloaded and extracted files. In this example, the files are in the folder “RMSD data files.” If this is a new R session, load the MEM package using the library() command.
> setwd(“C:/Users/Me/Documents/RMSD data files”)
> library(MEM)
-
Set MEM_RMSD() parameters and run the function.
The working directory is entered here as input. The argument format should be set to “pop files”. The default setting is format = NULL, meaning that the argument is ignored unless set to “pop files” to indicate that the input is a path to multiple population files containing MEM scores.
> RMSD_vals = MEM_RMSD(“C:/Users/Me/Documents/RMSD data files”, format =
“pop files”, newWindow.heatmaps=TRUE, output.matrix=TRUE)
After running the above code, the heatmap will be displayed in a new window (Fig. 16), and the matrix of values will be written to the output files folder created in the working directory.
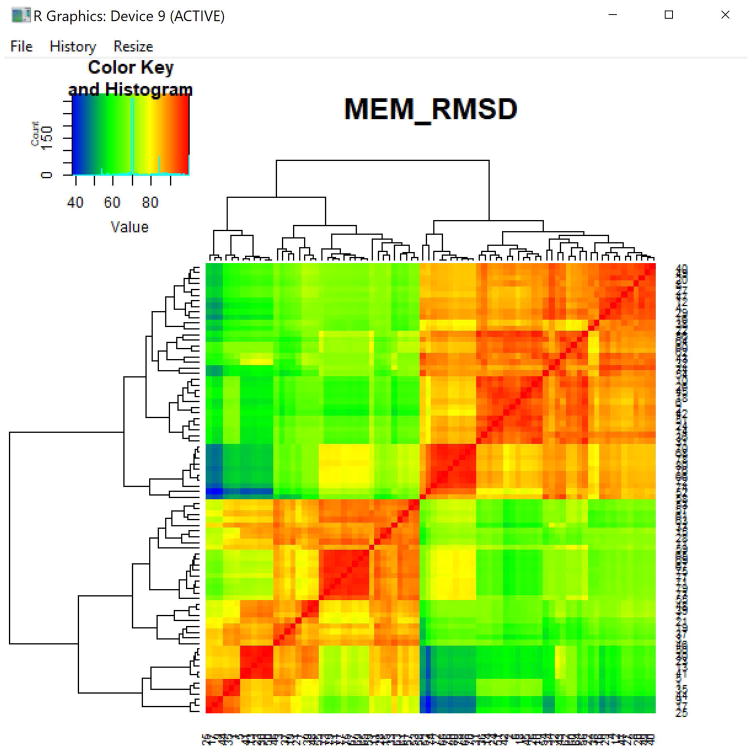
Figure 16. MEM RMSD heatmap from population files.
Percent maximum RMSD between CD4+ T cells and B cells across multiple experiments, tissues, and platforms. Each pair of populations was compared using their common markers for the RMSD calculation. The row and column numbers correspond to the file order in the folder.
Commentary
Background
Quantifying the features that define populations of cells or other data groups has traditionally involved identifying the most highly expressed or strongest features of the group or identifying the most variable features across groups (e.g. fold change analysis, principal component analysis, z-score, variance analysis). However, variance-based analyses do not account for feature magnitudes, and magnitude analyses fail to account for both inter- and intra-population feature heterogeneity. These tools therefore may indicate that a feature is important to a group’s identity because it has a high magnitude even if the magnitude is also high across all populations in the analysis (e.g. CD45 on all immune cells) or if the feature is highly variable within the population (e.g. IgM on B cells).
MEM improves upon traditional statistical approaches by accounting for magnitude differences as well as feature heterogeneity in order to quantify population-specific feature enrichment in the context of other populations. The equation allows for quantification of negative enrichment, which occurs when a feature is specifically lacking on a population compared to other cells in the dataset (e.g. hematopoietic stem cells lacking CD45 relative to other immune cells in a bone marrow sample). Negatively enriched features would be overlooked or minimized in traditional analyses that look for highly expressed features. MEM also produces automated population labeling, thereby providing an unbiased, alternative method of cell population classification compared to the traditional approach of expert-guided manual interpretation.
The MEM algorithm was originally developed for use with cell clusters derived from single-cell data, However, the equation can be applied a wide variety of data types and systems. The MEM approach quantifies feature enrichment given feature measurements for all individuals across multiple clusters, and thus holds promise for application in virtually every scientific field.
Critical Parameters
Software
Be sure you have installed the most recent versions of R and RStudio.
To run a line of R code, place your cursor within the line of code and hit CTRL + ENTER or CTRL + r.
A small stop sign appears in the top right corner of the Console while a command is executing.
Lines of R code that start with a # symbol are comments, meaning that they will not be executed as commands.
Run R as an administrator to ensure that all installations and updates can run under administrator privilege.
-
For creating a path to the MEM files in Windows:
Path format: “C:/Users/You/”
To find the path of a specific folder: Shift + Click on a folder and hit “copy as path.” You can copy this path into the R console. Check to make sure the slashes are all forward slashes (“/”) and not back slashes (“\”).
-
For creating a path to the MEM files on Mac:
Path format: "/Users/You/Documents”
To find the path: Control + Click on a folder. In the popup window under General is where you will see the path to the file.
Clustering of data
-
FlowSOM code:
Use the argument toTransform to apply a scale transformation to all of the columns used for clustering.
Grid size dimensions 10 x 10 will produce 100 nodes; if you want less granularity (fewer nodes), decrease the grid size.
The nClus argument indicates the total number of clusters to be output after meta-clustering.
If you have created many FlowSOM clusters, it may be helpful to use a script to automatically draw gates for you. If you are working in Cytobank, you can obtain Javascript code to do this by creating a support ticket.
Troubleshooting
R/Rstudio
If you copy and paste text into R and get an error stating that you have entered unexpected input, try retyping the code into R instead of pasting it in. Some fonts do not transfer over properly via copy and paste.
Errors and warnings may occur if you have not installed or updated to the most recent version of R/Rstudio (https://www.r-project.org/) and Bioconductor (https://www.bioconductor.org/install/).
MEM
If you need additional help running MEM, a detailed R script titled “Detailed R script to install and run MEM,” can be found as part of the MEM files download from mem.vueinnovations.com. This script provides detailed guidance through each step of MEM installation, setup, and analysis.
Technical errors like antibody staining artifacts may affect MEM results. Standard quality control measures should always be taken prior to analysis.
FlowSOM
When inputting a CSV file, view the CSV file prior to analysis in a program like Microsoft Excel. Often the column names will be shifted incorrectly and must be manually shifted back.
The FlowSOM code is sensitive to exact spacing. If you get an error, check that all spacing and capitalization matches the code described above or the code in the original FlowSOM publication (Van Gassen et al., 2015).
Interpreting the Results
MEM outputs the analysis results as text MEM labels (or enrichment scores), as heat maps indicating median, IQR, and MEM values for each population, and as matrices containing the values represented by the heatmaps. The MEM labels are saved to the file in the output files folder called “[date-time] enrichment score rownames.txt.” The matrices of values are saved with the same date-time format. Note that if you have run an RMSD analysis and indicated that files should be output using output.files = TRUE in the RMSD function, the MEM_RMSD matrix of values will also be saved in the output files folder.
The MEM labels are formatted as a list of marker names each with a value indicating positive (+) or negative (−) enrichment (Table 1). A value of “+0” indicates no enrichment of that feature on the population relative to the reference population. Positive enrichment indicates that the feature was expressed specifically on the population, while negative enrichment means that the marker was specifically lacking on the population relative to the reference population.
Table 1.
MEM labels for 7 canonical PBMC populations
| MEM Label | Expert Label | |
|---|---|---|
| 1 | CD4+4 CD3+4 CD44+2 CD61+1 CD45+1 CD33+1 CD19+0 CD117+0 CD34+0 CD123+0 CD45RA+0 CD10+0 CD14+0 CD15+0 CD25+0 IgM+0 • CD16-9 CD8-7 CD11c-5 HLADR-5 CD69-3 CD11b-2 CD20-2 CD38-1 CD56-1 | CD4+ T cells |
| 2 | CD8+7 CD3+3 CD69+2 CD20+1 CD45RA+1 HLADR+1 CD19+0 CD117+0 CD11b+0 CD34+0 CD61+0 CD123+0 CD45+0 CD10+0 CD33+0 CD11c+0 CD14+0 CD15+0 CD16+0 CD25+0 IgM+0 CD56+0 • CD4-10 CD38-2 CD44-1 | CD8+ T cells |
| 3 | CD11c+4 HLADR+4 CD123+2 CD16+2 CD45RA+1 CD33+1 CD44+1 CD19+0 CD117+0 CD20+0 CD34+0 CD61+0 CD45+0 CD10+0 CD14+0 CD69+0 CD15+0 CD38+0 CD25+0 IgM+0 CD56+0 • CD3-8 CD4-3 CD8-3 CD11b-1 | Dendritic cells |
| 4 | HLADR+4 CD19+3 CD20+3 CD45RA+1 CD44+1 CD117+0 CD34+0 CD61+0 CD123+0 CD45+0 CD10+0 CD33+0 CD11c+0 CD14+0 CD69+0 CD15+0 CD16+0 CD38+0 CD25+0 IgM+0 CD56+0 • CD4-9 CD3-8 CD8-3 CD11b-1 | IgM- B cells |
| 5 | HLADR+5 IgM+4 CD19+3 CD20+3 CD117+0 CD34+0 CD61+0 CD123+0 CD45RA+0 CD45+0 CD10+0 CD33+0 CD11c+0 CD14+0 CD15+0 CD16+0 CD38+0 CD25+0 CD56+0 • CD4-10 CD3-8 CD8-4 CD11b-1 CD69-1 CD44-1 | IgM+ B cells |
| 6 | CD33+5 CD11c+5 CD61+4 CD14+4 CD11b+3 CD44+3 HLADR+3 CD38+1 CD19+0 CD117+0 CD20+0 CD34+0 CD123+0 CD45RA+0 CD45+0 CD10+0 CD69+0 CD15+0 CD16+0 CD25+0 IgM+0 CD56+0 • CD3-7 CD4-5 CD8-3 | Monocytes |
| 7 | CD16+6 CD11b+1 CD45RA+1 CD11c+1 CD38+1 HLADR+1 CD56+1 CD19+0 CD117+0 CD8+0 CD20+0 CD34+0 CD61+0 CD123+0 CD10+0 CD33+0 CD14+0 CD69+0 CD15+0 CD25+0 IgM+0 • CD4-10 CD3-6 CD44-2 CD45-1 | Natural Killer (NK) cells |
The heatmap color scale for the median values is dataset-dependent and spans the range from 0 to the maximum median value in the dataset. The IQR heatmap color scale matches the median heatmap scale range, and the MEM heatmap color scale always ranges from −10 to +10. The corresponding matrices that are written to text files in the output files folder contain the exact values used to build the heatmaps and are arranged in the same order as the heatmaps. For example, if you indicated cluster.MEM=”both” when running build.heatmaps(), the populations and markers in the MEM matrix file will be in the same order as the MEM heatmap.
MEM labels are meant to be both human and machine readable. For publication, MEM labels can be reformatted for readability by making the MEM value a superscript of the marker name (e.g. CD4+10) (Diggins et al., 2017). It may also be useful to publish the labels as text strings such as those shown in Table 1 in order to facilitate downstream analysis and comparison of scores by other researchers using machine learning tools.
Time Considerations
The runtime for a MEM analysis depends on the number of cells or events in the file(s), the number of populations, and the number of features in the dataset. Runtime also depends on the machine being used for the analysis. In general, MEM analysis of a small dataset (<100K cells and <20 clusters) will run in under one minute. Analyzing larger files or using less powerful machines may increase the runtime to 15 minutes or more.
FlowSOM runs quickly (<1 minute) even for large data sets. Organization of files for analysis and overlaying flowSOM clusters on the viSNE plot can be time consuming (up to 2 hours combined depending on level of experience).
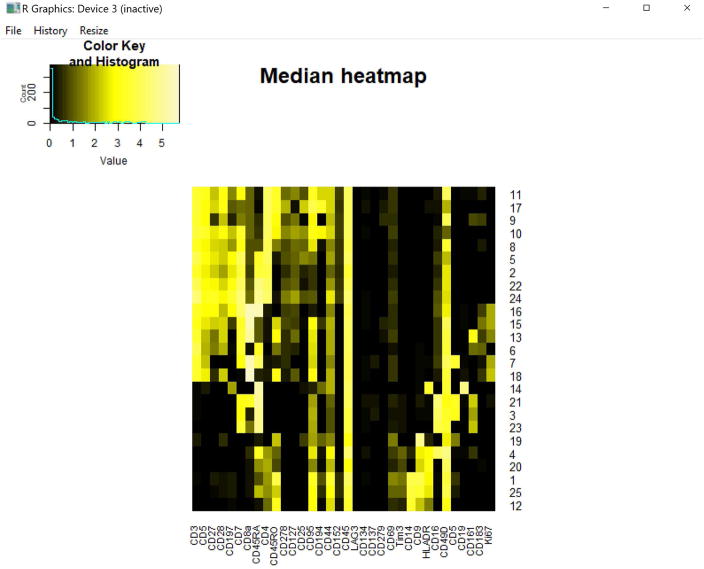
Figure 10. Medians heatmap of 25 clusters from melanoma patient blood.
Transformed median expression levels for the 25 clusters of melanoma patient blood cells. Rows and columns are order the same as the MEM heatmap (Fig. 12) because cluster.medians=”none”.
Significance Statement.
Identifying distinct clusters or groups from high dimensional data has become increasingly automated with clustering and dimensionality reduction tools. However, classifying and labeling those groups is still left to expert interpretation, which can be both time consuming and subjective. Marker enrichment modeling (MEM) automates this process by producing a quantitative label for a cluster indicating which features are enriched on that cluster relative to others in the sample or dataset. MEM quantifies both positive and negative feature enrichment, i.e. which features are specifically expressed and specifically lacking on a population, on a scale from −10 to +10. These labels can be interpreted by experts or read by machines to facilitate machine learning and automated classification approaches to cell subset identification and characterization.
Acknowledgments
The authors thank Allison R. Greenplate for assistance with datasets and helpful discussions. Study and researchers were supported by NIH/NCI R00 CA143231 (J.M.I.), The Vanderbilt-Ingram Cancer Center (VICC, P30 CA68485), and the Vanderbilt Medical Scholars Program (J.S.G.).
Footnotes
Conflicts of Interest
The authors declare no conflicts of interest.
References
- Aghaeepour N, Finak G, Flow CAPC, Consortium D, Hoos H, Mosmann TR, … Scheuermann RH. Critical assessment of automated flow cytometry data analysis techniques. Nat Methods. 2013;10(3):228–238. doi: 10.1038/nmeth.2365. [DOI] [PMC free article] [PubMed] [Google Scholar]
- Aghaeepour N, Ganio EA, McIlwain D, Tsai AS, Tingle M, Van Gassen S, … Gaudilliere B. An immune clock of human pregnancy. Sci Immunol. 2017;2(15) doi: 10.1126/sciimmunol.aan2946. [DOI] [PMC free article] [PubMed] [Google Scholar]
- Amir el AD, Davis KL, Tadmor MD, Simonds EF, Levine JH, Bendall SC, … Pe’er D. viSNE enables visualization of high dimensional single-cell data and reveals phenotypic heterogeneity of leukemia. Nat Biotechnol. 2013;31(6):545–552. doi: 10.1038/nbt.2594. [DOI] [PMC free article] [PubMed] [Google Scholar]
- Ellis BPH, Hahne F, Le Meur N, Gopalakrishnan N, Spidlen J, Jiang M. flowCore: Basic structures for flow cytometry data. R package version 1.42.2 2017 [Google Scholar]
- Bandura DR, Baranov VI, Ornatsky OI, Antonov A, Kinach R, Lou X, … Tanner SD. Mass cytometry: technique for real time single cell multitarget immunoassay based on inductively coupled plasma time-of-flight mass spectrometry. Anal Chem. 2009;81(16):6813–6822. doi: 10.1021/ac901049w. [DOI] [PubMed] [Google Scholar]
- Bruggner RV, Bodenmiller B, Dill DL, Tibshirani RJ, Nolan GP. Automated identification of stratifying signatures in cellular subpopulations. Proc Natl Acad Sci U S A. 2014;111(26):E2770–2777. doi: 10.1073/pnas.1408792111. [DOI] [PMC free article] [PubMed] [Google Scholar]
- Cavrois M, Banerjee T, Mukherjee G, Raman N, Hussien R, Rodriguez BA, … Roan NR. Mass Cytometric Analysis of HIV Entry, Replication, and Remodeling in Tissue CD4+ T Cells. Cell Rep. 2017;20(4):984–998. doi: 10.1016/j.celrep.2017.06.087. [DOI] [PMC free article] [PubMed] [Google Scholar]
- Diggins KE, Ferrell PB, Jr, Irish JM. Methods for discovery and characterization of cell subsets in high dimensional mass cytometry data. Methods. 2015;82:55–63. doi: 10.1016/j.ymeth.2015.05.008. [DOI] [PMC free article] [PubMed] [Google Scholar]
- Diggins KE, Greenplate AR, Leelatian N, Wogsland CE, Irish JM. Characterizing cell subsets using marker enrichment modeling. Nat Methods. 2017;14(3):275–278. doi: 10.1038/nmeth.4149. [DOI] [PMC free article] [PubMed] [Google Scholar]
- DiGiuseppe JA, Cardinali JL, Rezuke WN, Pe’er D. PhenoGraph and viSNE facilitate the identification of abnormal T-cell populations in routine clinical flow cytometric data. Cytometry B Clin Cytom. 2017 doi: 10.1002/cyto.b.21588. [DOI] [PMC free article] [PubMed] [Google Scholar]
- Finck R, Simonds EF, Jager A, Krishnaswamy S, Sachs K, Fantl W, … Bendall SC. Normalization of mass cytometry data with bead standards. Cytometry A. 2013;83(5):483–494. doi: 10.1002/cyto.a.22271. [DOI] [PMC free article] [PubMed] [Google Scholar]
- Greenplate AR, Johnson DB, Roussel M, Savona MR, Sosman JA, Puzanov I, … Irish JM. Myelodysplastic Syndrome Revealed by Systems Immunology in a Melanoma Patient Undergoing Anti-PD-1 Therapy. Cancer Immunol Res. 2016a;4(6):474–480. doi: 10.1158/2326-6066.CIR-15-0213. [DOI] [PMC free article] [PubMed] [Google Scholar]
- Greenplate AR, Johnson DB, Roussel M, Savona MR, Sosman JA, Puzanov I, … Irish JM. Myelodysplastic Syndrome Revealed by Systems Immunology in a Melanoma Patient Undergoing Anti-PD-1 Therapy. Cancer Immunol Res. 2016b;4(6):474–480. doi: 10.1158/2326-6066.CIR-15-0213. [DOI] [PMC free article] [PubMed] [Google Scholar]
- Kotecha N, Krutzik PO, Irish JM. In: Current protocols in cytometry/editorial board. Unit10. Paul Robinson J, et al., editors; Chapter 10. 2010. p. 17. [DOI] [PMC free article] [PubMed] [Google Scholar]
- Lakshmikanth T, Olin A, Chen Y, Mikes J, Fredlund E, Remberger M, … Brodin P. Mass Cytometry and Topological Data Analysis Reveal Immune Parameters Associated with Complications after Allogeneic Stem Cell Transplantation. Cell Rep. 2017;20(9):2238–2250. doi: 10.1016/j.celrep.2017.08.021. [DOI] [PubMed] [Google Scholar]
- Leelatian N, Diggins KE, Irish JM. Characterizing Phenotypes and Signaling Networks of Single Human Cells by Mass Cytometry. Methods Mol Biol. 2015;1346:99–113. doi: 10.1007/978-1-4939-2987-0_8. [DOI] [PMC free article] [PubMed] [Google Scholar]
- Levine JH, Simonds EF, Bendall SC, Davis KL, Amir el AD, Tadmor MD, … Nolan GP. Data-Driven Phenotypic Dissection of AML Reveals Progenitor-like Cells that Correlate with Prognosis. Cell. 2015;162(1):184–197. doi: 10.1016/j.cell.2015.05.047. [DOI] [PMC free article] [PubMed] [Google Scholar]
- Lun ATL, Richard AC, Marioni JC. Testing for differential abundance in mass cytometry data. Nat Methods. 2017;14(7):707–709. doi: 10.1038/nmeth.4295. [DOI] [PMC free article] [PubMed] [Google Scholar]
- Newell EW, Cheng Y. Mass cytometry: blessed with the curse of dimensionality. Nat Immunol. 2016;17(8):890–895. doi: 10.1038/ni.3485. [DOI] [PubMed] [Google Scholar]
- Saeys Y, Gassen SV, Lambrecht BN. Computational flow cytometry: helping to make sense of high-dimensional immunology data. Nat Rev Immunol. 2016;16(7):449–462. doi: 10.1038/nri.2016.56. [DOI] [PubMed] [Google Scholar]
- Seshadri A, Brat GA, Yorkgitis BK, Keegan J, Dolan J, Salim A, … Lederer JA. Phenotyping the Immune Response to Trauma: A Multiparametric Systems Immunology Approach. Crit Care Med. 2017;45(9):1523–1530. doi: 10.1097/CCM.0000000000002577. [DOI] [PMC free article] [PubMed] [Google Scholar]
- Shekhar K, Brodin P, Davis MM, Chakraborty AK. Automatic Classification of Cellular Expression by Nonlinear Stochastic Embedding (ACCENSE) Proc Natl Acad Sci U S A. 2014;111(1):202–207. doi: 10.1073/pnas.1321405111. [DOI] [PMC free article] [PubMed] [Google Scholar]
- Spitzer MH, Nolan GP. Mass Cytometry: Single Cells, Many Features. Cell. 2016;165(4):780–791. doi: 10.1016/j.cell.2016.04.019. [DOI] [PMC free article] [PubMed] [Google Scholar]
- Van Gassen SCBaSY. FlowSOM: Using self-organizing maps for visualization and interpretation of cytometry data. 2017 doi: 10.1002/cyto.a.22625. http://www.r-project.org http://dambi.ugent.be. [DOI] [PubMed]
- Wang B, Zhu J, Pierson E, Ramazzotti D, Batzoglou S. Visualization and analysis of single-cell RNA-seq data by kernel-based similarity learning. Nat Methods. 2017;14(4):414–416. doi: 10.1038/nmeth.4207. [DOI] [PubMed] [Google Scholar]
- Weber LM, Robinson MD. Comparison of clustering methods for high-dimensional single-cell flow and mass cytometry data. Cytometry A. 2016;89(12):1084–1096. doi: 10.1002/cyto.a.23030. [DOI] [PubMed] [Google Scholar]
- Wei SC, Levine JH, Cogdill AP, Zhao Y, Anang NAS, Andrews MC, … Allison JP. Distinct Cellular Mechanisms Underlie Anti-CTLA-4 and Anti-PD-1 Checkpoint Blockade. Cell. 2017 doi: 10.1016/j.cell.2017.07.024. [DOI] [PMC free article] [PubMed] [Google Scholar]


