Abstract
Internet of Things (IoT) provides a generic infrastructure for different applications to integrate information communication techniques with physical components to achieve automatic data collection, transmission, exchange, and computation. The smart grid, as one of typical applications supported by IoT, denoted as a re-engineering and a modernization of the traditional power grid, aims to provide reliable, secure, and efficient energy transmission and distribution to consumers. How to effectively integrate distributed (renewable) energy resources and storage devices to satisfy the energy service requirements of users, while minimizing the power generation and transmission cost, remains a highly pressing challenge in the smart grid. To address this challenge and assess the effectiveness of integrating distributed energy resources and storage devices, in this paper we develop a theoretical framework to model and analyze three types of power grid systems: the power grid with only bulk energy generators, the power grid with distributed energy resources, and the power grid with both distributed energy resources and storage devices. Based on the metrics of the power cumulative cost and the service reliability to users, we formally model and analyze the impact of integrating distributed energy resources and storage devices in the power grid. We also use the concept of network calculus, which has been traditionally used for carrying out traffic engineering in computer networks, to derive the bounds of both power supply and user demand to achieve a high service reliability to users. Through an extensive performance evaluation, our data shows that integrating distributed energy resources conjointly with energy storage devices can reduce generation costs, smooth the curve of bulk power generation over time, reduce bulk power generation and power distribution losses, and provide a sustainable service reliability to users in the power grid1.
Index Terms: Smart grid, distributed energy resources, energy storage, performance evaluation
I. Introduction
Internet of Things (IoT) is an integrated and critical infrastructure that incorporates information communication techniques with physical devices to automatically collect and exchange data, which can support different applications/services, such as smart grid, smart transportation system, smart cities, and others [2], [3], [4], [5]. As a typical application/service by IoT, the smart grid has a goal of providing efficient, reliable, and cost-effective electricity power service to users via the integration of modern information and communication technologies in the traditional power grid [6]. In the smart grid, the two-way communication between utility providers and users is enabled. On one hand, users can manage their utility devices based on the dynamic price, and deploy various distributed renewable energy resources locally to not only provide energy to themselves, but also to the grid. On the other hand, utility providers can collect information to determine the state of the power grid, and support the efficient operation of power grid, via deployed meters and sensors responding to changes in energy demands, supplies, and costs [7].
In 2012, a massive power outage swept India, leaving more than half the country without power, and affecting over 600 million people [8]. This failure was caused by three regional power grids overdrawing power from the main grid in order to meet heavy demand [9]. Since the structure of traditional power generation is centralized, the increasing demand of power usage on the grid poses significant concerns for the reliability of the power supply. Moreover, traditional power generation highly depends on fossil fuels as the main energy resources, which are not efficient or renewable. The serious depletion of fossil-fuel reserves is unsustainable and badly pollutes our environment. In addition, to avoid affecting the populace, traditional power generation plants are usually located far away from residential areas, which can incur a high power loss during the transmission and distribution of electrical power. Therefore, reliable, sustainable, and cost-effective energy service is a critical problem confronting the power grid. To address these issues, distributed energy resources, as sustainable and cost-effective resources, are urgently needed in the power grid. Distributed energy resources, including solar power, wind power, geothermal power, hydrothermal power, and others [10], as clean energy resources, can significantly reduce greenhouse gas emissions. In addition, integrating distributed energy resources into the power grid can provide more power generation and increase power supply reliability. Also, the distributed energy resources that can be located nearby the power consumers can reduce power transmission and distribution losses, and the power generation cost of the distributed energy resources is low, making them cost-effective.
Nonetheless, distributed energy resources are time-dependent, weather-dependent, and have a number of uncertainties. How to provide an accurate prediction of the amount of power to be produced by distributed energy resources remains an open issue. As such, integrating distributed energy resources into the power grid needs to be carefully addressed. Thus, there is an urgent need for the development of modeling and simulation techniques aimed at understanding and quantifying the impacts of the massive integration of distributed energy resources into the power grid, with respect to efficiency and operational reliability of the power grid, as well as the economic impacts [11].
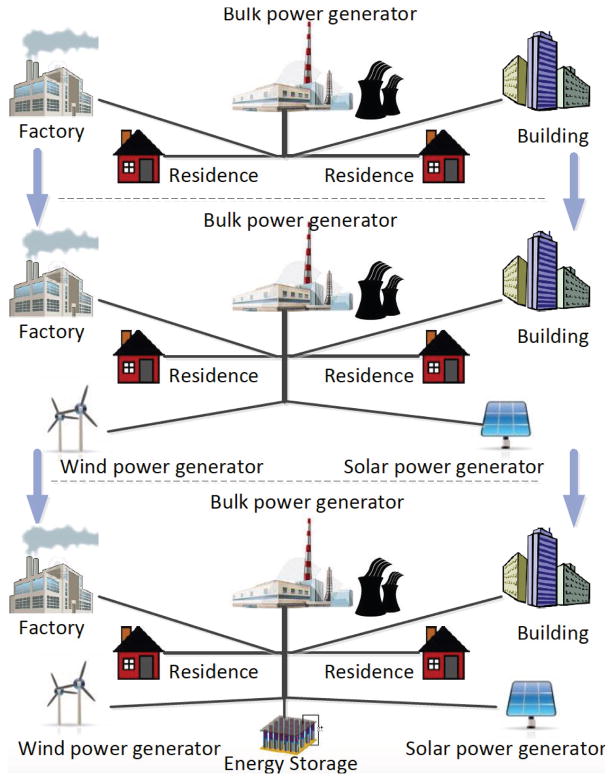
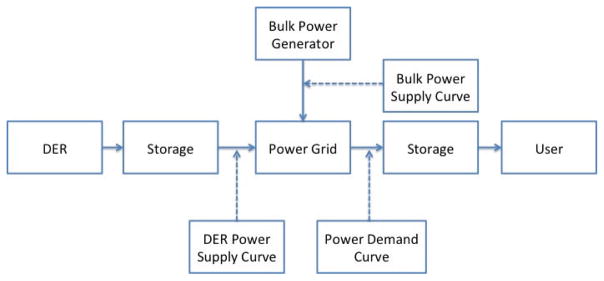
To this end, in this paper we investigate the effectiveness of integrating distributed energy resources and storage devices in the power grid. To be specific, we first briefly introduce three types of power grid systems: the traditional bulk power grid, the power grid integrated with distributed energy resources, and the power grid integrated with both distributed energy resources and storage devices. Figure 1 illustrates an example of the modernization process of the power grid. As we can see from the figure, the distributed renewable energy resources (wind, solar, etc.) can be integrated into the power grid, and energy storage devices can be used as buffering pools to reduce and mitigate the fluctuation of power transmission and distribution. Thus, integrating distributed energy resources and storage devices to effectively transmit and distribute electric power is essential to meet users’ energy demand in the smart grid. We then model and analyze the effectiveness of integrating distributed energy resources and energy storage devices in the power grid based on the defined metrics: power cumulative cost and user service reliability. The power cumulative cost is defined as the cumulative cost of the power generation and distribution in a time interval, and the user service reliability is defined as the probability that the amount of power requested by users can be satisfied. In order to achieve a high service reliability to users, we use the concept of network calculus [12] to derive both the power supply curve and the user demand curve.
Fig. 1.
An Example of Power Grid Modernization
Based on the California Independent System Operator Corporation (ISO) data [13], we conduct a simulation study using Matlab2. Our evaluation results confirm that the integration of distributed energy resources can increase the user service reliability to meet customers’ demands and reduce the cost for electricity power generation and distribution, while the integration of energy storage devices can smooth the bulk power generation, mitigate the peak load, and reduce uncertainties raised by the integration of distributed energy resources. For example, in our experimental settings, we can see that the cost in the generation and distribution process can be reduced by $40, 000 after integrating distributed energy resources. With the integration of a storage device of 500MW capacity, the bulk power generation can be stabilized at 2200MW, showing that the storage device is capable of reducing the disturbance from uncertainties and intermittencies of distributed energy resources.
The remainder of the paper is organized as follows: In Section II, we introduce the three power grid systems. In Section III, we define two metrics: power cumulative cost and user service reliability. In Section IV, we carry out the modeling and analysis of three power grid systems based on the defined metrics. In Section V, we provide the experimental results to show the effectiveness of integrating distributed energy resources and energy storage devices in the grid. Then, we discuss how our proposed framework is applicable for a large-scale grid in Section VI. We review the related work in Section VII and conclude the paper in Section VIII, respectively.
II. Power Grid Systems
In this section, we first give an overview of the smart grid. Then, we introduce three types of power grid systems: (i) traditional bulk power grid, (ii) power grid integrated with distributed energy resources, and (iii) power grid integrated with both distributed energy resources and storage devices, respectively.
A. Overview
The smart grid is the integration of computing and information technology into the power grid, in which key components in the grid are interconnected through bidirectional communication networks. In the smart grid, users are connected to the grid through both communication and energy transmission links. With the support of advanced metering infrastructure, the two-way interactions between users and utility providers can be supported. The amount of power demand from users can be measured in real time, helping the utility provider to control the magnitude of power generation required to balance demand and supply, ultimately reducing the cost for power generation and optimizing power production. On the utility provider side, the dynamic price can be generated based on the information associated with the demand and supply, and can be fed back to users, who can then adjust their power use by initiating or curtailing use of various utilities based on the time of use and current electricity price.
In order to reduce greenhouse gas emission, distributed energy resources are expected to be widely deployed and used in the smart grid. By doing so, the power grid will not solely rely on fossil fuel (denoted as the traditional energy resources), which are more expensive and not environmentally friendly. However, the question of how to effectively integrate distributed energy resources (wind energy, solar energy, etc.) to the power grid with a controllable impact on the performance of the power grid remains a crucial and unresolved issue in the development of the smart grid. In the following, we introduce three types of power grid systems. Notice that, all notations used in the paper are defined in Table I.
TABLE I.
Notation
| t: | Index of time interval. |
| G: | The set of power generation resources/generators. |
| D: | The set of users. |
| S: | The set of storage devices. |
| Rij : | Resistance of the line lij. |
| ρij : | Resistivity of the line lij. |
| λ: | Power transformation loss ratio of the storage device. |
| sij : | Cross section of the line lij. |
| Iij (t): | Electric current of the line lij. |
| Uij (t): | Electric voltage of the line lij. |
| lij : | The line distance between generator i and user j. |
| Lij : | The load capacity of line lij. |
| Gi(t): | Power generated from generator i. |
| GT (t): | Total power generation. |
| Gd(t): | Total distributed energy resources power generation. |
| Dj (t): | Predicted power demand from user j. |
| DT (t): | Total predicted power demand. |
| μj (t): | The average of predicted demand from user i at time interval t. |
| : | The variance of predicted demand from user i at time interval t. |
| Gij (t): | The amount of power supply from generator i to user j. |
| Gik(t): | The amount of power supply from generator i to storage device k. |
| Gkj(t): | The amount of power supply from storage k to user j. |
| : | Minimum generated power of generator i. |
| : | Maximum generated power of generator i. |
| : | The amount of power loss in the power distribution from generator i to user j. |
| : | The amount of power loss in the power distribution from generator i to storage device k. |
| : | Total power loss in the power distribution process. |
| Ci: | Unit cost of power generation at generator i. |
| C′: | Unit cost of power loss. |
| : | Total power loss cost of generator i. |
| R(t): | Cumulative function. |
| R1(t): | Cumulative power generation function. |
| R2(t): | Cumulative power consumption function. |
| G(t): | Cumulative bulk power generation. |
| D(t): | Cumulative distributed power generation. |
| Pd: | Constant supply rate of distributed energy resources. |
| Pu: | Constant demand rate of users. |
| A(t): | Supply curve function of distributed energy resources. |
| B(t): | Demand curve function of users. |
| C(t): | Supply curve function of bulk power generation. |
| SR(t): | The User Service Reliability at time t. |
| DR(t): | The Successful Demand Ratio at time t. |
| RR(t): | The Effective Generation Ratio at time t. |
B. System I: Traditional Bulk Power Grid
In the traditional bulk power grid, the energy generation and distribution processes are simple. Users can only obtain the power supply from the bulk power generator. Because of numerous uncertainties associated with the amount of power demand required by users at any given time, the service reliability in the traditional bulk power grid is ensured through over-provisioning of power and excess capacity. That is, power generators should produce more power than what users demand.
Nonetheless, the ever-increasing demand on energy use has led to a serious depletion of fossil-fuel reserves. Thus, it is likely that the power grid will fall short of meeting future demand. The traditional bulk power grid is an inefficient and environmentally harmful system. For example, the traditional bulk power generation accounts for 25.9 % of global carbon (CO2) emissions, and the specific emissions [14] from electricity use will grow faster than those from all other sectors projected through 2050 [15]. Conclusively, the traditional power grid is becoming more fragile, less reliable, and less efficient.
C. System II: Power Grid With Distributed Energy Resources
Distributed energy resources, including wind turbines and solar plants, are intermittent by nature and therefore unpredictable. For example, a rapid or unpredicted change in weather (e.g., the variability in wind speed) could cause an error in power generation forecasting and seriously limit the capacity of distributed energy resources, imposing a negative impact on the grid. Despite these uncertainties, the operator of the power grid must balance the amount of power demanded by users with the amount of available power supplied by various generation resources, in real time.
To effectively integrate the distributed energy resources, the operator of power grid shall estimate the status of distributed energy resources in order to determine whether the distributed energy resources should be connected to the grid. When a new distributed energy resource is integrated into the grid, the operator of the power system can collect real-time data associated with that resource in the current time interval, and use techniques such as data mining and machine learning [16] to predict the next time interval power supply. By doing so, the operator can estimate the reduced power loss cost , and the declined reliability , after integrating distributed energy resources. The benefit of integrating the distributed energy resources Bi(t) can be represented as
| (1) |
where ν1 and ν2 are weighted coefficients. For different time intervals, the weighted coefficients will be different. For example, in some intervals that requires a high reliability in the grid, the operator will care more about the power loss cost, and ν1 will increase more to adjust the benefit of integrating the distributed energy resources. Only when Bi(t) > 0, the operator will allow the distributed energy resource to be integrated to the grid.
Nonetheless, the intermittent nature of renewable energy resources, and the mismatch of generated power with the peak load conditions, present pressing challenges to the effective integration of renewable energy resources into the grid. Explicitly, renewable energy resources (wind turbines, solar plants, etc.) are intermittent by nature and unpredictable due to the random fluctuation, which is mostly beyond human control. For example, the amount of demanded power is high during the day and the summer, while the wind power is most likely high in off-peak hours due to the high wind speed during the night and throughout winter. Thus, the integration of distributed energy resources into the power grid can pose an adverse impact and reduce the user service reliability.
D. System III: Power Grid With Both Distributed Energy Resources and Energy Storage Devices
To smooth the amount of bulk power generation, and mitigate the intermittency and uncertainties of distributed energy resources, energy storage devices should be integrated into the grid. Generally speaking, standing as a buffer between users and power generators, energy storage devices can store the power during the time when the amount of generated power from bulk power generators exceeds the amount of power consumed. The stored power can then be used at the time when energy demand exceeds the current generated power. Otherwise, in the traditional bulk power grid, the amount of power generation needs to be drastically scaled up and down to meet current demand.
With the integration of the energy storage devices into the power grid, the bulk power generation can be maintained at a constant level. Also, the energy storage can push the power to the grid, or pull the power from the grid, so that the power fluctuations and uncertainties of power generators can be mitigated to some extent. For example, the energy storage devices (e.g., battery and plug-in hybrid electric vehicles (PHEVs)) can supply and store power over time so that the disturbance raised by peak and non-peak power use is mitigated, and the power generation cost can be reduced.
III. Cost and Reliability in Power Systems
To measure the impact of integrating distributed energy resources and storage on the effectiveness of the operation in the power grid, we define two metrics: power cumulative cost and user service reliability.
A. Power Cumulative Cost
Definition 1
Power Cumulative Cost is defined as the cumulative cost of the power generation and distribution in a time interval.
The power generation cost can be computed by the unit cost of power generation (denoted as Ci) and the quantity of power that generators can supply (denoted as Gij(t)). The power distribution cost can be computed by the unit cost of the power loss (denoted as C′) and the quantity of power loss in the power distribution process (denoted as ). Notice that i and j are denoted as the identifier of the power generator and user, respectively.
When a current flows through the power line, some of the power will be lost, converted into heat as a result of the transmission resistance. This power loss [17] can be represented by
| (2) |
where Iij is electric current of the line lij and Rij is resistance of the line lij.
Also, for the resistance of the line lij, we have
| (3) |
where ρij is resistivity, lij is the line distance between generator i and user j, and sij is cross section of the line. The quantity of power supply Gij(t) [18] can be represented as
| (4) |
where Iij(t) is the electric current of line lij(t) and Uij(t) is the electric voltage of line lij.
Based on Equation (2), we can infer that there are two ways to reduce the power loss: reducing the power line resistance, and reducing the power line current. To reduce the resistance of a power line, from Equation (3), we know that we have two options: increasing the line cross-sectional area, and reducing the transmission distance. Because increasing the line cross-sectional area is too costly, we assume all lines cross-sectional area is a constant value. Thus, the transmission distance is the key factor to determine the power line resistance. To reduce the current flow, based on Equation (4), we need to increase the voltage (this is the reason for transmitting power via high voltage). Without loss of generality, we consider that all the power lines have the same high voltage and we define a parameter k to represent . Then, the power loss can be denoted as
| (5) |
where k is , lij is the line distance between generator i and user j, ρ is the resistivity, S is the line cross section, Gij(t) is the power distribution from generator i to user j, Iij(t) is the electric current of the line lij, Uij(t) is the electric voltage of the line lij, G is the set of generators, and D is the set of users.
B. The User Service Reliability
Definition 2
User Service Reliability is defined as the probability that the quantity of requested power from users can be satisfied, which can be represented as SR(t).
From the cumulative power cost analysis discussed in Section III-A, we know that the integration of distributed energy resources can reduce the cumulative power cost. Nonetheless, the distributed energy resources, such as wind turbines and solar plants, are intermittent by nature and therefore unpredictable. The amount of power generated varies over time and depends significantly on random factors such as weather. When the distributed energy resources are integrated into the power grid, they can result in power frequency deviation, voltage fluctuation, and lighting. The intermittency and increase of redundant pitch peak capacity can cause instability and uncontrollable behavior in the power grid. Thus, it is critical to investigate the impact of the user service reliability when distributed energy resources are integrated into the grid. Here, we consider that the user service reliability can be affected by two factors: (i) user demand, and (ii) power generation by distributed energy resources. In the following, we give Definitions 3 and 4 to classify the effects of these two factors.
Definition 3
Successful Demand Ratio is defined as the probability that, with a power supply as the threshold, users can be provided enough power to satisfy their demands in a time interval. This probability is represented as DR(t).
Definition 4
Effective Generation Ratio is defined as the probability that a quantity of power supply can be provided by the distributed energy resources in a time interval, represented as RR(t).
Based on these two definitions, the user service reliability SR can be denoted as
| (6) |
IV. Modeling and Analysis
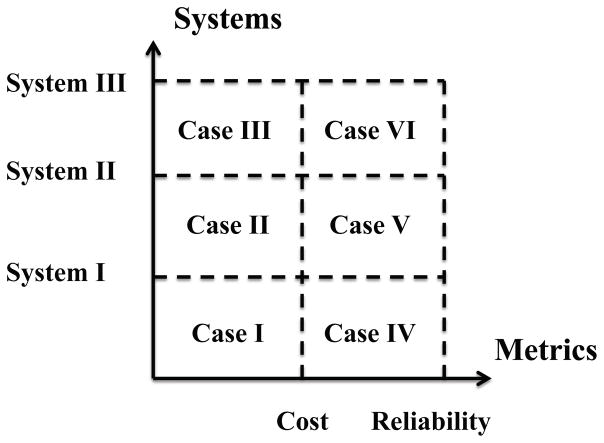
Based on the systems we introduced in Section II and the metrics we defined in Section III, we now have the following six cases, as shown in Figure 2, to model and analyze the effectiveness of power systems: (i) Case I: the cost of traditional bulk power grid, (ii) Case II: the cost of the power grid with distributed energy resources, (iii) Case III: the cost of the power grid with both distributed energy resources and energy storage devices, (iv) Case IV: the reliability of the traditional bulk power grid, (v) Case V: the reliability of the power grid with distributed energy resources, and (vi) Case VI: the reliability of the power grid with both distributed energy resources and energy storage devices. In the following, we analyze the above six cases in detail.
Fig. 2.
Modeling and Analysis Cases
A. Case I
Recall that in Section II-B, in the traditional bulk power grid, we consider a number of nodes, which request power from the bulk power generation through energy transmission links. Power loss is the main issue for the energy distribution process, which can be denoted as . Hence, the power balance equation in the grid can be derived by,
| (7) |
where Gij(t) is the quantity of power that the generator i provides to user j and Dij(t) is the quantity of power that the user j receives from generator i. Then, the cumulative power cost of the traditional bulk power grid can be represented as,
| (8) |
where Ci is the unit cost of power generation at generator i, Gij(t) is the power distribution from generator i to user j, C′ is the unit cost of power loss, is the power loss associated with the power distribution from generator i to user j, is the total power loss associated with the power distribution, is the minimum power generated by generator i, and is the maximum power generated by generator i.
B. Case II
When the distributed energy resources, such as wind and solar, are distributed close to users, they can be used to replace the traditional fossil fuel resources, increase the power supply without additional greenhouse gas emissions, and significantly reduce transmission and power losses.
In order to integrate the distributed energy resources, we shall consider the following constraints: (i) The objective of energy distribution is to minimize the cumulative power cost; (ii) Each power transmission line cannot exceed its capacity, which is Gij(t) ≤ Lij ; (iii) The amount of generated power cannot exceed the capacity of the power generator, which can be denoted as ; (iv) The amount of power generated by generator i shall be equal to the sum of the amount of power distributed from generator i to different user j, which is ; (v) the user demand power shall be more than the amount of power distribution minus the amount of power loss, which is ; (vi) the power loss is mainly determined by the amount of power and its transmission distance, which is ; (vii) the total power loss is the sum of power loss from generator i to user j, which is . Based on the above constraints, we can formalize the energy distribution process as a non-linear optimization problem listed below.
| (9) |
The distributed energy resources are renewable and incur low cost. As a result, the unit cost of distributed energy power generation is less than that of bulk power generation, and the cumulative power cost is reduced. Additionally, the distributed energy resources deployed near to users can reduce the power transmission distance, resulting in the reduction of the power transmission loss of bulk power generation.
C. Case III
Recall in Section II-D, standing as a buffer between power generators and users, the energy storage device can be recharged, or discharged to the grid to balance the demand and supply. Specifically, the grid has multiple peaks and valleys such that when the amount of demanded power is less than the amount of supplied power, the storage device can pull the power from the grid. Conversely, when the amount of demanded power is more than the amount of supplied power, the storage device can push the stored power to the grid in order to absorb the peak.
Suppose that a storage device can be discharged or recharged from the power grid at a time interval t, and the storage device can be discharged or recharged with a power transformation loss ratio of λ. Then, the power discharge and recharge can be derived by
| (10) |
where Gik(t) and are the amount of power distribution and power loss from generator i to storage device k, respectively, and
| (11) |
where Gkj(t) is the amount of power supply from storage k to user j.
Notice that the quantity of the power which can be pushed to the storage device, or pulled from the storage device in the next time interval, is based on the previous status of storage device. The status of storage device can then be derived by,
| (12) |
where and is the maximum capacity of the storage device k. When the storage device is integrated into the power grid, in order to achieve the minimization of power cumulative goal, the power distribution can be derived by Equation (9), which is represented by,
| (13) |
where means that the amount of power generated by generator i shall be equal to the sum of the amount of power distributed from generator i to user j and storage device s, means that the user demanded power shall be more than the amount of power distribution minus the amount of power loss, and the total power loss , including that is the total power loss from generator i to user j and storage device k, and that is the total power transformation loss inside the storage devices.
Based on Equation (13), when and (i.e., the amount of the total power supply to users is more than the amount of the total power demanded by users), the storage device should recharge the power from the grid. When and (i.e., the amount of the total power supply to users cannot satisfy the amount of the total power demanded by users), the storage device will discharge to the grid in order to make up the lack of power in the grid. Notice that, in comparison with Case II, the power loss will increase due to the power transformation loss of the storage device. Nonetheless, in some intervals, the storage device can help to provide a backup power to the grid to make up for the lack of power generation.
D. Case IV
In traditional bulk power generation, the user service reliability of the power grid is supported by maintaining the excessive capacity, meaning that the power generators produce more power than what users demand, in order to avoid large blackouts. In our preliminary results [16], we conducted the statistical analysis using Nonparametric test [19] and Q-Q plot test [20] on real-world historical data and show that we can approximate the distribution of meter data with a Gaussian distribution. Thus, the user demand can be estimated by a Gaussian distribution in an interval of time. Based on the Gaussian distribution, the probability of the total user demand will be N[μ(t), σ2(t)], where
| (14) |
and
| (15) |
Here, μj(t) and are the mean and the variance, respectively, of predicted user i demand at the time interval t.
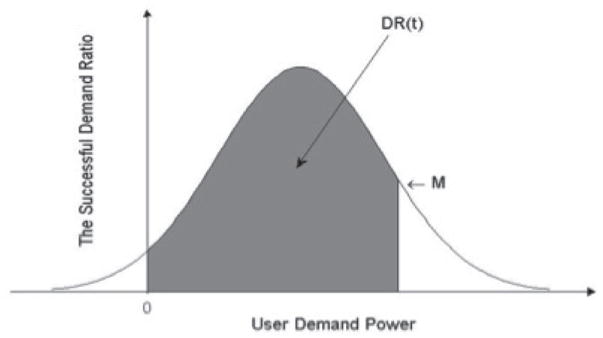
Recall that in Definition 3, we assume that the amount of power demanded by users cannot be less than 0 and the cumulative probability of power demanded by users from 0 to ∞ will be 1. Assume that the amount of the total power supplied by the traditional power generator is M, if the amount of demanded power from the user is less than M, the user can successfully obtain enough power. We assume that the amount of the total power demanded by users is D(t). The successful demand ratio, shown in Figure 3, can be formulated as
Fig. 3.
Successful Demand Ratio
| (16) |
where DT (t) is the total predicted power demand, μ(t) and σ2(t) are the mean and the variance of the total predicted user demand at the time interval t, respectively. In the traditional bulk power grid system, the user service reliability can be regarded as the successful demand ratio, where SR1(t) = DR1(t).
E. Case V
As we mentioned in Section IV-A, when the distributed energy resources are integrated into the power grid, the amount of total power supply will be increased and the power transmission losses will be decreased. Nonetheless, the intermittent nature of renewable energy resources and the mismatch of generated power with peak load conditions could result in serious challenges to the reliability of power supply. Also, to integrate the distributed energy resources into the power grid, there are a number of uncertainties, including distributed solar irradiance, wind speed, temperature, humidity, and so on. As previously stated, the uncertainties can be generalized as the prediction error of power generation. Thus, we present the probability of the total power generated by the distributed energy resources as N[μ′(t), σ′2(t)], where μ′(t) and σ′2(t) are respectively the mean and the variance of the total power generated by the distributed energy resources at the time interval t.
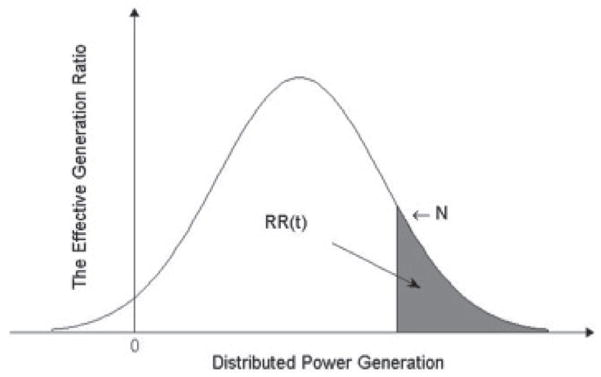
Recall that in Definition 4, we consider that the amount of power generated cannot be less than 0 and the cumulative probability of user demand from 0 to ∞ will be 1. We assume that the distributed power generation should be N in order to guarantee the amount of power required by users. When the distributed power generates more than N unit of power, the user demand will be satisfied. Thus, the effective generation ratio, as shown in Figure 4, can be represented by
Fig. 4.
Effective Generation Ratio
| (17) |
where Gd(t) is total power generation by distributed energy resources.
Recall that in Definition 2, we assume that the distributed power supply is N1 and the traditional power supply is N2. Then, based on Equations (6), (16), and (17), the user service reliability can be derived as
| (18) |
Based on Equation (18), comparing with Case IV, when DR1(t) < DR2(t) · RR2(t) (i.e., ), the user service reliability will increase.
F. Case VI
Recall that in Section II, storage devices can pull the power from the grid during the time when the production from bulk power generator exceeds consumption, and push the power to the grid at the time when consumption exceeds production. Thus, as shown in Figure 5, establishing a buffer in the power grid that can store energy to balance the demand and supply can increase the efficiency of the power grid and make the grid reliable. Based on Equation (18), when storage devices are deployed in the grid to provide power supply with the amount of N3, the user service reliability can be represented as,
Fig. 5.
Power Flow in the Smart Grid
| (19) |
Based on Equations (18) and (19), we can observe that integrating storage devices does not affect the effective generation ratio RR(t) such that RR3(t) = RR2(t). The amount of the total power supply capacity will increase due to the storage device discharging power to the grid, where N1 + N2 < N1 + N2 + N3. As a result, the successful demand ratio will increase, leading to a higher user service reliability. In addition, the storage can smooth the bulk power generated in different time intervals.
In order to achieve high user service reliability in a time window, we need to find the bound of power supply by the distributed energy resources and the power consumed by users based on the historical data set. Here, we leverage network calculus concept to derive these bounds. Notice that the network calculus has been widely used for modeling traffic flow in computer networks [12], [21]. Generally speaking, via defining several cumulative functions, the continuous traffic time model can be established. To be specific, the network traffic cumulative function can be used to measure the traffic backlog in the computer network. Also, the arrive curve and service curve functions have been introduced to model the input and output function of traffic flows in the computer network, aimed at achieving the required quality of service (i.e., delay and bandwidth guarantee), given the limited resources in the computer network.
Similar to the network traffic model, we can use the cumulative function to create a continuous power flow management model. In this model, the backlog of the grid is the amount of power stored in energy storage devices. Similar to the input and output function of the computer network, we can develop the power demand curve and power supply curve, by leveraging the concept of the arrive curve and service curve in computer networks, to derive the high bound of power demand and low bound of power supply from the distributed energy resources, aimed at achieving a high user service reliability. Distinct from the computer network, we will not consider delay for the power flow transmission in the power grid.
To be specific, we assume that in the time window [0, t], the power flow in the grid can be formalized by the cumulative function R(t). If a derivative of R(t) is , the cumulative function can be represented as and r(t) is a rate function. In addition, we define R1(t) as the cumulative power generation function, and R2(t) as the cumulative power consumption function, which will be the input and output functions of the power grid. The cumulative power generation function R1(t) consists of the cumulative bulk power generation G(t) and the cumulative power generated by distributed energy resources D(t). Thus, the backlog of the power grid in the time window [0, t] is x(t) = R1(t)–R2(t). When x(t) is positive, the amount of the cumulative power supply is larger than the amount of cumulative power demand at the time t, meaning that the user can have enough power at time t and the user service reliability is high. When x(t) is negative, the amount of cumulative power supply is less than the amount of cumulative power demand at time t, meaning that the user cannot obtain enough power at time t and the user service reliability is low.
From Equation (19), we know that deploying a storage device near a distributed energy resource can mitigate the intermittency and uncertainties of distributed energy resources, and similarly deploying the storage device near a user can reduce the disturbance raised by peak and non-peak power demands. Thus, as shown in Figure 5, the storage devices can be added into the system as buffers near to distributed energy resources and users. For the traffic control in computer networks, the leaky bucket controller can buffer the intermittent input traffic and provide constant output traffic. The storage device in the power grid plays the similar role as the leaky bucket controller does. The status of the storage device can be represented as
| (20) |
where Rk(t) is the cumulative function of storage device k, time t is larger than time h, and P is the constant power supply rate. If the storage device is deployed at the distributed energy resource side, the constant rate P = Pd is the constant supply rate of distributed energy resources. If the storage device is deployed at the user side, the constant rate P = Pu is the constant demand power rate. Thus, assume that all the storage devices are initially empty, as shown in Figure 5, the power supply curve of distributed energy resources demonstrates that a quantity of power supply can be highly reliable based on the power provided by distributed energy resources, which can be formalized as
| (21) |
and the power demand curve represents the maximum quantity of power demand, which can be formalized as
| (22) |
where a and b are denoted as the burst tolerance. The bulk power supply curve, which is constant power supply from bulk power generator, will then be
| (23) |
V. Performance Evaluation
We now show the evaluation results of the three power grid systems with respect to the cumulative power cost and user service reliability investigated in Sections II, III, and IV, respectively. In the following, we first present the evaluation methodology and then show evaluation results.
A. Evaluation Methodology
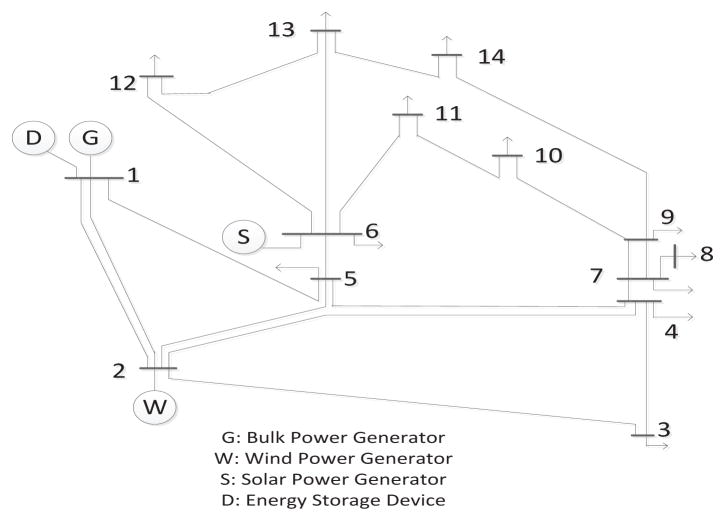
To show the effectiveness of integrating distributed energy resources into the power grid, we conduct the performance evaluation based on the IEEE14-Bus topology as shown in Figure 6. In this topology, we deploy one bulk power generator and one storage device at bus 1, wind power generator at bus 2, and solar power generator at bus 6. Buses are connected through power transmission lines. Notice that when the System I is simulated, the storage device at bus 1, wind power generator at bus 2, and solar power generator at bus 6 will be disconnected from the grid. Similarly, when System II is simulated, only the storage device at bus 1 will be disconnected. The wind power generator at bus 2, and solar power generator at bus 6, will connect to the grid to simulate distributed energy resource integration. When System III is simulated, all the buses and components will be connected to the grid topology.
Fig. 6.
IEEE 14 Bus Topology
In our simulation, we use the data set from California ISO website [13]. We consider the power line voltage is 400KV and consider the copper power transmission, where the resistivity is 0.000999ohms and cross section is 2.081 square millimeters [22]. We select a copper hexacyanoferrate battery of 500MW capacity as an energy storage device, in which the power loss ratio is 1% in the energy transforming process [23]. We consider the unit generation cost of the bulk generator is 50$/MWh, and the unit generation cost of wind and solar generators is 1$/MWh, where the unit generation cost is defined as the cost of 1MWh per unit power generation. We also assume that the power loss unit cost is the average energy price of the day, which is 100$/MWh [24].
B. Evaluation Results
Recall the metrics discussed in Section III in the Matlab simulation: (i) Cumulative Power Cost: The total cost of the power generation and distribution process in a time interval. (ii) User Service Reliability: The probability of user energy demand to be met by the grid.
Impact on Cumulative Energy Cost
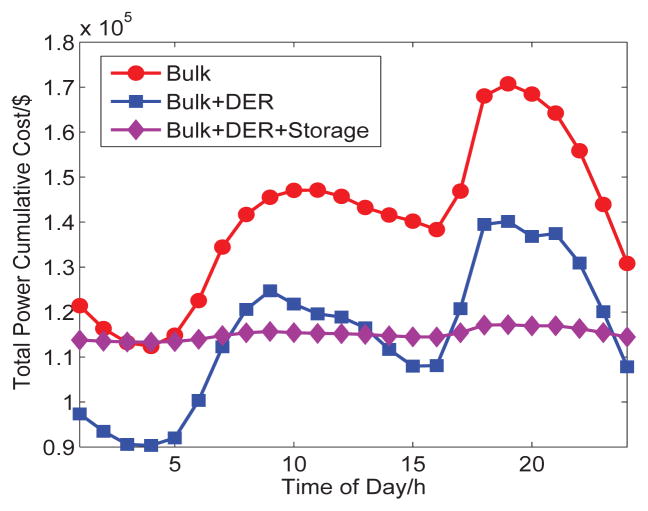
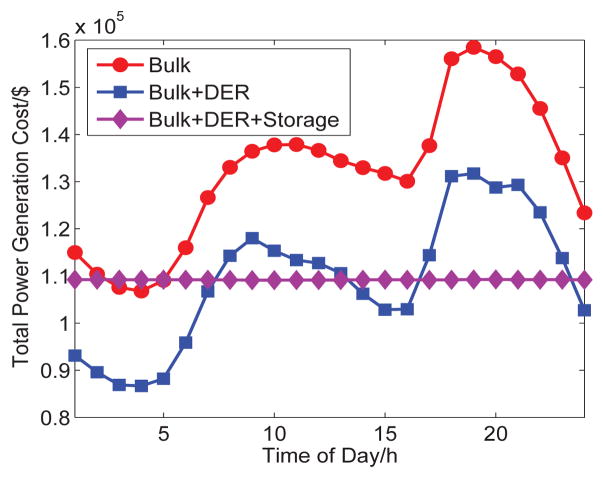
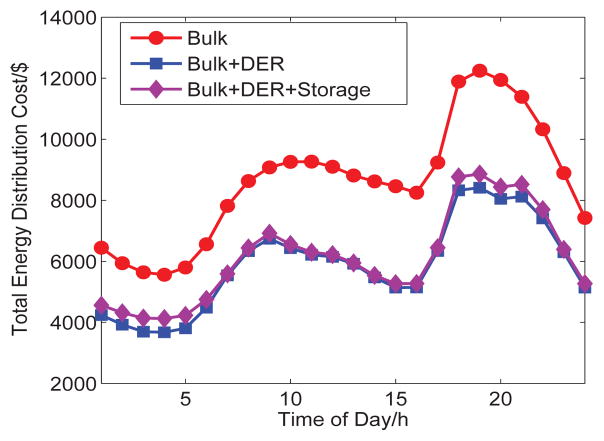
Figures 7, 8, and 9 show the cumulative energy cost, power generation cost, and power distribution cost of three systems that we introduce in Section II in 24 hours. As we can see from those figures, with the different times of the day, the cumulative energy cost fluctuates over time. Obviously, the cumulative energy cost of the power grid with the integrated distributed energy resources is about 3 × 10⁵ in dollars less than that in the bulk power grid. This is because the unit power generation cost of the distributed energy resources is low and the distributed energy resources near to users can reduce the power distribution cost. When the 500MW capacity storage is in place, the cumulative energy cost curve is stable at 1.15×10⁵ in dollars, showing that the storage device can reduce the fluctuation of the cumulative energy cost and maintain the cumulative energy cost across peak and off-peak time.
Fig. 7.
Total Power Cumulative Cost of Three Systems
Fig. 8.
Total Power Generation Cost of Three Systems
Fig. 9.
Power Transmission Loss of Three Systems
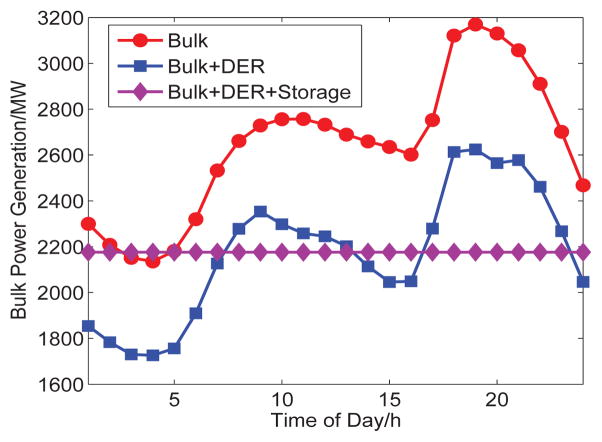
Figure 10 illustrates power generation from the bulk power generator in three systems throughout the day. As we can see from the figure, the integration of distributed energy resources can reduce the bulk power generation, while the integration of energy storage can smooth the fluctuation of bulk power generation to a constant 2200MW. The result matches with the analytical result in Section IV.
Fig. 10.
Comparison of Power Generation from Bulk Power Generator
Impact on User Service Reliability
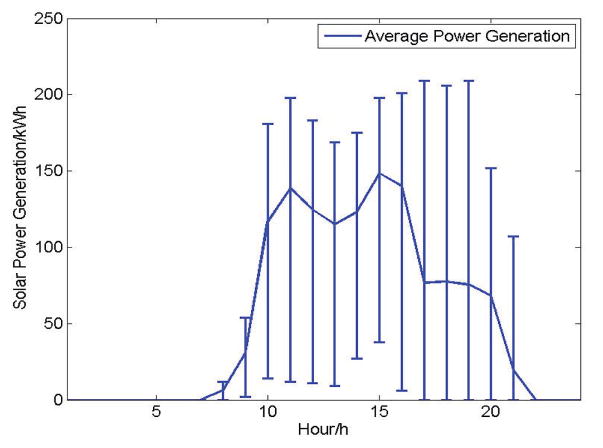
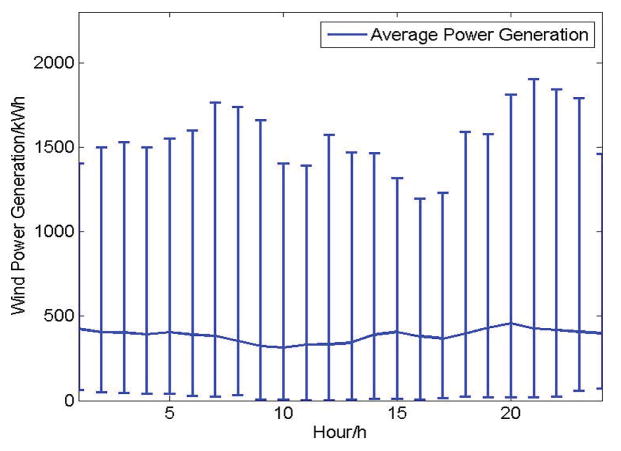
Figures 11 and 12 illustrate the distribution of the solar and wind power generation. As we can see from those figures, the solar and wind power generation are unstable, demonstrating high variability in each hour across different days. The solar power generation is only available between 7:00 and 22:00 time period. Considering the worst case of the wind and solar power generation that can guarantee a high effective generation ratio, we can see that the power generation of distributed energy resources is low.
Fig. 11.
Statistical Solar Power Generation in 24 Hours
Fig. 12.
Statistical Wind Power Generation in 24 Hours
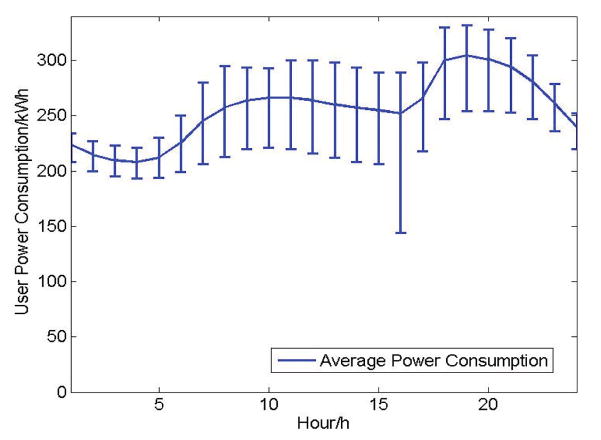
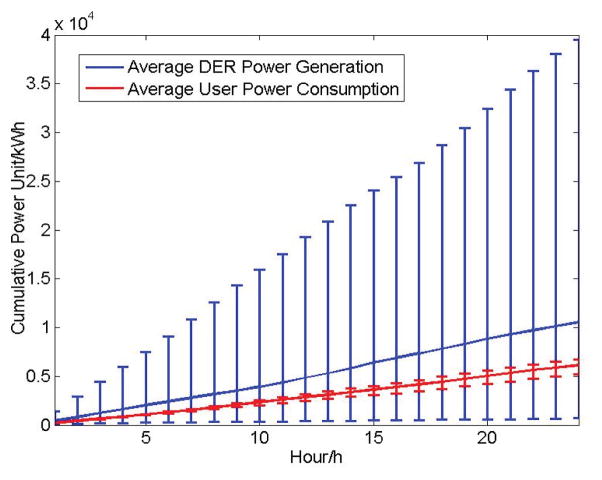
Figure 13 shows the overall hourly variation for different days is minimal. The largest fluctuation of user demand occurs at hour 16. Hour 18 to hour 20 is the peak time frame for power consumption. Figure 14 presents the statistical cumulative power generation and consumption in 24 hours. We can see that around 60% of power generation cases by the distributed energy resources can successfully satisfy all the user demands so that the effective generation ratio is around 60%.
Fig. 13.
Statistical User Power Consumption in 24 Hours
Fig. 14.
Statistical Cumulative Power Generation from Distributed Energy Resources and User Consumption in 24 hours
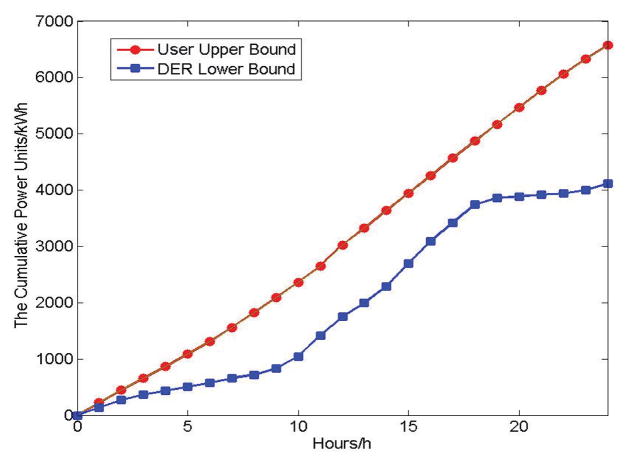
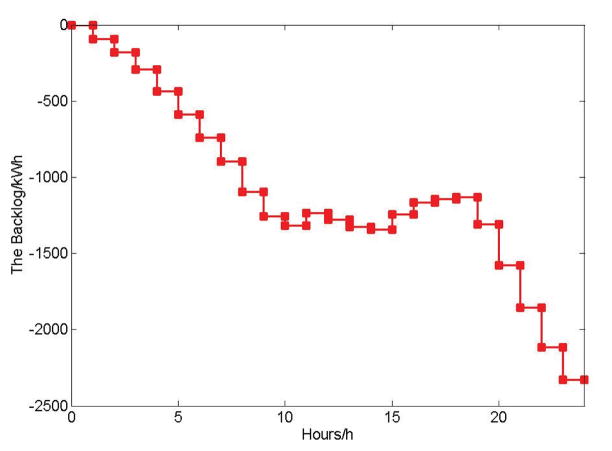
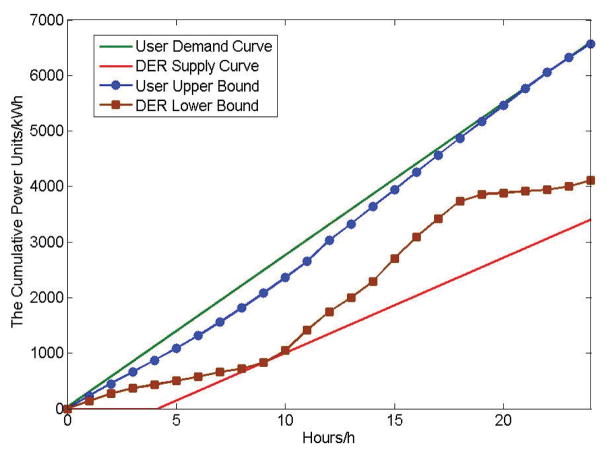
To provide a high user service reliability guarantee, we shall consider a high effective generation ratio and a high successful demand ratio, which can be provided by the lower bound of power supply by the distributed energy resources and the upper bound of user demand as shown in Figure 15. We can see that from the figure, considering the worst case, where the distributed energy resources can only provide a small amount of power generation and the users power demand is high, the distributed energy resources cannot provide enough power to satisfy the demand. Thus, as shown in Figure 16, the backlog of the system will be negative, meaning that the power grid needs additional power supply from the bulk power plants and storage devices to mitigate the lack of power supply.
Fig. 15.
Power Supply Lower Bound of Distributed Energy Resources vs. User Demand Upper Bound
Fig. 16.
The Backlog of Power System
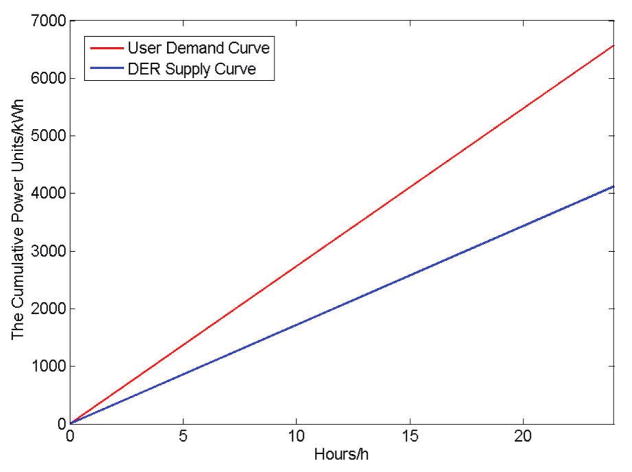
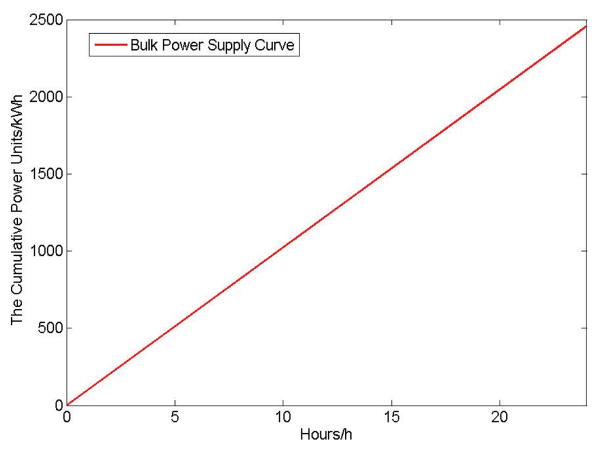
After the integration of storage devices in the power grid, the user demand curve and the supply curve of distributed energy resources are shown in Figure 17. As we can see from the figure, because the stored power in the storage device is initially empty, power supplied by the distributed energy resource is used to charge storage devices in the first 4 hours. After 4 AM, the storage devices can provide a constant power supply, which can mitigate unstable power generation from the distributed energy resources. Figure 18 shows the user demand curve and the supply curve of distributed energy resources when the storage devices are initially charged and have enough power backup. In addition, making up the lack of power supply, Figure 19 illustrates the supply curve of bulk power provided by the bulk power generation, demonstrating that the bulk power can be maintained at a constant level.
Fig. 17.
User Demand Curve and Supply Curve of Distributed Energy Resources
Fig. 18.
User Demand Curve and Supply Curve of Distributed Energy Resources With Power Backup
Fig. 19.
Bulk Power Supply Curve
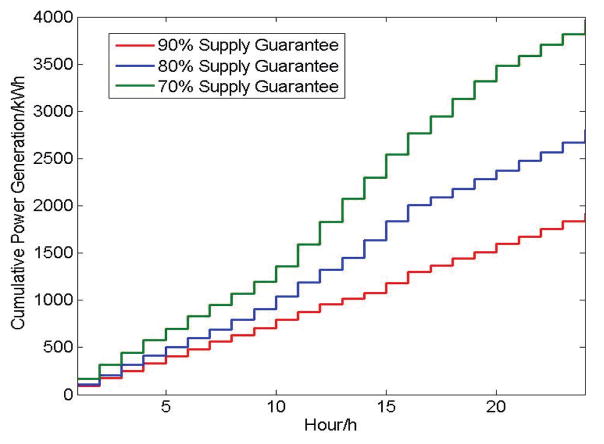
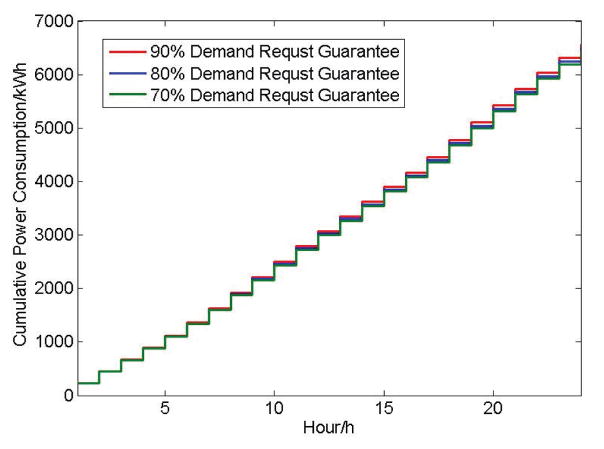
Figures 20 and 21 illustrate the statistically-based power supply and demand curves. In Figure 20, less power generated by the distributed energy resources to the grid can achieve a higher effective generation ratio. Similarly, in Figure 21, more power demand can be guaranteed, resulting in a higher probability that users will be satisfied.
Fig. 20.
Statistically-based Supply Curve of Distributed Energy Resources
Fig. 21.
Statistically-based User Demand Guarantee
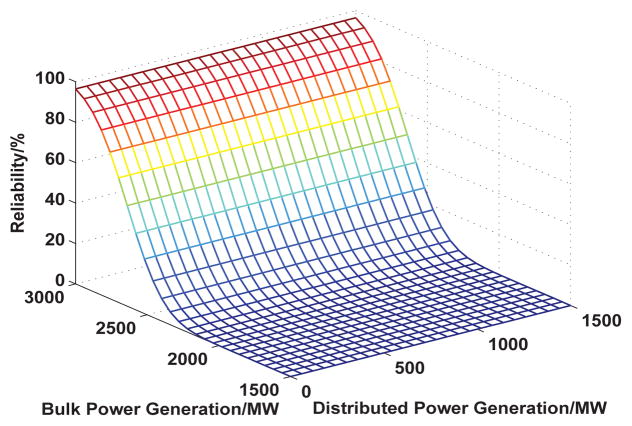
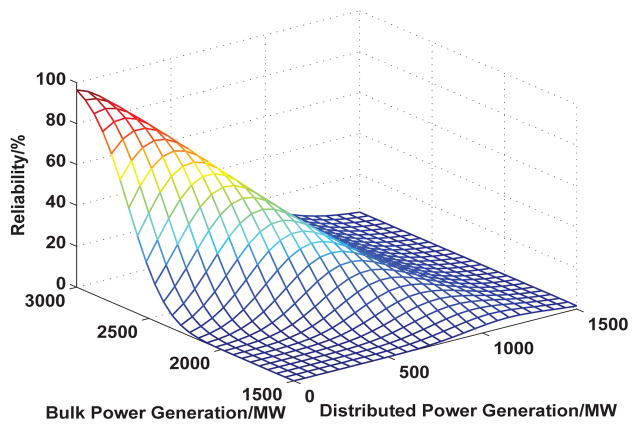
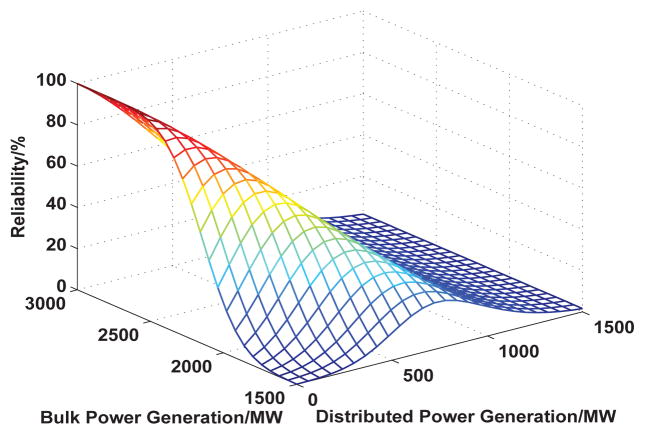
Figures 22, 23, and 24 show the user service reliability of the three systems. From Figure 22, we observe that, when the bulk power generation approaches 3000MW, the user service reliability approaches 100%. In Figure 23, we can see that when the bulk power generation is 2000MW and the distributed power generation is 1000MW, the user service reliability is higher than that of 2000MW bulk power generation alone because of the increase of total power generation. In Figure 24, where energy storage has also been integrated, by maintaining the distributed power generation at 500MW, and the bulk power generation at 2000MW, user service reliability is further increased.
Fig. 22.
User Service Reliability of Traditional Bulk System
Fig. 23.
User Service Reliability of Integrated Distributed Energy Resources
Fig. 24.
User Service Reliability of Integrated Distributed Energy Resources and Storage Devices
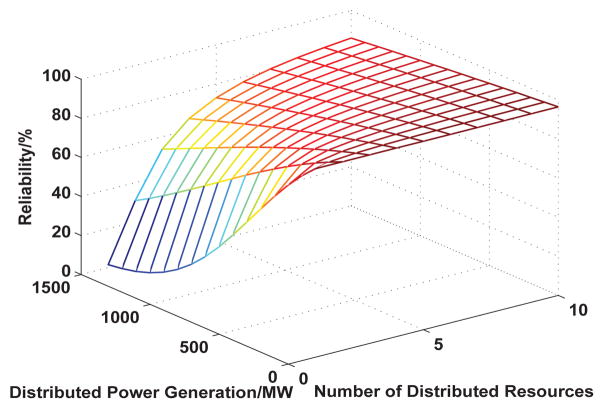
Figure 25 depicts tradeoffs between the user service reliability and the number of distributed energy resources. As we can see from the figure, when we assume that the total bulk power supply is 3000MW, the more distributed energy resources that are integrated to the grid, the higher the effective generation ratio will be, leading to the increase of user service reliability.
Fig. 25.
User Service Reliability vs. The Number of Distributed Energy Resources (Total Power Supply=3000 MW)
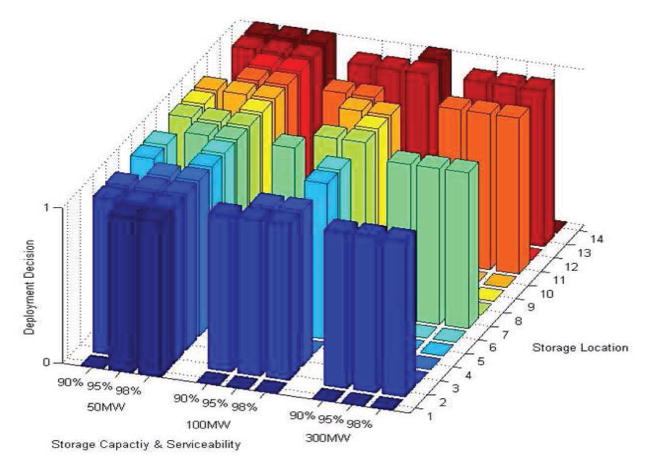
In addition, in Figure 26, we investigate the optimal storage device deployment. In this simulation, in x axis, we consider three different types of storage devices: battery based on Liion technology (50MW), Adiabatic compressed-air energy storage-CAES (100MW), and Pumped hydroelectric storage-PHS (300MW) with three different user service reliability: 90%, 95%, and 98%, respectively. In y axis, the number from 1 to 14 represents the deployed location of storage device in IEEE14 bus, which is shown in Figure 6. In z axis, the numbers 0 and 1 represent the decisions of deployment and non-deployment, respectively. As we can see from the figure, when the capacity is 50MW, to achieve 98% user service reliability with 50MW storage devices, each bus in Figure 6 should be deployed with a 50MW storage device. Nonetheless, when the storage capacity increases to 300MW for the deployment, to guarantee 98% user service reliability, we only need to deploy four 300MW storage devices on the location of buses: 2, 7, 11, and 13. The higher capacity storage device used for deployment, the smaller number of storage devices needs be deployed.
Fig. 26.
Optimal Storage Deployment
VI. Discussion
When our proposed model is directly applied to a large-scale power grid, it becomes difficult to obtain the optimal strategy for minimizing power cumulative cost, and it likewise becomes difficult to compute user service reliability, both due to high computational costs. To address these issues, making our proposed framework applicable to a large-scale power grid, we consider a multi-layer strategy that divides a large power grid into multiple smaller power grids, with each small power grid being further divided into multiple micro-grids. Our proposed modeling and analysis in Section III and Section IV can be applied to each individual grid at every layer. The smallest power grids in the lowest layer will be computed first. Furthermore, each power grid in a lower layer can be regarded as a single node of a parent layer power grid. The results obtained in the lower layer power grids can thus be used as the inputs of a higher layer grid. By doing this, we can obtain the result for the highest layer power grid, which is the equivalent result for the entire large-scale power grid.
VII. Related Work
Internet of Things (IoT) is a generic infrastructure that connects different “things” (e.g, different physical objects) to Internet [2], [3], [5]. The smart grid is a typical application supported by IoT [4]. Generally speaking, the smart grid is the integration of information and communication technologies with the physical power grid, enabling two-way communication between consumers and utility provider [6]. The smart grid is a large distributed system with diverse components, and its complexity and heterogeneity pose a number of challenges [25], [26]. A number of research efforts have been devoted to studying the factors, requirements, and effects of integrating distributed energy resources and energy storage technologies into the power grid [27], [28], [29], [30], [31], [32], [33], [34], [35], [36], [37], [38], [39]. For example, Ilic et al. [31] proposed an interactive dispatch method, which can integrate wind power, price-responsive demand, and other distributed energy resources. Evans et al. [32] conducted a comprehensive review of the energy technologies and provided a comparative summary of the performance factors associated with energy storage.
When distributed energy resources are integrated into the grid, the reliability of the power grid becomes a concern. There have been a number of research efforts devoted to addressing distributed energy resource issues [40], [41], [42], [43], [44], [45]. For example, Lin et al. [42] introduced a distributed energy routing protocol in the grid to minimize the power transmission cost. Moslehi et al. [43] reviewed the reliability impacts of renewable energy resources, demand response, and storage. He et al. [44] used the multiple timescale dispatch and scheduling technique to analyze the stochastic reliability of wind generation in the power grid. Considering the reliability of power grids, Lopes et al. [46] evaluated the impact of the uncertainty of wind energy production on the system planning process.
Our work also utilizes network calculus, which is a theory developed to carry out traffic engineering to provide quality of service to users in computer networks [47], [48]. Network calculus can be used in the smart grid for analyzing the power supply reliability with integrated renewable energy resources [49], [50], [51]. For example, Wu et al. [51] developed an energy charging and discharging model based on the stochastic network calculus to evaluate the performance of the power grid with renewable energy resources.
Distinct from the existing works outlined above, in this paper, we have proposed and defined two new metrics, power cumulative cost and user service reliability, which can be used to measure the performance of three types of power grid systems: (i) the traditional bulk power grid, (ii) the power grid with distributed energy resources, and (iii) the power grid with both distributed energy resources and storage devices. Based on these two metrics, we have conducted the effective modeling and quantitative analysis of these three systems, and have performed a systematic comparison. In addition, leveraging the concept of network calculus, we have introduced the power supply curve and user demand curve to derive the bounds for both power generation and supply, in order to realize a highly reliable power grid.
VIII. Conclusion
In this paper, we addressed the issue of assessing the impact of integrating distributed energy resources and energy storage devices in the smart grid. Particularly, we first introduced three types of power grid systems: the traditional bulk power grid, the power grid with distributed energy resources, and the power grid with both distributed energy resources and storage devices. We then defined two metrics: power cumulative cost and user service reliability, to measure the performance of these grid systems. We formally analyzed the effectiveness of integrating distributed energy resources and energy storage devices into the power grid. To achieve high user service reliability, we leveraged the concept of network calculus to introduce the power supply curve and user demand curve for deriving bounds for power supply and demand. In addition, we conducted an extensive performance evaluation, and our results show that integrating distributed energy resources with energy storage devices can reduce the generation costs, smooth the curve of bulk power generation over time, reduce bulk power generation and distribution losses, and provide sustainable user service reliability.
Footnotes
Notice that this paper has substantially extended the contributions of the preliminary conference version [1].
Certain commercial equipment, instruments, or materials are identified in this paper in order to specify the experimental procedure adequately. Such identification is not intended to imply recommendation or endorsement by the National Institute of Standards and Technology, nor is it intended to imply that the materials or equipment identified are necessarily the best available for the purpose.
References
- 1.Xu G, Moulema P, Yu W. Integrating distributed energy resources in smart grid: Modeling and analysis. Proceedings of IEEE Energy Tech. 2013 [Google Scholar]
- 2.Stankovic JA. Research directions for the internet of things. Internet of Things Journal, IEEE. 2014;1(1):3–9. [Google Scholar]
- 3.Pan J, Jain R, Paul S, Vu T, Saifullah A, Sha M. An internet of things framework for smart energy in buildings: Designs, prototype, and experiments. Internet of Things Journal, IEEE. 2015;2(6):527–537. [Google Scholar]
- 4.Wang Y, Mao S, Nelms R. Distributed online algorithm for optimal real-time energy distribution in the smart grid. Internet of Things Journal, IEEE. 2014;1(1):70–80. [Google Scholar]
- 5.Bao H, Lu R. A new differentially private data aggregation with fault tolerance for smart grid communications. Internet of Things Journal, IEEE. 2015;2(3):248–258. [Google Scholar]
- 6.National Institute of Standards and Technology(NIST) Smart Grid. http://www.nist.gov/smartgrid/nistandsmartgrid.cfm.
- 7.Frye W. Transforming the Electricity System to Meet Future Demand and Reduce Greenhouse Gas Emissions. Cisco Internet Business Solutions Group (IBSG); 2008. [Google Scholar]
- 8.Peeples D. India’s massive power blackout: Could smart grids help? 2012 Aug; [Google Scholar]
- 9.Reilly J. Is this the world’s biggest power cut? chaos strikes for a second day running as over 600 million people endure blackout in india. 2012 Jul; [Google Scholar]
- 10.Tech V. Distributed Generation: Educational Module. 2015. [Google Scholar]
- 11.Oren S, Callaway D, Mount T, Zhang M, Thomas R, Gross G, Dominguez-Garcia A. Renewable Energy Integration and the Impact of Carbon Regulation on the Electric Grid. Power Systems Engineering Research Center (PSERC); May, 2012. [Google Scholar]
- 12.Le Boudec J-Y, Thiran P. Network calculus: a theory of deterministic queuing systems for the internet. Springer Science & Business Media; 2001. p. 2050. [Google Scholar]
- 13.California ISO. Daily renewables watch. Apr, 2012. [Google Scholar]
- 14.Intergovermental Panel on Climate Change (IPCC) Fourth Assessment Report: Climate Change. 2007 http://www.ipcc.ch/publications_and_data/publications_and_data_reports.shtml#.UB6pUVIpF6Y.
- 15.Stern Review. The economics of Climate Change: Executive Summary. 2006 http://siteresources.worldbank.org/INTINDONESIA/Resources/226271-1170911056314/3428109-1174614780539/SternReviewEng.pdf.
- 16.Yu W, An D, Yang Q, Griffinth D. Towards statistical modeling and machine learning based energy usage forecasting in smart grid. ACM International Journal of Applied Computing Review (ACR) 2015;6(3):1169–1177. [Google Scholar]
- 17.Heaviside O. Electrical papers. Vol. 2 Cambridge University Press; 2011. [Google Scholar]
- 18.Millikan RA. Elements of Electricity. American School; 1921. [Google Scholar]
- 19.Shapiro SS, Wilk MB. An analysis of variance test for normality (complete samples) Biometrika. 1965;52:3–4. [Google Scholar]
- 20.Wilk MB, Gnanadesikan R. Probability plotting methods for the analysis of data. Biometrika. 1968;55(1) [PubMed] [Google Scholar]
- 21.Wang S, Xuan D, Bettati R, Zhao W. Providing absolute differentiated services for real-time applications in static-priority scheduling networks. IEEE/ACM Transactions on Networking (ToN) 2004;12(2):326–339. [Google Scholar]
- 22.Leenhouts D. How to Calculate Transmission Line Losses. http://www.ehow.com/how_7479386_calculate-transmission-line-losses.html.
- 23.Colin YC, Wessells D, Huggins Robert A. Copper hexacyanoferrate battery electrodes with long cycle life and high power. 2011 Nov; doi: 10.1038/ncomms1563. [DOI] [PubMed] [Google Scholar]
- 24.U.S Department of Energy. Electric power monthly. Jul, 2012. [Google Scholar]
- 25.Farhangi H. The path of the smart grid. IEEE Power and Energy Magazine. 2010;8(1):18–28. [Google Scholar]
- 26.Amin SM, Wollenberg BF. Toward a smart grid: power delivery for the 21st century. IEEE Power and Energy Magazine. 2005;3(5):34–41. [Google Scholar]
- 27.KEMA. Research Evaluation of Wind Generation, Solar Generation, and Storage Impact on the California Grid. 2010. [Google Scholar]
- 28.International Energy Agency. Variability of Wind Power and Other Renewables - Management Options and Strategies. 2005. [Google Scholar]
- 29.Hoste G, Dvorak M, Jacobson M. Matching Hourly and Peak Demand by Combining Different Renewable Energy Sources: A Case Study for California in 2020. 2009. [Google Scholar]
- 30.Taneja J, Katz R, Culler D. Defining cps challenges in a sustainable electricity grid. Proceeding of the 3-th the ACM/IEEE Third International Conference on Cyber-Physical Systems; 2012. [Google Scholar]
- 31.Ilic MD, Xie L, Joo JY. Efficient coordination of wind power and price-responsive demand-part ii: Theoretical foundations. IEEE Transactions on Power Systems. 2011;26(4):1885–1893. [Google Scholar]
- 32.Evans A, Strezov V, Evans T. Assessment of utility energy storage options for increased renewable energy penetration. Renewable & Sustainable Energy Reviews. 2012;16(6):4141–4147. [Google Scholar]
- 33.Denholm P, Ela E, Kirby B, Milligan M. The role of energy storage with renewable electricity generation: Technical report. National Renewable Energy Laboratory. 2010 Jan; [Google Scholar]
- 34.Connolly D, Lund H, Mathiesen B, Pican E, Leahy M. The technical and economic implications of integrating fluctuating renewable energy using energy storage. Renewable Energy: An International Journal. 2012;43:47–60. [Google Scholar]
- 35.Levron Y, Shmilovitz D. Power systems optimal peak-shaving applying secondary storage. Electric Power Systems Research. 2012;89:80–84. [Google Scholar]
- 36.Tushar W, Chai B, Yuen C, Smith DB, Wood KL, Yang Z, Poor HV. Three-party energy management with distributed energy resources in smart grid. IEEE Transactions on Industrial Electronics. 2015;62(4):2487–2498. [Google Scholar]
- 37.Rahbar K, Xu J, Zhang R. Real-time energy storage management for renewable integration in microgrid: an off-line optimization approach. IEEE Transactions on Smart Grid. 2015;6(1):124–134. [Google Scholar]
- 38.Weitemeyer S, Kleinhans D, Vogt T, Agert C. Integration of renewable energy sources in future power systems: The role of storage. Renewable Energy. 2015;75:14–20. [Google Scholar]
- 39.Moulema P, Yu W, Griffith D, Golmie N. Performance evaluation of smart grid applications using co-simulation. Proceedings of IEEE International Conference on Computer Communication and Networks (ICCCN); 2015. [Google Scholar]
- 40.Brown RE. Impact of smart grid on distribution system design. Proceedings of IEEE Power and Energy Society General Meeting - Conversion and Delivery of Electrical Energy in the 21st Century; 2008. [Google Scholar]
- 41.Eltigani D, Masri S. Challenges of integrating renewable energy sources to smart grids: A review. Renewable and Sustainable Energy Reviews. 2015;52:770–780. [Google Scholar]
- 42.Lin J, Yu W, Griffith D, Yang X, Xu G, Lu C. Software Engineering, Artificial Intelligence, Networking and Parallel/Distributed Computing. Springer; 2013. On distributed energy routing protocols in the smart grid; pp. 143–159. [Google Scholar]
- 43.Moslehi K, Kumar R. A reliability perspective of the smart grid. IEEE Transactions on Smart Grid. 2010;1(1):57–64. [Google Scholar]
- 44.He M, Murugesan S, Zhang J. Multiple timescale dispatch and scheduling for stochastic reliability in smart grids with wind generation integration. Proceedings of IEEE International Conference on Computer Communications (INFOCOM); 2011. [Google Scholar]
- 45.Chen X, Yu W, Griffith D, Golmie N, Xu G. On effectiveness of energy storage system against smart grid cascading failure. Proceedings of ACM International Conference on Reliable and Convergent Systems (RACS); 2014. [Google Scholar]
- 46.Lopes VS, Borges CL. Impact of the combined integration of wind generation and small hydropower plants on the system reliability. IEEE Transactions on Sustainable Energy. 2015;6(3):1169–1177. [Google Scholar]
- 47.Jiang Y, Liu Y. Stochastic network calculus. Vol. 1 Springer; 2008. [Google Scholar]
- 48.Ciucu F, Fidler M, Liebeherr J, Schmitt J. Network calculus. Dagstuhl Reports. 2015;63 [Google Scholar]
- 49.Wang K, Low S, Lin C. How stochastic network calculus concepts help green the power grid. Proceedings of 2011 IEEE International Conference on Smart Grid Communications (SmartGridComm); 2011. [Google Scholar]
- 50.Wang K, Ciucu F, Lin C, Low SH. A stochastic power network calculus for integrating renewable energy sources into the power grid. IEEE Journal on Selected Areas in Communications (JSAC) 2012;30(6):1037–1048. [Google Scholar]
- 51.Wu K, Jiang Y, Marinakis D. A stochastic calculus for network systems with renewable energy sources. Proceedings of 2012 IEEE Conference on Computer Communications Workshops (INFOCOM WKSHPS); 2012. [Google Scholar]


