Abstract
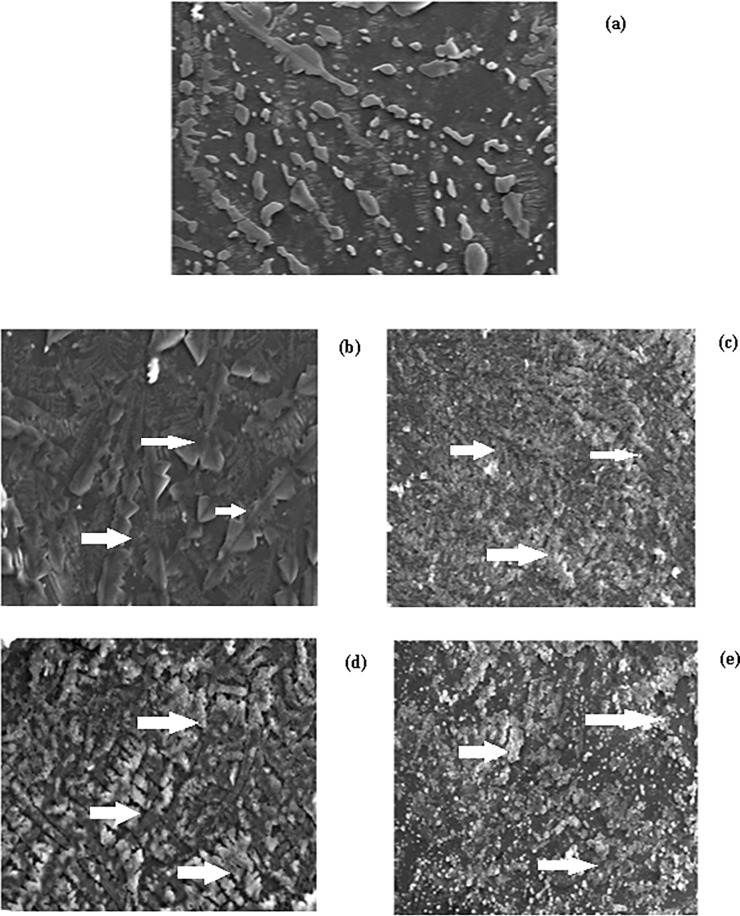
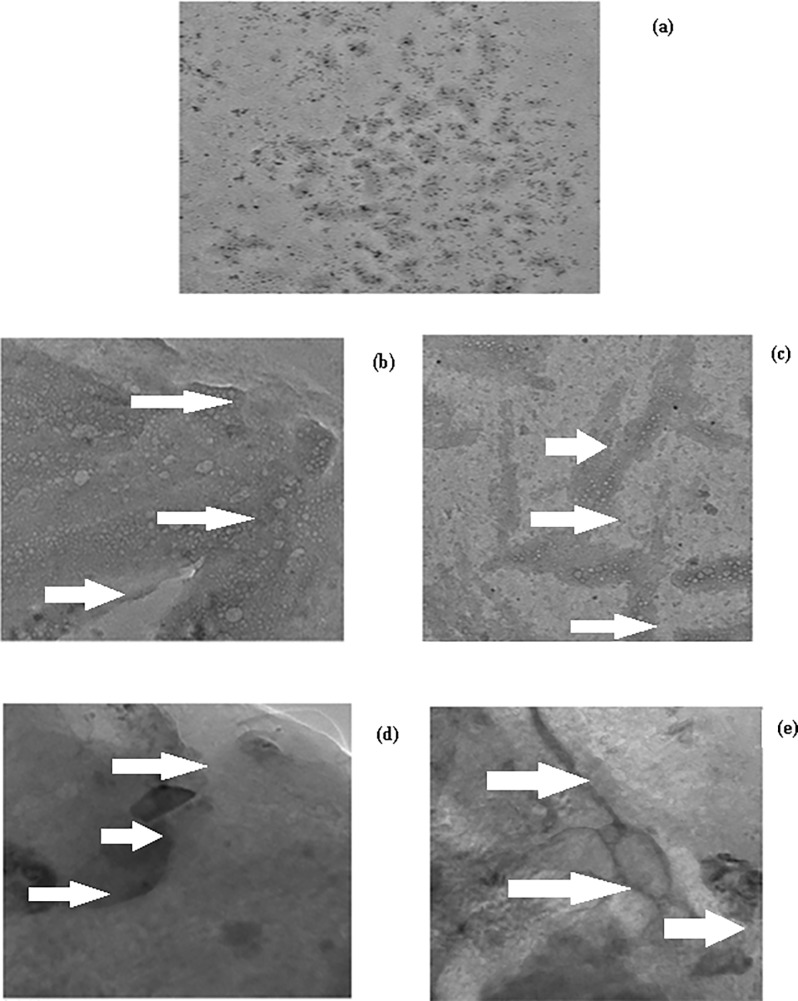
Hyperglycaemia triggers increased production of methylglyoxal which can cause gross modification in proteins’ structure vis-a-vis function though advanced glycation end products (AGEs). The AGEs may initiate vascular and nonvascular pathologies. In this study, we have examined the biochemical and biophysical changes in human IgG under normal and high glucose after introducing methylglyoxal into the assay mixture. This non-enzymatic reaction mainly engaged lysine residues as indicated by TNBS results. The UV results showed hyperchromicity in modified-IgG samples while fluorescence data supported AGEs formation during the course of reaction. Shift in amide I and amide II band position indicated perturbations in secondary structure. Increase carbonyl content and decrease in sulfhydryl suggests that the modification is accompanied by oxidative stress. All modified-IgG samples showed more thermostability than native IgG; the highest Tm was shown by IgG-high glucose-MGO variant. Results of ANS, Congo red and Thioflavin T dyes clearly suggest increase in hydrophobic patches and aggregation, respectively. SEM and TEM images support aggregates generation in modified-IgG samples.
1. Introduction
During certain conditions, such as diabetes mellitus, the blood sugar level increases several fold than normal, which if not controlled may lead to kidney damage [1], neurological damage [2], cardiovascular damage [3,4], damage to the retina [5] and damage to the feet [6] and lungs [7]. The increased level of blood glucose starts forming covalent adducts with various proteins including IgG through a non-enzymatic process called glycation. Irrespective of target protein the glycation is ubiquitously accompanied by generation of free radicals.
During chronic hyperglycaemia increased production of methylglyoxal occurs which may result in excessive production of advanced glycation end products (AGEs) [8]. The AGEs are insoluble adducts that accumulate on the proteins with long half-life such as IgG, collagen, lens protein etc. [9] which impairs the protein normal function and finally ends up in pathological states. Three different types of AGEs have been reported; (i) Fluorescent cross linking AGEs such as pentosidine [10] and crossline [11], (ii) Non-fluorescent cross linking AGEs such as imidazolium dilysine cross links [12], (iii) Non-cross-linking AGEs such as pyrraline [13], N-carboxymethyllysine (CML) [14] etc.
It has been argued that glucose toxicity may be associated with increased formation of methylglyoxal [15] which is formed by the enzymatic and non-enzymatic elimination of phosphate from triose phosphates, like dihydroxyacetone phosphate which is a glycolytic intermediate [16]. Under normal physiology, the detoxification of methylglyoxal occurs by the glyoxylase system present in the cytosol of all mammalian cells [17]. The altered glucose metabolism in insulin–resistant states (such as obesity and type 2 diabetes mellitus) may lead to increased formation of methylglyoxal [18]. The degree of hyperglycaemia determines the concentration of methylglyoxal in plasma of diabetic patients.
The glyoxylase provide critical defence against methylglyoxal damage. However, for proper functioning of the enzyme reduced glutathione is required, which is depleted during hyperglycaemia due to excessive production of ROS which results in accumulation of methylglyoxal, the undisputed champion of glycation [16].
IgG is a glycoprotein of approximately 150 kDa mass and constitutes about 75% of the total plasma immunoglobulin [19]. Furthermore, excess glycation of IgG is likely to affect its role as a defender [20]. A spectroscopic study on IgG glycated by methylglyoxal and glyoxal has been reported with regard to structural disruptions [21]. Furthermore, IgG has quite long half-life of 25.8 days and possesses 80 lysine residues and thus it is a better target for glycating agents [22, 23]. Glycated IgG is highly immunogenic and auto-antibodies against glycated IgG have been reported in the sera of diabetic [24] and rheumatoid arthritis patients [25].
In this study, IgG has been modified with methylglyoxal under normal (5 mM) and high glucose (10 mM) concentrations for 7 days and characterized by an array of biophysical and biochemical techniques with a view to understand the effect of glucose crowding on the potential of methylglyoxal in causing glycation of IgG.
2. Materials and methods
2.1 Materials
Methylglyoxal (MGO), Protein-A-agarose pre-packed affinity column, Congo red (CR), Thioflavin T (ThT), 8-anilinonaphthalene-1-sulfonic acid (ANS), sodium dodecyl sulphate, dialysis tubing, 2,4,6-trinitrobenzene sulphonic acid (TNBS) and standard molecular weight marker were purchased from Sigma Chemical Company (St. Louis, MO, USA). D-glucose was purchased from Qualigens, India. Nitroblue tetrazolium (NBT) dye, 2,4-dinitrophenylhydrazine (DNPH) and silver nitrate were obtained from SRL, India. Acrylamide, bisacrylamide, ammonium persulphate and N,N,N’,N’-tetramethylethylene- diamine (TEMED) were purchased from Bio-Rad Laboratories, USA. All other reagents were of highest analytical grade available. The study protocol was approved by the Institutional Ethics Committee (IEC), Faculty of Medicine, Aligarh Muslim University, India. Furthermore, the blood sample was voluntarily donated by MAK and the same was used for IgG isolation. This was reported to the IEC.
2.2 Purification of human serum IgG on protein A-agarose affinity column
Decomplemented sera of healthy human subjects were placed on top of the Protein A-Agarose affinity column to purify IgG [26]. The purity of IgG was judged from absorbance ratio (278/251) of 2.0 or more. The homogeneity was checked on 7.5% non-reducing SDS-polyacrylamide gel and a single homogeneous band was found of pure IgG (Inset to Figure A in S1 File).
2.3 IgG modification by methylglyoxal under normal and high glucose
At the time of experiment, IgG (6.67 μM) was rapidly transferred in assay tubes containing 5 mM or 10 mM glucose and 6.67 μM MGO and incubated for 7 days at 37°C in capped vials. A small volume of assay mixtures was withdrawn every 12 h and subjected to NBT assay. At the end of incubation the contents were extensively dialyzed against PBS (pH 7.4) to remove unbound methylglyoxal/glucose. If needed, the dialysates were stored at -20°C.
2.4 UV-Vis spectroscopy
Absorption profiles of modified IgG were recorded on Shimadzu spectrophotometer (model UV-1700) in the wavelength range of 240–400 nm using quartz cuvette of 1 cm path length. Increase in absorbance at 280 nm (hyperchromicity) was calculated from the following equation:
| (1) |
2.5 Fluorescence analysis
Changes in the fluorescence properties of IgG upon modification by MGO under normal and high glucose were studied on Shimadzu spectrofluorometer (RF-5301 PC). The samples were excited at 285 nm (specific for tryptophan) and the emission spectra were recorded in the wavelength range of 290–400 nm [27]. The decrease in the fluorescence intensity (F.I.) was calculated from the following equation:
| (2) |
AGE specific fluorescence was measured by exciting the samples at 370 nm. In this case the emission spectra were recorded in the wavelength range of 400–600 nm [28]. The increase in F.I. was calculated from the following equation:
| (3) |
2.6 Quantitative estimation of ε-amino groups by TNBS
The estimation of free ε-amino groups was carried out in native and modified IgG samples with the help of 2, 4, 6-trinitrobenzenesulphonic acid (TNBS) reagent. TNBS specifically reacts under mild conditions with reactive ε-amino groups to form trinitrophenyl derivatives [29]. Briefly, 100 μl of 0.5% (w/v) TNBS was added to 0.5 ml of MGO-modified IgG samples and incubated for 1 h at 37°C. At the end of the incubation the samples were solubilised in 0.25 ml of 10% SDS followed by the addition of 0.1 ml of 1 N HCl. Absorbance was recorded at 420 nm and ε-amino groups were calculated using molar extinction coefficient of 19,200 cm-1mol-1. Furthermore, reduction in ε-amino groups of IgG due to methylglyoxylation was calculated from the following formula:
| (4) |
2.7 Effective protein hydrophobicity
Binding of ANS dye to native and modified IgG was evaluated in terms of increase in fluorescence intensity. A fresh stock of the dye was prepared in distilled water and concentration was determined spectrophotometrically using molar extinction coefficient of 5000 M-1cm-1 at 350 nm [30]. The molar ratio of protein to ANS was adjusted to 1:50 and emission spectra were recorded in the wavelength range of 400–600 nm after excitation of the samples at 380 nm. Increase in ANS binding to modified IgG was calculated from the following equation:
| (5) |
2.8 Determination of protein bound carbonyl
Carbonyl content of native and modified IgG samples was determined after reaction with DNPH [31]. The final absorbance was read at 360 nm and the carbonyl content was determined using molar extinction coefficient of 22,000 M-1cm-1. The result was expressed as nmol/mg protein.
2.9 FT-IR spectroscopy
FT-IR spectra were recorded on PerkinElmer FT-IR spectrometer (model; spectrum 2) in the wavenumber range of 1400 to 1800 cm-1 which covers the typical amide I and amide II regions [32]. On the platform of attenuated total reflection (ATR) device, 6.67 μM of native IgG and modified IgG sample (6.67 μM IgG modified with 6.67 μM MGO under 5 mM and 10 mM glucose) in 10 μl volume were placed and spectra were collected.
2.10 Determination of free sulfhydryls by Ellman’s reagent
The free sulfhydryl groups in native and modified IgG samples were determined by Ellman’s reagent [33]. Following solutions were prepared:
DTNB Stock: 50 mM sodium acetate in distilled water containing 2 mM DTNB
Tris Buffer: 1M Tris, pH 8.0
DTNB working reagent was prepared by mixing 100 μl of Tris buffer, 840 μl distilled water and 50 μl of DTNB stock. Ten μl of the sample was mixed with 990 μl of DTNB working reagent and incubated for 5 min at 37°C. Absorbance was recorded at 412 nm. The free sulfhydryl content was determined using molar extinction coefficient of 13,600 M-1cm-1.
2.11 Detection of Amadori adduct by NBT reagent
The MGO-modified IgG samples were subjected to NBT reduction assay for Amadori adduct (ketoamine) as described [34]. Samples (300 μl) were mixed with 3 ml of 100 mM sodium carbonate buffer (pH 10.35) containing 0.25 mM NBT and incubated at 37°C for 2 h and absorbance was read at 525 nm against distilled water. The Amadori adduct was calculated using molar extinction coefficient of 12,640 M-1cm-1 for monoformazan. Increase in fructosamine content (FC) was calculated from the following equation:
| (6) |
2.12 Detection of 5-hydroxymethylfurfural (HMF) in native and modified IgG samples
Formation of 5-hydroxymethylfurfural (HMF) from the Amadori product (ketoamine) of modified IgG was detected by thiobarbituric acid (TBA) reaction according to the method described by Ney et al [35]. Briefly, 1 ml each of native IgG and modified IgG samples were mixed with 1 ml of oxalic acid (1M) and incubated at 100°C for 2 h. Then, the protein in the assay mixture was removed by precipitation with 40% trichloroacetic acid. 0.25 ml of TBA (0.05 M) was added to 0.75 ml of protein free filtrate and incubated at 40°C for 40 min. The colour was read at 443 nm and amount of HMF was calculated using molar extinction coefficient of 40,000 cm-1mol-1.
2.13 Thermal denaturation studies
Effect of MGO modification on stability of IgG under normal and high glucose was ascertained from midpoint melting temperatures (Tm) of samples. All samples were subjected to heat induced melting from 20°C to 95°C at a rate of 1°C/min. The change in absorbance at 280 nm was recorded. Percent denaturation was calculated from the following equation:
| (7) |
where,
AT = Absorbance at temperature T°C
Amax = Final absorbance on the completion of denaturation (95°C)
A20 = Initial absorbance at 20°C
2.14 Detection of aggregates by Congo red (CR) and Thioflavin T (ThT)
Congo red is a non fluorescent dye. When it binds with amyloid fibrils/ protein aggregates it gives apple green birefringence due to expansion (delocalization) of the conjugated π-π electron system. The molar ratio of sample to Congo red was kept at 1:2 and the assay mixture was incubated for 30 min at room temperature prior to spectra recording in the wavelength range of 300–700 nm [36].
Native and modified IgG samples were incubated with ThT in a molar ratio of 1:2 for 60 min at 25°C [37]. The samples were excited at 435 nm and emission profiles were recorded. Increase in ThT binding was calculated from the following equation:
| (8) |
2.15 Scanning electron microscopy
Fifty μl of sample was placed on a glass slide and then a cover slip was mounted. This was followed by overnight dehydration at 37°C and 50% humidity. The sample was gold platedand visualized underscanning electron microscope.The image was recorded with the help of JEOL JSM-6510LV microscope at an acceleration voltage of 15 kV and 1500 x magnification.
2.16 Transmission electron microscopy
The sample was fixed, dehydrated with ethanol and passed through propylene oxide. This was followed by grid preparation and coating with formvar film. Then electron of specific wavelength was passed through the grid and the transmitted image was processed with the help of iTEM and TIA software.
2.17 Statistical analysis
Data are presented as mean ± standard deviation. Statistical significance of the data was determined by Student’s–t test and a p-value of <0.05 was considered as significant.
3. Results
3.1 UV studies on IgG modified by methylglyoxal under normal and high glucose
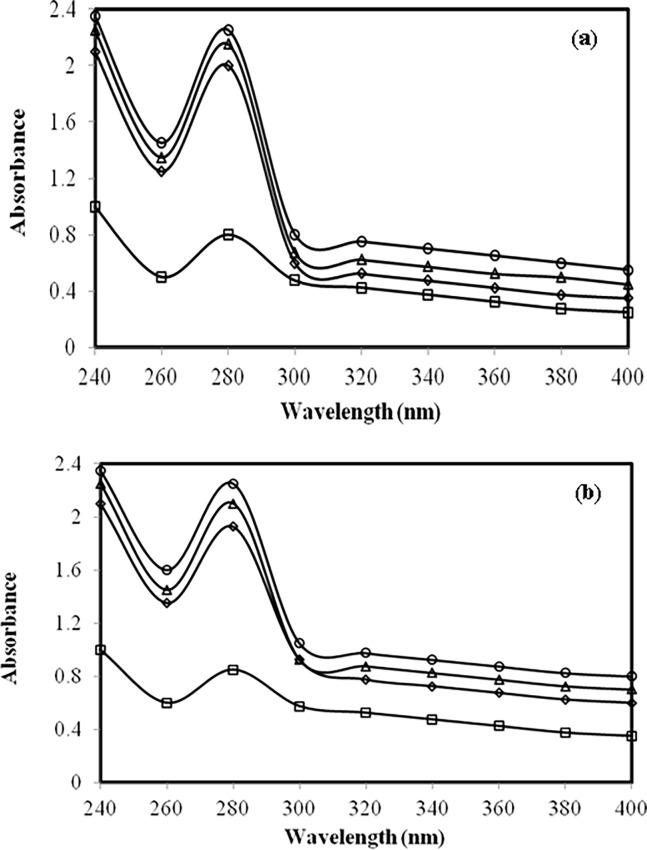
Native IgG showed the λmax at 280 nm (Figure A in S1 File). However, when IgG was incubated with normal glucose concentration (5 mM) for 7 days, we observed large hyperchromicity (Fig 1A). Furthermore, co-incubation with different concentrations of methylglyoxal caused further increase in hyperchromicity. A similar spectral pattern was observed with high glucose (10 mM) (Fig 1B). A daily record of change in absorbance of different samples has been shown in Table 1.
Fig 1.
(a) Absorbance study. UV absorption spectra of native IgG (open square), IgG + 5 mM glucose (open rhombus), IgG + 5 mM glucose + 3.33 μM MGO (open triangle) and IgG + 5 mM glucose + 6.67 μM MGO (open circle) after 7 days.(b) Absorbance study. UV absorption spectra of native IgG (open square), IgG + 10 mM glucose(open rhombus), IgG + 10 mM glucose + 3.33 μM MGO (open triangle) and IgG + 10 mM glucose + 6.67 μM MGO (open circle) after 7 days.
Table 1. Effect of time on 280 nm absorbance of native IgG and its modified counterparts.
| Sample | Absorbance at 280 nm | ||||||||
|---|---|---|---|---|---|---|---|---|---|
| (0 h) | (24 h) | (48 h) | (72 h) | (96 h) | (120 h) | (144 h) | (168 h) | (192 h) | |
| Native IgG | 0.80 (0.0) | 0.82 (0.0) | 0.84 (0.0) | 0.85 (0.0) | 0.86 (0.0) | 0.87 (0.0) | 0.88 (0.0) | 0.88 (0.0) | 0.88 (0.0) |
| IgG + 5 mMglucose | 1.4 (42.85) | 1.46 (43.83) | 1.54 (45.45) | 1.61 (47.20) | 1.72 (50.00) | 1.8 (51.66) | 1.84 (52.17) | 1.91 (53.92) | 1.86 (52.68) |
| IgG + 10 mM glucose | 1.5 (46.66) |
1.55 (47.09) | 1.62 (48.14) | 1.7 (50.00) | 1.8 (52.22) | 1.9 (54.21) |
1.96 (55.10) | 2.01 (56.21) | 1.9 (55.55) |
| IgG + 5 mM glucose +3.33 μM MGO | 1.54 (48.05) | 1.62 (49.38) | 1.7 (50.58) | 1.78 (52.24) | 1.86 (53.76) | 1.95 (55.38) | 2.03 (56.65) | 2.1 (58.09) | 2.05 (57.07) |
| IgG + 5 mM glucose +6.67 μM MGO | 1.64 (51.21) | 1.74 (52.87) |
1.81 (53.59) | 1.91 (55.49) | 1.99 (56.78) | 2.06 (57.76) | 2.13 (58.68) | 2.2 (60.00) | 2.16 (59.25) |
| IgG + 10 mM glucose +3.33 μM MGO | 1.72 (53.48) | 1.82 (54.94) | 1.89 (55.55) | 2.02 (57.92) | 2.15 (60.00) | 2.27 (61.67) |
2.39 (63.17) |
2.54 (65.35) | 2.49 (64.65) |
| IgG + 10 mM glucose +6.67 μM MGO | 1.82 (56.04) | 1.94 (57.73) | 2.1 (60.00) | 2.17 (60.82) | 2.29 (62.44) | 2.49 (65.06) | 2.64 (66.66) | 2.75 (68.00) | 2.67 (67.04) |
Note: The data within parentheses indicate percent change in absorbance at 280 nm compared to native IgG.
3.2 Fluorescence studies
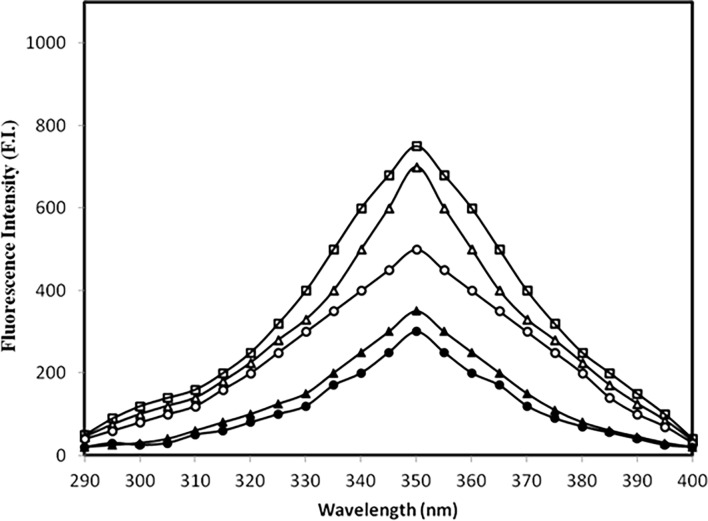
IgG’s tryptophan fluorescence is influenced by changes in its surrounding/microenvironment and that parameter was taken into consideration to analyse the impact of IgG modification by methylglyoxal under normal and high glucose [38]. All samples were excited at 285 nm and the results are shown in (Fig 2). The high glucose caused appreciable decrease in tryptophan fluorescence which further decreased in presence of MGO. The detailed results are summarized in Table 2.
Fig 2. Fluorescence study.
Emission profile of native IgG (open square), IgG + 5.0 mM glucose (open triangle), IgG + 5.0 mM glucose + 6.67 μM MGO (filled triangle), IgG + 10.0 mM glucose (open circle) and IgG + 10.0 mM glucose + 6.67 μM MGO (filled circle) after 7 days. All samples were excited at 285 nm for tryptophan fluorescence.
Table 2. Effect of time on tryptophan specific fluorescence of various samples.
| Sample | Fluorescence intensity (F.I.) | |||||||
|---|---|---|---|---|---|---|---|---|
| (0 h) | (24 h) | (48 h) | (72 h) | (96 h) | (120 h) | (144 h) | (168 h) | |
| Native IgG | 980 | 950 | 917 | 880 | 848 | 800 | 776 | 760 |
| IgG + 5 mM glucose | 934 (4.69) | 900 (5.26) | 866 (5.56) | 824 (6.36) | 792 (6.60) |
745 (6.87) | 721 (7.08) |
700 (7.89) |
| IgG + 10 mM glucose | 912 (7.45) |
872 (8.21) | 816 (11.01) | 743 (15.56) | 706 (16.74) | 657 (17.87) | 540 (30.41) | 490 (35.52) |
| IgG + 5 mM glucose + 6.67 μM MGO |
700 (28.57) | 646 (32.00) | 606 (33.91) | 576 (34.54) | 516 (39.15) | 442(44.75) | 396 (48.96) | 320 (57.89) |
| IgG + 10 mM glucose + 6.67 μM MGO | 600 (38.77) | 564 (40.63) | 514 (43.94) | 478 (45.68) | 422 (50.23) |
376 (53.00) | 300 (61.34) | 260 (65.78) |
Note: The data within parentheses indicate percent decrease in F.I. compared to native IgG.
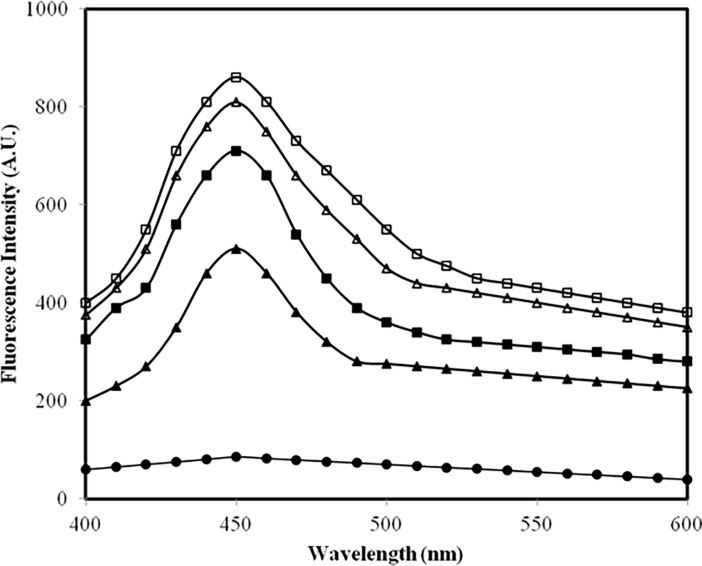
Likely formation of fluorogenic AGEs in samples was assessed by feeding 370 nm [39] wavelength and emission profiles were recorded (Fig 3). Native IgG was devoid of AGEs. Under high glucose concentration AGEs formation was substantially high which further enhanced in presence of methylglyoxal. The results are summarized in Table 3.
Fig 3. AGEs specific fluorescence assay.
Emission profile of native IgG (filled circle), IgG + 5.0 mM glucose (filled triangle), IgG + 5.0 mM glucose + 6.67 μM MGO (open triangle), IgG + 10.0 mM glucose (filled square) and IgG + 10.0 mM glucose + 6.67 μM MGO (open square) after 7 days. All samples were excited at 370 nm for AGEs.
Table 3. Effect of time on AGEs specific fluorescence of various samples.
| Sample | Fluorescence intensity (F.I.) | |||||||
|---|---|---|---|---|---|---|---|---|
| (0 h) | (24 h) | (48 h) | (72 h) | (96 h) | (120 h) | (144 h) | (168 h) | |
| Native IgG | 55 | 65 | 75 | 85 | 85 | 85 | 85 | 85 |
| IgG+ 5 mM glucose | 100 (45.00) | 130 (50.00) | 250 (70.00) | 320(73.43) | 380 (77.63) | 440 (80.68) | 480 (82.29) | 510 (83.33) |
| IgG+ 10 mM glucose | 125 (56.00) | 200 (67.50) | 340 (77.94) | 420 (79.76) | 480 (82.29) | 575 (85.21) | 640 (86.71) | 700 (87.85) |
| IgG + 5 mM glucose + 6.67 μM MGO | 250 (78.00) | 350 (81.42) | 440 (82.95) | 530 (83.96) | 615 (86.17) | 680 (87.50) | 740 (88.51) | 800 (89.37) |
| IgG + 10 mM glucose + 6.67 μM MGO | 325 (83.07) | 450 (85.55) | 595 (87.39) | 690 (87.68) | 720 (88.19) |
760 (88.81) | 810 (89.50) | 860 (90.11) |
Note: (i) The data within parentheses indicate percent increase in F.I. compared to native IgG. (ii) All samples were excited at AGEs specific wavelength of 370 nm.
3.3 Estimation of ε-amino groups in IgG samples modified by methylglyoxal under normal and high glucose
As shown in Figure B in S1 File. addition of 5 mM (low) glucose to IgG has consumed some ε-amino moieties and it came down from 230.01±1.72 nmol/mg in native IgG to 200.221±1.54 nmol/mg in IgG containing 5 mM glucose. Addition of methylglyoxal further decreased the ε-amino moieties to 111.78±0.82 nmol/mg [40]. Furthermore, at 10 mM (high) glucose, the consumption of ε-amino group increased and methylglyoxal addition further engaged the ε-amino group.
3.4 Effective protein hydrophobicity
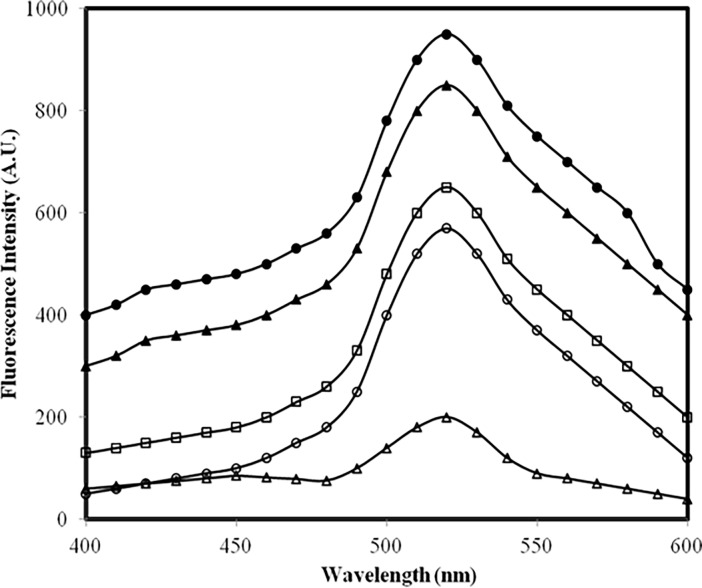
Profiles in Fig 4 suggest that methylglyoxal has led to exposure of more hydrophobic moieties/patches in IgG under high glucose compared to low glucose [41].
Fig 4. ANS fluorescence assay.
Emission profile of ANS mixed with: native IgG (open triangle), IgG + 5.0 mM glucose (open circle), IgG + 10.0 mM glucose (open square), IgG + 5.0 mM glucose + 6.67 μM MGO (filled triangle) and IgG + 10.0 mM glucose + 6.67 μM MGO (filled circle). All samples were excited at 380 nm.
3.5 Estimation of protein carbonyl
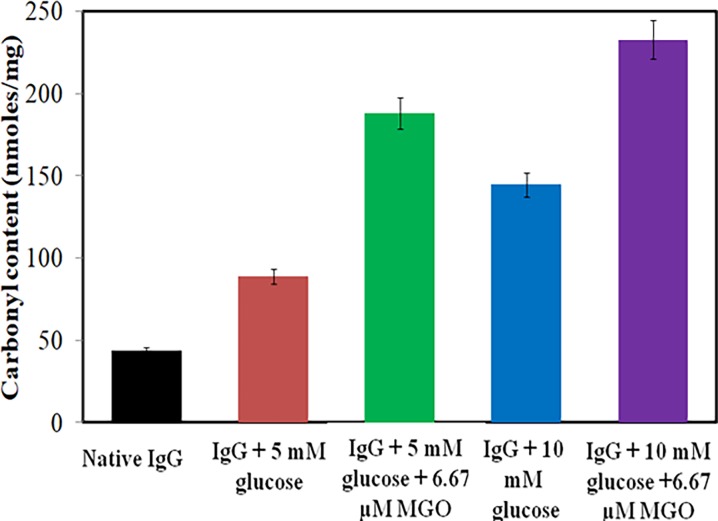
Carbonyls, biomarker of the oxidative stress [42], are outcome of the oxidation of lysine, arginine, threonine and proline residues. Upon reaction with dinitrophenylhydrazine, carbonyls form 2,4-dinitrophenylhydrazone and measured at 360 nm. The average carbonyl content of native IgG was found to be 43.56±0.97 nmol/mg of IgG (Fig 5). Both glucose and methylglyoxal produced stress on protein and lead to 2–5 fold increase in carbonyl.
Fig 5. DNPH assay.
Carbonyl content in native IgG (black), IgG + 5.0 mM glucose (red), IgG + 5.0 mM glucose + 6.67 μM MGO (green), IgG + 10.0 mM glucose (blue) and IgG + 10.0 mM glucose + 6.67 μM MGO (purple). Each bar represents the mean ± S.D. of three independent assays in similar experimental conditions. * p < 0.05 was considered as statistically significant as compared to native IgG with each modified group.
3.6 FT-IR recording
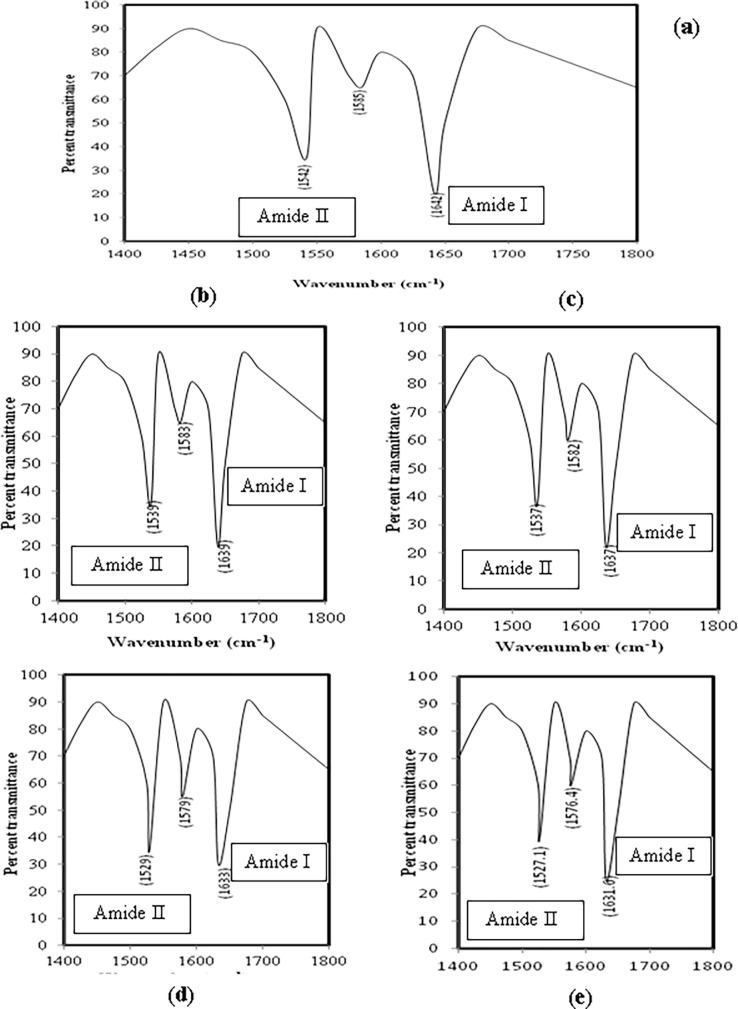
Changes in the secondary structure of proteins due to stretching and bending of bonds in peptide backbone can be examined by FT-IR spectroscopy. In case of native IgG the amide I band is seen between wave number 1624 and 1642 cm-1 while amide II band is located between 1510 and 1550 cm-1 [43]. The FT-IR spectra of native IgG, glucose modified IgG and MGO-glucose-modified IgG have been shown in (Fig 6A–6E). The changes in the vibrations of positions of Amide I and Amide II band in Fig 6B–6E is a clear indication of band stretching and/or bending during the modification. The data has been compiled in Table 4.
Fig 6.
(a) FT-IR study. FTIRprofile of native IgG. (b-e) FT-IR study. FTIRprofiles of IgG + 5 mM glucose (b), IgG + 10 mM glucose (c), IgG + 5 mM glucose + 6.67 μM MGO (d) and IgG + 10 mM glucose + 6.67 μM MGO (e).
Table 4. FTIR band characteristics of native and modified IgG preparations.
| Sample | Band type with wavenumber | ||
|---|---|---|---|
| Amide I | Amide II | Extra band | |
| Native IgG | 1642 | 1542 | 1585 |
| IgG + 5 mM glucose | 1639 | 1539 | 1583 |
| IgG + 10 mM glucose | 1637 | 1537 | 1582 |
| IgG + 5 mM glucose + 6.67 μM MGO | 1633 | 1529 | 1579 |
| IgG + 10 mM glucose + 6.67 μM MGO | 1631.6 | 1527.1 | 1576.4 |
3.7 Estimation of free sulfhydryl
Modifications induced by glucose and/or MGO on protein is generally accompanied by oxidative stress which leads to many biochemical changes. A change in the redox state of protein is also the consequence of oxidative stress, and sulfhydryl estimation by Ellman’s reagent is an authentic parameter of such an event. As shown in Figure C in S1 File the free sulfhydryl content in IgG decreased more under pathological concentration of glucose (10 mM) as compared to physiological level (5 mM). Furthermore, in presence of MGO the decrease in free sulfhydryls is elevated compared to what was observed with glucose alone. It simply suggests that the redox imbalance created in IgG by glucose got augmented in presence of methylglyoxal.
3.8 Nitrobluetetrazolium reduction assay for determination of early glycation products (Amadori products) in native and MGO-modified IgG in presence of glucose
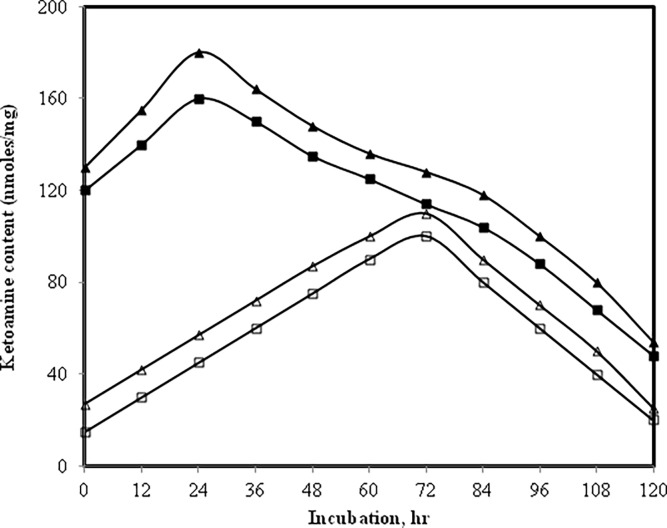
NBT reduction assay was carried out on IgG modified by methylglyoxal under normal and high glucose to work out the optimum time required for optimum formation of Amadori products [44]. It was observed that in IgG samples containing normal or high glucose but devoid of methylglyoxal the Amadori formation completes by 72 h (Fig 7). However, in presence of methylglyoxal the time required for the formation of optimum amount of Amadori products was just 24 h. Furthermore, we also observed that there was high yield of Amadori products when methylglyoxal was present. With increase in incubation time the Amadori products slowly rearranged into AGEs.
Fig 7. NBT assay.
Level of Amadori adducts in IgG + 5 mM glucose (open square), IgG + 10 mM glucose (open triangle), IgG + 5 mM glucose + 6.67 μM MGO (filled square) and IgG + 10 mM glucose + 6.67 μM MGO (filled triangle).
3.9 Estimation of hydroxymethyl furfural (HMF) in native and modified-IgG samples
Treatment of Amadori adducts with weak acids (oxalic acid or acetic acid) yields HMF which react with thiobarbituric acid (TBA) and forms a derivative which shows the λmax at 443 nm [45]. The assay measures the amount of ketoamine which is released upon hydrolysis as 5-hydroxymethyl furfural (HMF). The highest amount of HMF was released from IgG modified by methylglyoxal in high glucose (Figure D in S1 File).
3.10 Thermal denaturation profile of native and MGO-modified IgG in presence of glucose
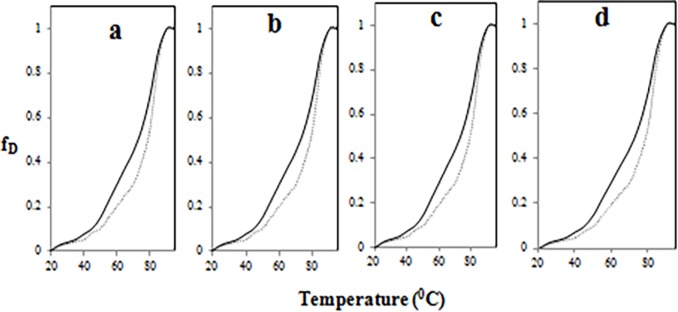
Heat-induced structural transitions in native and modified-IgG samples was monitored at 280 nm by heating at 1°C/min using Peltier device. The increase in absorbance at 280 nm was taken as a measure of denaturation. The melting temperature (Tm) of the native IgG was calculated to be 72.5°C (Fig 8A–8D). The data in (Fig 8A–8D) suggests that the modification introduced by glucose and/or methylglyoxal has lead to structural reorganization and the molecule (IgG) has gained stability.
Fig 8. Thermal denaturation.
Melting profiles of native (bold line in each), IgG + 5 mM glucose (dotted line in Fig a), IgG + 10 mM glucose (dotted line in Fig b), IgG + 5 mM glucose + 6.67 μM MGO (dotted line in Fig c) and IgG + 10 mM glucose + 6.67 μM MGO (dotted line in Fig d).
3.11 Aggregates detection by Congo red and Thioflavin T
The λmax of Congo red dye is significantly enhanced when bound by protein aggregates [46]. When native IgG was incubated with dye no meaningful change in λmax was observed (Figure E in S1 File).However, under identical conditions the dye showed enhancement and shift in its λmax when bound by glucose and MGO-modified counterparts of IgG. The findings indicate presence of aggregates. Further evidence of aggregates formation came from enhancement in the emission intensities of modified-counterparts of IgG mixed with Thioflavin T (ThT) (Figure F in S1 File). Thioflavin T has been used for aggregates detection [47].
3.12 SEM and TEM analysis of native and modified-IgG sample
Native IgG visualized under scanning electron microscope (SEM) looked like a rod (Fig 9A), while IgG dissolved in normal and high glucose appeared as aggregates as shown by their morphology in SEM (Fig 9B–9D) and when treated with methylglyoxal the formation of aggregates got augmented and thus it appeared as large aggregates as revealed by SEM images (Fig 9C–9E). The findings suggest that methylglyoxylation of sweet IgG may led to aggregate formation, which was also shown by Congo red and Thioflavin T binding assay, respectively.
Fig 9. Scanning electron microscopy.
SEM images of native IgG (a),IgG + 5 mM glucose (b), IgG + 5 mM glucose + 6.67 μM MGO (c),IgG + 10 mM glucose (d) and IgG + 10 mM glucose + 6.67 μM MGO (e). All magnification at 1500 x and at an acceleration voltage of 15 kV.
Furthermore, under transmission electron microscope the native IgG appeared as stretch of globules (Fig 10A), while low and high glucose versions of modified IgG appeared as extended branched protein networks with large surface area and amorphous and irregular in shape (Fig 10B–10D); branching and surface area of these aggregates further got extended in presence of methylglyoxal which shows increased formation of aggregates as also revealed by SEM images (Fig 10C–10E).
Fig 10. Transmission electron microscopy.
TEM images of native IgG (a), IgG + 5 mM glucose (b), IgG + 5 mM glucose + 6.67 μM MGO (c), IgG + 10 mM glucose (d) and IgG + 10 mM glucose + 6.67 μM MGO (e). All magnification at 60000 x and at an acceleration voltage of 200 kV.
4. Discussion
Dicarbonyls, such as methylglyoxal and glyoxal, are excessively formed in diabetes mellitus patients. Upon reaction with proteins the dicarbonyls generate advanced glycation end product (AGEs) which may cause diabetic retinopathy, nephropathy, neuropathy, rheumatoid arthritis etc [48–51]. Participation of modified-IgG in autoimmune disorders (especially rheumatoid arthritis) has been reported by several authors [52].
IgG incubated with glucose and/or MGO showed decrease in ε-amino groups. This may be attributed to blocking of ε-amino groups by MGO. The hyperchromicities shown by modified-IgG samples in presence of normal glucose, high glucose and/or MGO may be due to enhanced exposure of chromophoric aromatic amino acid residues which were otherwise buried in case of native IgG [53]. Furthermore, the increased absorbance that we observed between 300–400 nm in modified IgG samples indicates aggregate formation [23]. Positive results with Congo red and ThT dyes and typical features observed under SEM and TEM strongly support aggregate formation. It has been suggested that the aggregates may lead to various pathological conditions, collectively known as proteopathies [54].
The observed quenching in tryptophan fluorescence of modified-IgG samples after its excitation at 285 nm may be due to modification of its microenvironment/ loss of tryptophan. A similar observation has been reported by Iram et al [55] when haemoglobin was modified by glyoxal. Furthermore, increase in emission intensity of modified-IgG samples after excitation at 370 nm suggest presence of fluorogenic AGEs, such as pentosidine, crossline etc. [56].
IgG modified by glucose and/or MGO generated Amadori products and was confirmed by NBT dye and HMF [57, 58]. This further underwent rearrangement reaction such as cyclization, condensation etc. and formed AGEs. Furthermore, increase in protein carbonyl and decrease in sulfhydryl suggests that the reaction has produced oxidative stress in the system [59, 60].
Changes in 20 structure of modified-IgG samples was indicated by shift in position of amide I and amide II band position observed in FT-IR spectra which was due to C = O stretching and N-H bending bond vibration [61]. The thermostability shown by modified-IgG samples may be due to increase in disulphide/formation of cross links as a consequence of oxidative stress which occurred during the modification and reflected as increase in protein carbonyl and decrease in free sulfhydryl.
5. Conclusion
Results of the present study suggest that methylglyoxal can cause more damage to IgG in high glucose compared to low glucose and the damage can lead to aggregation. Since aggregates are immunogenic, some patients of diabetes mellitus may develop features of rheumatoid arthritis.
Supporting information
Fig A. Absorbance study. UV absorption spectra of native IgG (closed square) isolated from a healthy human serum on protein A-agarose affinity matrix. Inset: SDS-gel photograph of purified IgG on 7.5% polyacrylamide gel. Fig B. TNBS assay. Estimation of ε-amino groups in native IgG (black bar), IgG + 5 mM glucose (red), IgG + 5 mM glucose + 6.67 μM MGO (green), IgG + 10 mM glucose (blue), and IgG + 10 mM glucose + 6.67 μM MGO (purple). Each bar represents the mean ± S.D. of three independent assays in similar experimental conditions. * p < 0.05 was considered as statistically significant as compared to native IgG with each modified group. Fig C. DTNB assay. Free sulfhydryl in native IgG (black bar), IgG + 5 mM glucose (red), IgG + 5 mM glucose + 6.67 μM MGO (green), IgG + 10 mM glucose (blue) and IgG + 10 mM glucose + 6.67 μM MGO (purple). Each bar represents the mean ± S.D. of three independent assays in similar experimental conditions. * p < 0.05 was considered as statistically significant as compared to native IgG with each modified group. Fig D. HMF assay. Hydroxymethylfurfural content in native IgG (black), IgG + 5 mM glucose (red), IgG + 5 mM glucose + 6.67 μM MGO (green), IgG + 10 mM glucose (blue) and IgG + 10 mM glucose + 6.67 μM MGO (purple). Each bar represents the mean ± S.D. of three independent assays in similar experimental conditions. * p < 0.05 was considered as statistically significant as compared to native IgG with each modified group. Fig E. Congo Red binding assay. Absorption profile of Congo red (open square) bound to: native IgG (open triangle), IgG + 5 mM glucose (open circle), IgG + 10 mM glucose (filled square), IgG + 5 mM glucose + 6.67 μM MGO (filled triangle) and IgG + 10 mM glucose + 6.67 μM MGO (filled circle).Fig F. Thioflavin T binding assay. Emission profile of Thioflavin T bound to native IgG (filled circle), IgG + 5 mM glucose (filled triangle), IgG + 10 mM glucose (filled square), IgG + 5 mM glucose + 6.67 μM MGO (open triangle) and IgG + 10 mM glucose + 6.67 μM MGO (open square). All samples were excited at 435 nm.
(DOCX)
Acknowledgments
MAK is thankful to the CSIR, New Delhi for NET-Junior/Senior Research Fellowship awarded vide letter no. 09/112 (0506)/2013-EMR-I. Authors are thankful to the USIF of the AMU for SEM and TEM, as well as the instruments facilities of the “DST-FIST” program.Authors are thankful to Dr. Mohd Abrar for editing the manuscript for language usage, spelling and grammar.
Abbreviations
- IgG
Immunoglobulin G
- MGO
Methylglyoxal
- AGEs
Advanced glycation end-products
- SEM
Scanning electron microscope
- TEM
Transmission electron microscope
- ANS
8-anilinonaphthalene-1-sulfonic acid
- DNPH
2,4-Dinitrophenylhydrazine
- FT-IR
Fourier transform infrared spectroscopy
- DTNB
5,5’-Dithiobis-(2-nitrobenzoic acid)
- NBT
Nitroblue tetrazolium
Data Availability
All relevant data are within the paper and its Supporting Information file.
Funding Statement
MAK is thankful to the CSIR, New Delhi for NET-Junior/Senior Research Fellowship awarded vide letter no. 09/112 (0506)/2013-EMR-I.The major part of the work was supported by an Indian Council of Medical Research, New Delhi research grant no. 61/01/2011-BMS to KA. The funders had no role in study design, data collection and analysis, decision to publish, or preparation of the manuscript.
References
- 1.Schrijvers BF, De Vriese AS, Flyvbjerg A. From hyperglycemia to diabetic kidney disease: the role of metabolic, hemodynamic, intracellular factors and growth factors/ cytokines. Endocr. Rev. 2004; 25: 971–1010. doi: 10.1210/er.2003-0018 [DOI] [PubMed] [Google Scholar]
- 2.Paolino AS, Garner KM. Effects of hyperglycemia on neurologic outcome in stroke patients. J. Neurosci. Nurs. 2005; 37: 130–135. [DOI] [PubMed] [Google Scholar]
- 3.Davidson JA, Parkin CG. Is hyperglycemia a casual factor in cardiovascular disease? Diabetes Care. 2009; 32: S331–S333. [DOI] [PMC free article] [PubMed] [Google Scholar]
- 4.Pistrosch F, Natali A, Hanefeld M. Is hyperglycaemia a cardiovascular risk factor? Diabetes Care. 2011; 34: S128–S131. doi: 10.2337/dc11-s207 [DOI] [PMC free article] [PubMed] [Google Scholar]
- 5.Wiemer NGM, Eekhoff EMW, Simsek S, Hiene RJ, Ringens PJ, Polak BCP, et al. The effect of acute hyperglycemia on retinal thickness and ocular refraction in healthy subjects. Graefes. Arch. Clin. Exp. Ophthalmol. 2008; 246: 703–708. doi: 10.1007/s00417-007-0729-8 [DOI] [PMC free article] [PubMed] [Google Scholar]
- 6.Cade WT. Diabetes-related microvascular and macrovascular diseases in the physical therapy setting. Phys. Ther. 2008; 88: 1322–1335. doi: 10.2522/ptj.20080008 [DOI] [PMC free article] [PubMed] [Google Scholar]
- 7.Ardigo D, Valtuena S, Zavaroni I, Baroni MC, Delsignore R. Pulmonary complications in diabetes mellitus: the role of glycaemic control. Curr. Drugs Targets Inflamm. Allergy. 2004; 3: 455–458. [DOI] [PubMed] [Google Scholar]
- 8.Price CL, Knight SC. Methylglyoxal: possible link between hyperglycaemia and immune suppression? Trends Endocrin. Met. 2009; 20: 312–317. [DOI] [PubMed] [Google Scholar]
- 9.Kim I, Kim OS, Kim CS, Sohn E, Jo K, Kim JS. Accumulation of argpyrimidine, a methylglyoxal-derived advanced glycation end product, increases apoptosis of lens epithelial cells both in vitro and in vivo. Exp. Mol. Med. 2012; 44: 167–175. doi: 10.3858/emm.2012.44.2.012 [DOI] [PMC free article] [PubMed] [Google Scholar]
- 10.Miyata T, Ishiguro N, Yasuda Y. Increased pentosidine, an advanced glycation end product, in plasma and synovial fluid from patients with rheumatoid arthritis and its relation with inflammatory markers. Biochem. Biophys. Res. Commun. 1998; 244: 45–49. doi: 10.1006/bbrc.1998.8203 [DOI] [PubMed] [Google Scholar]
- 11.Obayashi H, Nakano K, Shiqeta H, Yamaquchi M, Yoshimori K, Fukui M, et al. Formation of crossline as a fluorescent advanced glycation end product in vitro and in vivo. Biochem. Biophys. Res. Commun. 1996; 226: 37–41. doi: 10.1006/bbrc.1996.1308 [DOI] [PubMed] [Google Scholar]
- 12.Hegab Z, Gibbons S, Neyses L, Mamas MA. Role of advanced glycation end products in cardiovascular disease. World J. Cardiol. 2012; 4: 90–102. doi: 10.4330/wjc.v4.i4.90 [DOI] [PMC free article] [PubMed] [Google Scholar]
- 13.Heilmann M, Wellner A, Gadermaier G, Iichmann A, Briza P, Krause M, et al. Ovalbumin modified with pyrraline, a Maillard reaction product, shows enhanced T-cell immunogenicity. J. Biol. Chem. 2014; 289: 7919–7928. doi: 10.1074/jbc.M113.523621 [DOI] [PMC free article] [PubMed] [Google Scholar]
- 14.Wang Z, Ziang Y, Liu N, Ren L, Zhu Y, An Y, et al. Advanced glycation end product Nε–carboxymethyl lysine accelerates progression of atherosclerotic calcification in diabetes. Atherosclerosis. 2012; 22: 387–396. [DOI] [PubMed] [Google Scholar]
- 15.Thornalley PJ, Langborg A, Minhas HS. Formation of glyoxal, methylglyoxal and 3-deoxyglucosone in the glycation of proteins by glucose. Biochem. J. 1999; 344: 109–116. [PMC free article] [PubMed] [Google Scholar]
- 16.Allaman I, Belanger M, Magistretti PJ. Methylglyoxal, the dark side of glycolysis. Front. Neurosci. 2015; 9: 1–12. [DOI] [PMC free article] [PubMed] [Google Scholar]
- 17.Silva MS, Gomes RA, Ferreira AE, Freire AP, Cordeiro C. The glyoxalase pathway: the first hundred years and beyond. Biochem. J. 2013; 453: 1–15. doi: 10.1042/BJ20121743 [DOI] [PubMed] [Google Scholar]
- 18.Paulo M, Cristina S, Raquel S. Methylglyoxal, obesity and diabetes. Endocrine. 2013; 43: 472–484. doi: 10.1007/s12020-012-9795-8 [DOI] [PubMed] [Google Scholar]
- 19.Mannik M, Person RE. Immunoglobulin G and serum albumin isolated from the articular cartilage of patients with rheumatoid arthritis or osteoarthritis contain covalent heteropolymers with proteoglycans. Rheumatol. Int. 1993; 13:121–129. [DOI] [PubMed] [Google Scholar]
- 20.Bliesener RD, Gerbitz KD. Impairment by glycation of immunoglobulin G Fc fragment function. Scand. J. Clin. Lab. Invest. 1990; 50: 739–746. [DOI] [PubMed] [Google Scholar]
- 21.Pampati PK, Suravajjala S, Dain JA. Monitoring nonenzymatic glycation of immunoglobulin G by methylglyoxal and glyoxal: a spectroscopic study. Anal. Biochem. 2011; 408: 59–63. doi: 10.1016/j.ab.2010.08.038 [DOI] [PMC free article] [PubMed] [Google Scholar]
- 22.Mankarious S, Lee M, Fischer S, Pyun KH, Ochs HD, Oxelius VA, et al. The half-lives of IgG subclasses and specific antibodies in patients with primary immunodeficiency who are receiving intravenously administered immunoglobulin. J. Lab. Clin. Med. 1988; 112: 634–640. [PubMed] [Google Scholar]
- 23.Arfat MY, Ashraf JM, Arif Z, Moinuddin, Alam K. Fine characterization of glucosylated human IgG by biochemical and biophysical methods. Int. J. Biol. Macromol. 2014; 69:408–15. doi: 10.1016/j.ijbiomac.2014.05.069 [DOI] [PubMed] [Google Scholar]
- 24.Kaneshige H. Nonenzymatic glycosylation of serum IgG and its effect on antibody activity in patients with diabetes mellitus. Diabetes. 1987; 36: 822–828. [DOI] [PubMed] [Google Scholar]
- 25.Ercan A, Cui J, Chatterton DEW, Deane KD, Hazen MM, Brintnell W, et al. IgG galactosylation aberrancy precedes disease onset, correlates with disease activity and is prevalent in autoantibodies in rheumatoid arthritis. Arthritis Rheum. 2010; 62: 2239–2248. doi: 10.1002/art.27533 [DOI] [PMC free article] [PubMed] [Google Scholar]
- 26.Goding JW. Use of staphylococcal protein A as an immunological reagent. J. Immunol. Methods. 1978; 20: 241–253. [DOI] [PubMed] [Google Scholar]
- 27.Shaklai N, Garlick RL, Bunn HF. Nonenzymatic glycosylation of human serum albumin alters its conformation and function. J. Biol. Chem. 1984; 259: 3812–3817. [PubMed] [Google Scholar]
- 28.Yanagisawa K, Makita Z, Shiroshita K, Ueda T, Fusegawa T, Kuwajima S, et al. Specific fluorescence assay for advanced glycation end products in blood and urine of diabetic patients. Metabolism. 1998; 47: 1348–1353. [DOI] [PubMed] [Google Scholar]
- 29.Hashimoto C, Iwaihara Y, Chen SJ, Tanaka M, Watanabe T, Matsui T. Highly sensitive detection of free advanced glycation end products by liquid chromatography-electrospray ionization-tandem mass spectrometry with 2,4,6-trinirobenzene sulfonate derivatization. Anal. Chem. 2013; 85: 4289–4295. doi: 10.1021/ac400294q [DOI] [PubMed] [Google Scholar]
- 30.Cardamone M, Puri NK. Spectrofluorimetric assessment of the surface hydrophobicity of proteins. Biochem. J. 1992; 282: 589–593. [DOI] [PMC free article] [PubMed] [Google Scholar]
- 31.Levine RL, Garland D, Oliver CN, Amici A, Climent I, Lenz AG, et al. Determination of carbonyl content in oxidatively modified proteins. Methods Enzymol. 1990; 186: 464–478. [DOI] [PubMed] [Google Scholar]
- 32.Kumosinski TF, Unruh JJ. Quantitation of the global secondary structure of globular proteins by FTIR spectroscopy: comparison with X-ray crystallographic structure. Talanta. 1996; 43: 199–219. doi: 10.1016/0039-9140(95)01726-7 [DOI] [PubMed] [Google Scholar]
- 33.Ellman G.L. Tissue sulfhydryl groups. Arch. Biochem. Biophys. 1959; 82: 70–77. [DOI] [PubMed] [Google Scholar]
- 34.Baker JR, Zyzak DV, Thorpe SR, Baynes JW. Mechanism of fructosamine assay: evidence against role of superoxide as intermediate in nitroblue tetrazolium reduction. Clin. Chem. 1993; 39: 2480–2485. [PubMed] [Google Scholar]
- 35.Ney KA, Colley KJ, Pizzo SV. The standardization of the thiobarbituric acid assay for nonenzymatic glucosylation of human serum albumin. Anal. Biochem. 1981; 18: 294–300. [DOI] [PubMed] [Google Scholar]
- 36.Frid P, Anisimov SV, Popovic N. Congo red and protein aggregation in neurodegenerative diseases. Brain Res. Rev. 2007; 53: 135–160. doi: 10.1016/j.brainresrev.2006.08.001 [DOI] [PubMed] [Google Scholar]
- 37.Hudson SA, Ecroyd H, Kee TW, Carver JA. The thioflavin T fluorescence assay for amyloid fibril detection can be biased by the presence of exogenous compounds. FEBS J. 2009; 276: 5960–5972. doi: 10.1111/j.1742-4658.2009.07307.x [DOI] [PubMed] [Google Scholar]
- 38.Vivian JT, Callis PR. Mechanisms of tryptophan fluorescence shifts in proteins. Biophys. J. 2001; 80: 2093–2109. doi: 10.1016/S0006-3495(01)76183-8 [DOI] [PMC free article] [PubMed] [Google Scholar]
- 39.Olar LE, Stefan R, Berce C, Ciobanu D, Papuc I. The fluorescence identification of advanced glycation end products in streptozotocin–induced diabetic rats’ plasma samples. Bulletin UASVM Veterinary Medicine. 2015; 72: 100–109. [Google Scholar]
- 40.Sashidhar RB, Capoor AK, Ramana D. Quantitation of epsilon-amino group using amino acids as reference standards by trinitrobenzene sulfonic acid. A simple spectrophotometric method for the estimation of hapten to carrier protein ratio. J. Immunol. Methods. 1994; 167: 121–127. [DOI] [PubMed] [Google Scholar]
- 41.Pasdar NA, Li-Chan EC. Comparison of protein surface hydrophobicity measured at various pH values using three different fluorescent probes. J. Agric. Food Chem. 2000; 48: 328–334. [DOI] [PubMed] [Google Scholar]
- 42.Pradeep AR, Ramchandraprasad MV, Bajaj P, Rao NS, Agarwal E. Protein carbonyl: an oxidative stress marker in gingival crevicular fluid in healthy, gingivitis, and chronic periodontitis subjects. Contemp. Clin. Dent. 2013; 4: 27–31. doi: 10.4103/0976-237X.111589 [DOI] [PMC free article] [PubMed] [Google Scholar]
- 43.Manning MC. Use of infrared spectroscopy to monitor protein structure and stability. Expert. Rev. Proteomics. 2005; 2: 731–743. doi: 10.1586/14789450.2.5.731 [DOI] [PubMed] [Google Scholar]
- 44.Arif B, Ashraf JM, Moinuddin, Ahmad J, Arif Z, Alam K.Structural and immunological characterization of Amadori-rich human serum albumin: role in diabetes mellitus. Arch. Biochem. Biophys. 2012; 522: 17–25. doi: 10.1016/j.abb.2012.04.005 [DOI] [PubMed] [Google Scholar]
- 45.Sun Q, Faustman C, Senecal A, Wilkinson AL, Furr H. Aldehyde reactivity with 2-thiobarbituric acid and TBARS in freeze-dried beef during accelerated storage. Meat Sci. 2001; 57: 55–60. [DOI] [PubMed] [Google Scholar]
- 46.Bose PP, Chatterjee U, Xie L, Johansson J, Gothelid E, Arvidsson PI. Effects of Congo red on Aβ1–40 fibrilformation process and morphology. ACS Chem. Neurosci. 2010; 1: 315–324. doi: 10.1021/cn900041x [DOI] [PMC free article] [PubMed] [Google Scholar]
- 47.Biancalana M, Koide S. Molecular mechanisms of Thioflavin-T binding to amyloid fibrils. Biochim. Biophys. Acta. 2010; 1804: 1405–1412. doi: 10.1016/j.bbapap.2010.04.001 [DOI] [PMC free article] [PubMed] [Google Scholar]
- 48.Fokkens BT, Mulder DJ, Schalkwijk CG, Scheijen JL, Smit AJ, Los LI. Vitreous advanced glycation endproducts and α-dicarbonyls in retinal detachment patients with type 2 diabetes mellitus and non-diabetic controls. PLoS One. 2017; 12: doi: 10.1371/journal.pone.0173379 [DOI] [PMC free article] [PubMed] [Google Scholar]
- 49.Jensen TM, Vistisen D, Fleming T, Nawroth PP, Rossing P, Jorqensen ME, et al. Methylglyoxal is associated with changes in kidney function among individuals with screen-detected type 2 diabetes mellitus. Diabet. Med. 2016; 33: 1625–1631. doi: 10.1111/dme.13201 [DOI] [PubMed] [Google Scholar]
- 50.Spallone V. Might genetics play a role in understanding and treating diabetic polyneuropathy? Diabetes Metab. Res. Rev. 2017; 33: doi: 10.1002/dmrr.2882 [DOI] [PubMed] [Google Scholar]
- 51.Ahmed U, Thornalley PJ, Rabbani N. Possible role of methylglyoxal and glyoxalase in arthritis.Biochem. Soc. Trans. 2014; 42: 538–542. doi: 10.1042/BST20140024 [DOI] [PubMed] [Google Scholar]
- 52.Sokolove J, Johnson DS, Lahey LJ, Wagner CA, Cheng D, Thiele GM, et al. Rheumatoid factor as a potentiator of anti-citrullinated protein antibody-mediated inflammation in rheumatoid arthritis. Arthritis Rheumatol. 2014; 66: 813–821. doi: 10.1002/art.38307 [DOI] [PMC free article] [PubMed] [Google Scholar]
- 53.Traverso N, Menini S, Cottalasso D, Odetti P, Marinari UM, Pronzato MA. Mutual interaction between glycation and oxidation during non-enzymatic protein modification. Biochim. Biophys. Acta. 1997; 1336: 409–418. [DOI] [PubMed] [Google Scholar]
- 54.Moreau KL, King JA. Protein misfolding and aggregation in cataract disease and prospects for prevention. Trends Mol. Med. 2012; 18: 273–282. doi: 10.1016/j.molmed.2012.03.005 [DOI] [PMC free article] [PubMed] [Google Scholar]
- 55.Iram A, Alam T, Khan JM, Khan TA, Khan RH, Naeem A. Molten globule of hemoglobin proceeds into aggregates and advanced glycated end products. PLoS One. 2013; 8: doi: 10.1371/journal.pone.0072075 [DOI] [PMC free article] [PubMed] [Google Scholar]
- 56.Mustafa MF, Bano B.Glycation of liver cystatin: implication on its structure and function. J. Fluoresc. 2016; 26: 1743–1753. doi: 10.1007/s10895-016-1866-4 [DOI] [PubMed] [Google Scholar]
- 57.Faisal M, Alatar AA, Ahmad S. Immunoglobulin-G glycation by fructose leads to structural perturbations and drop off in free lysine and arginine residues. Protein Pept. Lett. 2017; 24: 241–244. doi: 10.2174/0929866524666170117142723 [DOI] [PubMed] [Google Scholar]
- 58.Pamplona R, Bellmunt MJ, Portero M, Riba D, Prat J. Chromatographic evidence for amadori product formation in rat liver aminophospholipids. Life Sci. 1995; 57: 873–879. [DOI] [PubMed] [Google Scholar]
- 59.Yilmaz Z, Kalaz EB, Avdin AF, Soluk-Tekkesin M, Doqru- Abbasoqlu S, Uysal M et al. The effect of carnosine on methylglyoxal-induced oxidative stress in rats. Arch. Physiol. Biochem. 2017; 123; 192–198. doi: 10.1080/13813455.2017.1296468 [DOI] [PubMed] [Google Scholar]
- 60.Elosta A, Slevin M, Rahman K, Ahmed N. Aged garlic has more potent antiglycation and antioxidant properties compared to fresh garlic extract in vitro. Sci. Rep. 2017; 7: doi: 10.1038/srep39613 [DOI] [PMC free article] [PubMed] [Google Scholar]
- 61.Ashraf JM, Rabbani G, Ahmad S, Hasan Q, Khan RH, Alam K, Glycation of H1 histone by 3-deoxyglucosone: effects on protein structure and generation of different advanced glycation end products. PLoS One. 2015; 10: 1–15. [DOI] [PMC free article] [PubMed] [Google Scholar]
Associated Data
This section collects any data citations, data availability statements, or supplementary materials included in this article.
Supplementary Materials
Fig A. Absorbance study. UV absorption spectra of native IgG (closed square) isolated from a healthy human serum on protein A-agarose affinity matrix. Inset: SDS-gel photograph of purified IgG on 7.5% polyacrylamide gel. Fig B. TNBS assay. Estimation of ε-amino groups in native IgG (black bar), IgG + 5 mM glucose (red), IgG + 5 mM glucose + 6.67 μM MGO (green), IgG + 10 mM glucose (blue), and IgG + 10 mM glucose + 6.67 μM MGO (purple). Each bar represents the mean ± S.D. of three independent assays in similar experimental conditions. * p < 0.05 was considered as statistically significant as compared to native IgG with each modified group. Fig C. DTNB assay. Free sulfhydryl in native IgG (black bar), IgG + 5 mM glucose (red), IgG + 5 mM glucose + 6.67 μM MGO (green), IgG + 10 mM glucose (blue) and IgG + 10 mM glucose + 6.67 μM MGO (purple). Each bar represents the mean ± S.D. of three independent assays in similar experimental conditions. * p < 0.05 was considered as statistically significant as compared to native IgG with each modified group. Fig D. HMF assay. Hydroxymethylfurfural content in native IgG (black), IgG + 5 mM glucose (red), IgG + 5 mM glucose + 6.67 μM MGO (green), IgG + 10 mM glucose (blue) and IgG + 10 mM glucose + 6.67 μM MGO (purple). Each bar represents the mean ± S.D. of three independent assays in similar experimental conditions. * p < 0.05 was considered as statistically significant as compared to native IgG with each modified group. Fig E. Congo Red binding assay. Absorption profile of Congo red (open square) bound to: native IgG (open triangle), IgG + 5 mM glucose (open circle), IgG + 10 mM glucose (filled square), IgG + 5 mM glucose + 6.67 μM MGO (filled triangle) and IgG + 10 mM glucose + 6.67 μM MGO (filled circle).Fig F. Thioflavin T binding assay. Emission profile of Thioflavin T bound to native IgG (filled circle), IgG + 5 mM glucose (filled triangle), IgG + 10 mM glucose (filled square), IgG + 5 mM glucose + 6.67 μM MGO (open triangle) and IgG + 10 mM glucose + 6.67 μM MGO (open square). All samples were excited at 435 nm.
(DOCX)
Data Availability Statement
All relevant data are within the paper and its Supporting Information file.


