ABSTRACT
Residual viremia is common during antiretroviral therapy (ART) and could be caused by ongoing low-level virus replication or by release of viral particles from infected cells. ART intensification should impact ongoing viral propagation but not virion release. Eighteen acutely infected men were enrolled in a randomized controlled trial and monitored for a median of 107 weeks. Participants started ART with (n = 9) or without (n = 9) intensification with maraviroc (MVC) within 90 days of infection. Levels of HIV DNA and cell-free RNA were quantified by droplet digital PCR. Deep sequencing of C2-V3 env, gag, and pol (454 Roche) was performed on longitudinally collected plasma and peripheral blood mononuclear cell (PBMC) samples while on ART. Sequence data were analyzed for evidence of evolution by (i) molecular diversity analysis, (ii) nonparametric test for panmixia, and (iii) tip date randomization within a Bayesian framework. There was a longitudinal decay of HIV DNA after initiation of ART with no difference between MVC intensification groups (−0.08 ± 0.01 versus −0.09 ± 0.01 log10 copies/week in MVC+ versus MVC− groups; P = 0.62). All participants had low-level residual viremia (median, 2.8 RNA copies/ml). Across participants, medians of 56 (interquartile range [IQR], 36 to 74), 29 (IQR, 25 to 35), and 40 (IQR, 31 to 54) haplotypes were generated for env, gag, and pol regions, respectively. There was no clear evidence of viral evolution during ART and no difference in viral diversity or population structure from individuals with or without MVC intensification. Further efforts focusing on elucidating the mechanism(s) of viral persistence in various compartments using recent sequencing technologies are still needed, and potential low-level viral replication should always be considered in cure strategies.
IMPORTANCE Residual viremia is common among HIV-infected people on ART. It remains controversial if this viremia is a consequence of propagating infection. We hypothesized that molecular evolution would be detectable during viral propagation and that therapy intensified with the entry inhibitor maraviroc would demonstrate less evolution. We performed a randomized double-blinded treatment trial with 18 acutely infected men (standard ART versus standard ART plus maraviroc). From longitudinally collected blood plasma and cells, levels of HIV DNA and cell-free HIV RNA were quantified by droplet digital PCR, and HIV DNA (env, gag, and pol coding regions) was deep sequenced (454 Roche). Investigating people who started ART during the earliest stages of their HIV infection, when viral diversity is low, provides an opportunity to detect evidence of viral evolution. Despite using a battery of analytical techniques, no clear and consistent evidence of viral propagation for over 90 weeks of observation could be discerned.
KEYWORDS: ART intensification, evolution, HIV, maraviroc, reservoir
INTRODUCTION
Adherence to current antiretroviral therapy (ART) results in undetectable plasma viral loads and prolonged life in infected individuals, but it cannot cure HIV infection (1–4). The virus persists in a latent state, only to reemerge when ART is interrupted (3, 5–7). The level of this provirus population appears remarkably stable, even during ART (8–10). Persistent HIV replication at low levels during ART, which may contribute to the stability of the HIV reservoir, has been described (9, 10), while other reports suggest that the lack of genetic structure of HIV populations during ART argues against ongoing residual replication (11–15). Further, studies with intensification of an ART regimen with an integrase inhibitor have shown transient changes in episomal DNA and cell-associated DNA, suggesting persistent viral replication despite ART in HIV-infected individuals with ongoing immune activation that may contribute to persistent immune dysfunction (16, 17). Overall, however, ART intensification studies also consistently showed no impact on levels of HIV viremia (18, 19), and other studies have found that the HIV reservoir remains stable without evidence of residual replication (11).
If the HIV reservoir were stable because it is being replenished by residual propagating replication, then viral evolution should be observed in HIV DNA populations (see reviews in references 20 and 21). To assess this hypothesis, several groups have studied the temporal structure of HIV DNA sequences during ART. A majority of studies have documented the lack of viral evolution during ART (11, 13, 15), although dissenting results have been reported (22). There are several reasons why controversy remains, like differences in sampling, sequencing, analysis, and study populations. An obvious issue is trying to identify evolution among HIV-infected people who started their ART during chronic infection. Investigating viral evolution during ART initiated later during a person's infection may lead to confounding results, as the pre-ART effective population size will be larger and is likely to decrease after delayed ART introduction. This confounding would impact estimates of viral diversity and evolution. In this study, we tried to alleviate these potential issues by investigating people who started ART during acute infection when the effective population size is limited, thus reducing the risk of sampling issues impacting inference of evolution. We also conducted the study in the setting of a randomized control trial of maraviroc (MVC) intensification of ART, since treatment intensification with MVC has been associated with faster reduction of 2-long terminal repeat (2-LTR) newly infected cells (23).
RESULTS
This study evaluated a homogeneous group of 18 men who started the same ART regimen plus either MVC (MVC+; n = 9) or placebo (MVC−; n = 9) within a median of 35 days (interquartile range [IQR], 28 to 85) from their estimated date of infection (EDI). A summary of baseline variables is provided in Table 1.
TABLE 1.
Population characteristicsa
| Parameter | All participants (n = 18) | Maraviroc intensification (n = 9) | Standard ART regimen (n = 9) | P valuec |
|---|---|---|---|---|
| Age (yr) | 30 (24, 40.3) | 26 (23, 42.5) | 32 (26, 40.5) | 0.62 |
| Median time from EDIb to ART start, in days (IQR) | 35 (28, 85) | 81 (28, 91) | 33 (26, 85) | 0.37 |
| Time from ART to viral suppression, in days (IQR) | 84 (33–113) | 84 (21–139) | 77 (44–112) | 0.98 |
| Median CD4 count at baseline, cells/mm3 (IQR) | 622.5 (446.8, 760) | 656 (481, 849) | 557 (443.5, 644.5) | 0.43 |
| Median HIV RNA levels at baseline, log10 copies/ml (IQR) | 4.7 (3.7, 5.5) | 4.4 (3.3, 6.7) | 4.9 (4, 5.4) | 0.93 |
| Median duration of follow up, in days (IQR) | 749 (681, 807) | 736 (673, 817) | 761 (676, 834) | 0.86 |
| Median HIV DNA levels at baseline, in copies/1E6 cells (IQR) | 536 (157–902) | 240 (147–773) | 633 (148–912) | 0.60 |
| Median no. of haplotypes (IQR) | 129 (102–150) | 129 (98–140) | 136 (103–179) | 0.43 |
| env | 56 (36–74) | 51 (36–69) | 72 (41–78) | 0.29 |
| gag | 29 (25–35) | 26 (22–39) | 29 (26–34) | 0.68 |
| pol | 40 (31–54) | 46 (30–51) | 37 (31–59) | 0.84 |
Median with IQR values are shown for the entire cohort and by groups defined by maraviroc intensification (MVC+ versus MVC−).
EDI, estimated date of infection.
P values were determined by a two-tailed Mann-Whitney or Fisher exact test.
The median age at enrollment was 30 years (IQR, 24 to 40), and all were men who reported sex with other men as their HIV risk factor. From our previous study, there was no difference in CD4+ T cell counts between participants who received MVC and those who did not (656 cells/mm3 versus 557 cells/mm3; P = 0.43), although all participants experienced increases in circulating memory CD4+ T cells (mean increase of 326 cells/mm3 [IQR, 150,356] between weeks 0 and 48; P = 0.01) (24). Also, the HIV RNA levels at baseline did not differ between MVC+ and MVC− groups, with a median of 4.4 log10 copies/ml versus 4.9 log10 HIV RNA copies/ml. All participants initiated ART within 2 weeks of collection of baseline sample and were monitored for a median of 107 weeks (IQR, 97, 115 weeks) thereafter. The median time to HIV RNA level below 50 copies/ml in blood plasma (Abbott m2000 real-time HIV test) was 84 days (IQR, 33 to 113) after starting ART. There was no difference in time to reaching <50 copies/ml between MVC study arms, and all but one participant (S4; 227 HIV RNA copies/ml at week 126 after ART initiation) had no detectable viral load of >50 copies/ml thereafter. The median level of HIV RNA in plasma by single-copy assay was 2.8 HIV RNA copies/ml (IQR, 1.9 to 7.9 copies/ml) with no difference between MVC groups (median, 4 copies/ml in MVC+ versus 2 copies/ml in MVC−; P = 0.28). All individuals had R5 tropic-only infections by phenotypic prediction before the initiation of ART and genotypic prediction thereafter.
HIV DNA levels.
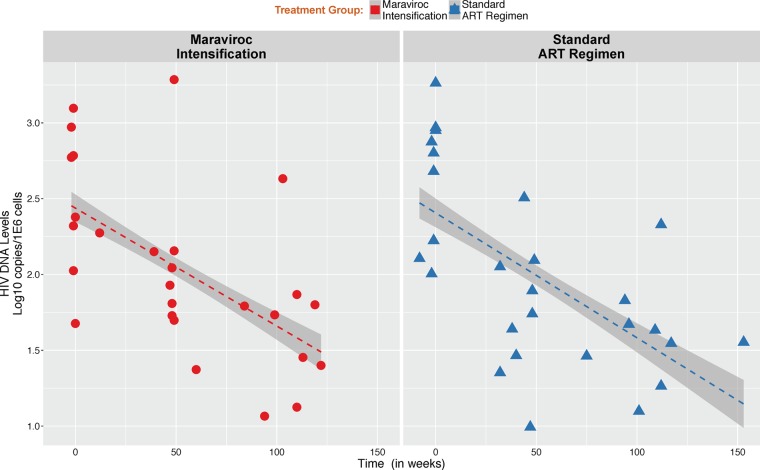
The median level of HIV DNA at the time of the initiation of ART did not differ between MVC study arms (P = 0.61) (Table 1). There was a significant longitudinal decay of HIV DNA after starting ART across participants (mean decay of −0.082 ± 0.01 log10 copies/106 cells/week; P < 0.01) but no difference between MVC intensification groups (−0.077 ± 0.01 log10 copies/106 cells/week in MVC+ versus −0.086 ± 0.01 log10 copies/106 cells/week in MVC−; P = 0.62) (Fig. 1).
FIG 1.
Change in HIV DNA levels during antiretroviral therapy. HIV DNA levels are expressed in log10 copies per 1E6 cells. Red vertical dotted line indicates the time of ART initiation. There was no statistical difference in the rate of decrease between groups by maraviroc intensification (MVC+ [red] versus MVC− [blue]).
Analysis of lymphocyte subsets.
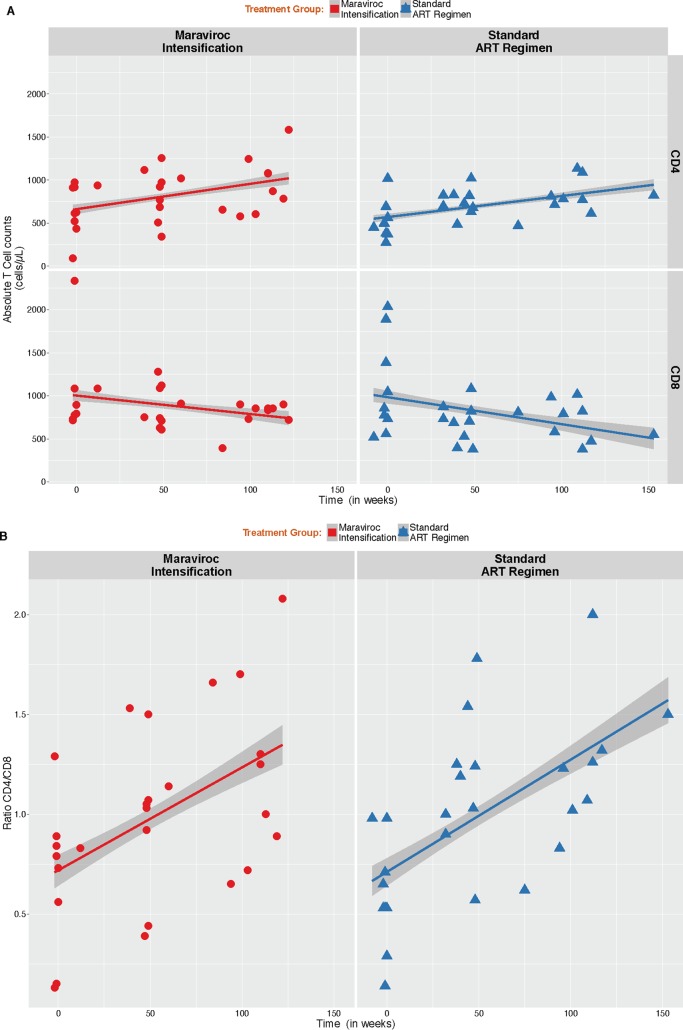
We observed a significant increase of the absolute CD4+ T cell counts (mean increase of 10.9 ± 1.9 CD4 T cells/μl/month; P < 0.001) associated with a decrease in the absolute counts of CD8+ T cells (mean decrease of −11 ± 4.2 CD8 T cells/μl/month; P = 0.009), with no difference between groups (P values of 0.79 and 0.70, respectively) (Fig. 2A). Similarly, we observed a significant increase in CD4/CD8 ratio during the course of infection (mean increase of 0.02 ± 0.003 CD4/CD8 ratio/month; P < 0.001) with no difference between groups (P = 0.88) (Fig. 2B).
FIG 2.
Analysis of lymphocyte subsets. (A) Dynamics of absolute CD4+ and CD8+ T cells. There was a significant increase of CD4+ T cell counts over time associated with a decrease in the absolute counts of CD8+ T cells. No significant difference between MVC+ and MVC− groups were observed for CD4+ and CD8+ T cell counts or CD4/CD8 ratio. (B) Dynamics of CD4/CD8 ratio. There was a significant increase in CD4/CD8 ratio during the course of infection.
Sequence recovery.
Deep-sequence data were generated for HIV-1 env (C2-V3), gag, and partial pol. Deep sequencing was successful for all but 1 region in 4 samples (50/54 regions, 92.6%) with a median of 13,681 (IQR, 4,096, 21,621) raw reads per peripheral blood mononuclear cell (PBMC) sample. From these reads, a median of 56 (IQR, 36 to 74), 29 (IQR, 25 to 35), and 40 (IQR, 31 to 54) haplotypes were generated from env, gag, and pol, respectively, with no difference between MVC groups.
Inference of viral evolution.
To assess the temporal structure of the longitudinally collected samples (i.e., evidence for viral evolution), we applied a multistep approach. If ongoing viral evolution occurred during ART, we would expect to document all of the following: (i) increased average pairwise distance (APD) over time, (ii) significant P value for test of panmixia, suggestive of divergence over time, (iii) divergent viral populations in the phylogenies, and (iv) evidence of a molecular clock signal with Bayesian approaches. Further, evidence of drug resistance or change from R5 tropism also might be present.
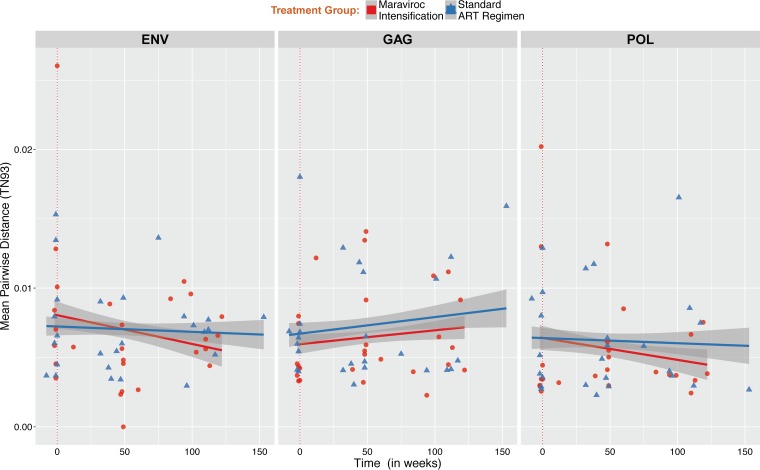
We first determined the viral diversity at each time point and within each region by estimating the APD between reads. The median APD at baseline during acute infection within partial env, gag, and pol sequences were 6.79 × 10⁻³ (IQR, 4.52 × 10⁻³ to 1.07 × 10⁻²), 5.71 × 10⁻³ (IQR, 4.08 × 10⁻³ to 7.43 × 10⁻³) and 3.69 × 10⁻³ (IQR, 2.98 × 10⁻³ to 9.35 × 10⁻³), respectively, with no difference between MVC groups. Over time, we found no significant increase of the viral diversity within env, gag, and pol regions and no significant difference between MVC groups, although there was a trend for a faster decay of viral diversity within partial env and pol regions among individuals with MVC intensification (Fig. 3).
FIG 3.
Change in HIV DNA molecular diversity. Mean pairwise distance was estimated for all samples within env (A, left), gag (B, middle), and pol (C, right) regions in individuals with or without maraviroc intensification (red dots and blue triangles, respectively). For each sample, we computed the means of all pairwise Tamura-Nei 93 (TN93) distances between reads with at least 100 overlapping base pairs to quantify nucleotide diversity (64).
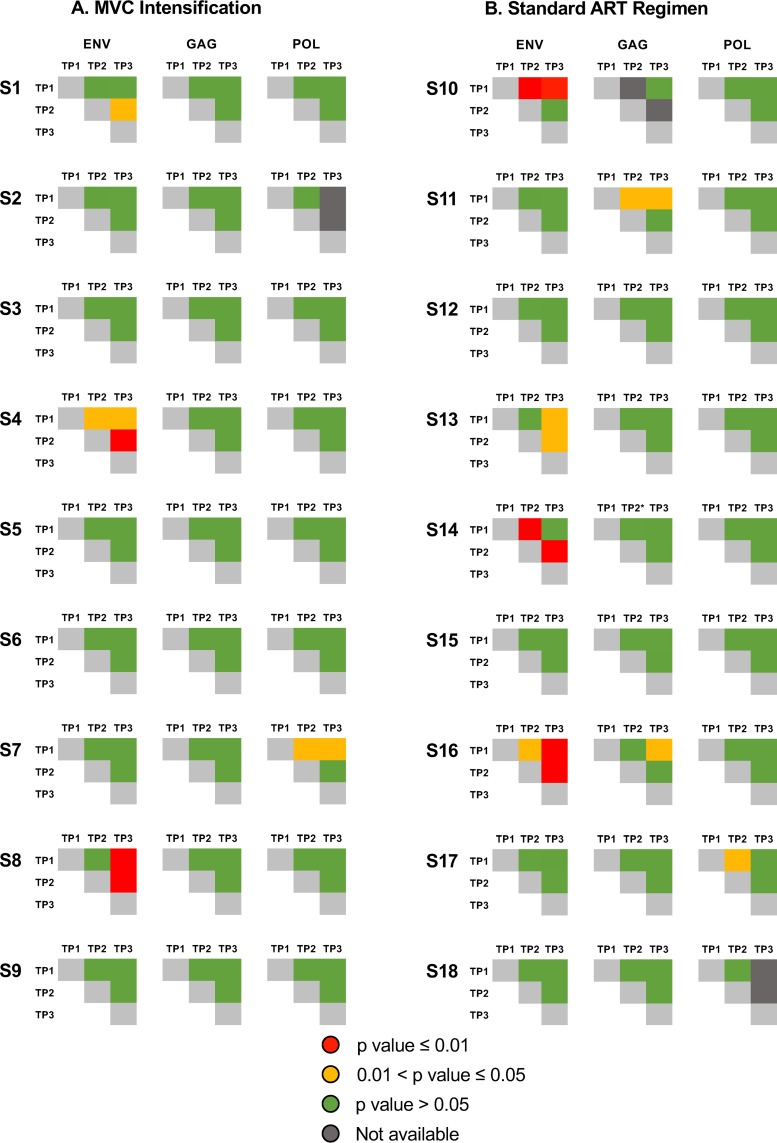
We next applied a nonparametric test for population structure to the longitudinally collected samples for each of the 3 coding regions. When assessing viral population structure across all time points, compartmentalization was identified between baseline and any longitudinal time points for 22.2% (4/18), 0% (0/18), and 0% (0/18) of participants in env, gag, and pol, respectively, with a significance level (α) of 0.01, and for 33.3% (6/18), 11.1% (2/18), and 11.1% (2/18) of participants with an α of 0.05, but compartmentalization was not observed across all 3 coding regions within the same person (Fig. 4). To evaluate potential differences of population structure between groups and across each coding region, we applied a generalized linear mixed model fit by maximum likelihood with an α of 0.05 (more liberal) and 0.01 (more conservative) (Fig. 4, in yellow and red, respectively). Overall, we found no significant difference in compartmentalization within env, gag, and pol regions between individuals with and without MVC intensification.
FIG 4.
Test for panmixia across time points and across 3 HIV coding regions. We computed the fixation index (FST) for all longitudinal samples and each of the 3 coding regions to evaluate the genetic structure of the population (65). The P value threshold for panmixia was set to 0.01 and 0.05, and 10,000 iterations were performed for each set. Significant compartmentalization is shown in yellow (P < 0.01) and red (P < 0.05), and panmixia is shown in green.
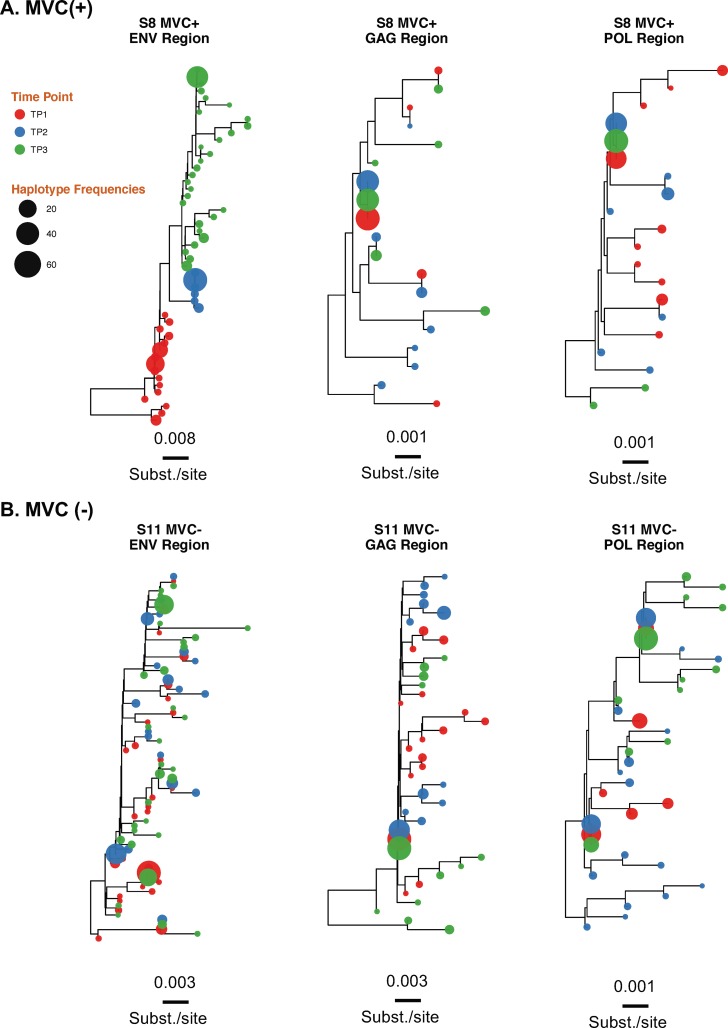
To evaluate if detected compartmentalization is the consequence of propagating replication, we reconstructed maximum likelihood phylogenetic trees for all 3 coding regions and each individual. The phylogenies for all 3 coding regions showed intermingled sequences from each time point for all regions/individuals but 4 phylogenies of partial env region (S7env and S8env from MVC+ group and participants S10env and S16env from the MVC− group). The lack of temporal structure of the serially sampled population argues against viral evolution. Results for individuals S8 (MVC+) and S11 (MVC−) are presented in Fig. 5 (see Fig S1 in the supplemental material for data on all individuals).
FIG 5.
Approximate maximum likelihood phylogenetic reconstruction of the 3 HIV coding regions. Shown are results for individuals S8 (MVC+) (A) and S11 (MVC−) (B). HIV haplotypes were extracted from reads covering partial env, gag, and pol regions and were used to construct approximate maximum likelihood phylogenies. Time points 1, 2, and 3 are depicted in red, blue, and green, respectively. Tip size is proportional to variant frequency. Scale bars are in substitutions/site. For results for the 18 participants, see Fig. S1 in the supplemental material.
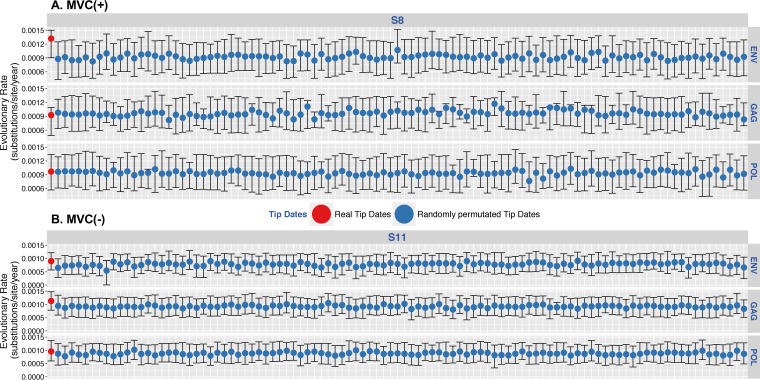
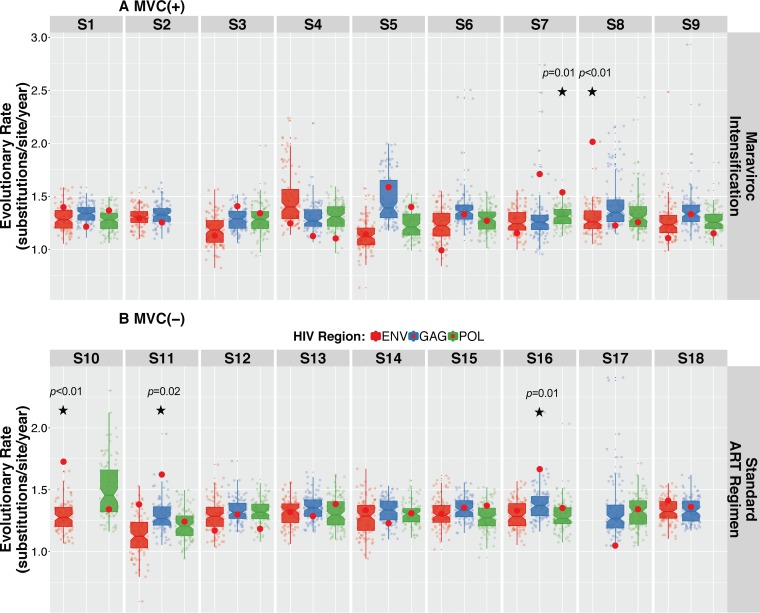
We then assessed the temporal structure of sequence data using a Bayesian phylogenetic approach combined with a tip-date randomized permutation technique. Bayesian inferences for each individual converged efficiently with the coalescent parameters under the hypothesis of a Bayesian skyline coalescent model. Results for individuals S8 (MVC+) and S11 (MVC−) are presented in Fig. 6 (see Fig. S2 for data on all individuals). Comparisons between the coefficient of variation (mean divided by the 95% highest posterior density [HPD]) of the substitution rates of the actual and permutated estimates for each virus revealed a lack of significant support for the presence of temporal structure in the data in 45/50 (90%) of the sequenced regions. Indeed, the coefficient of variation of the inferred substitution rate estimates fell within the distribution of the coefficient of variation of the permuted estimates within env, gag, and pol regions for all participants with or without MVC intensification, except for S7pol (P = 0.01) and S8env (P < 0.01) in the MVC+ group and S10env (P < 0.01), S11gag (P = 0.02), and S16gag (P = 0.01) in the MVC− group. No participant had evidence of clock-like signal in more than 1 coding region (Fig. 7).
FIG 6.
Posterior mean and 95% HPD intervals of the substitution rates for HIV env, gag, and pol regions. Shown are results for individuals S8 (MVC+) (A) and S11 (MVC−) (B). Shown are posterior mean and 95% HPD intervals of the substitution rates estimated from the actual data sets (far left value, red dots) and the 100 permuted replicates for HIV env, gag, and pol regions (blue dots). For results for the 18 participants, see Fig. S2 in the supplemental material.
FIG 7.
Coefficient of variation of the substitution rates for HIV env, gag, and pol regions of actual data set versus randomly permuted replicates. The coefficient of variation was determined as mean evolutionary rate divided by variance, where variance is 95% upper HPD minus 95% lower HPD. The coefficients of variation for the real data sets were not significantly different from those estimated from the data sets with randomly permutated tip dates in all but 5 regions (45/50, 90%). The P value represents the number of times the coefficient of variation of the true data set was smaller than the coefficient of variation in the permuted replicates (72, 73). The hypothesis of significant temporal structure was rejected when the P value was above 0.05.
Finally, we screened for possible emergence of minority (frequency, <20%) and majority (>20%) drug resistance mutations (DRMs) in the partial pol coding region of sampled HIV DNA populations during ART and found no evidence of selection for DRMs (Table 2). HIV variants harboring DRMs are shown in Fig. S1 in the supplemental material. Similar analyses of HIV V3 coding region suggested no change from R5 tropism via genotypic methods.
TABLE 2.
Identification screening of nucleoside reverse transcriptase inhibitor (NRTI) and non-NRTI DRM
| Group and participant ID | Time pointa | Coverage | DRM | Frequency (%) |
|---|---|---|---|---|
| Maraviroc intensification, MVC+ | ||||
| S2 | TP1 | 8544 | K103R | 1.10 |
| TP2 | 3626 | None | None | |
| TP3 | NAb | NA | NA | |
| S3 | TP1 | 6050 | E138A | 100.00 |
| TP2 | 7627 | E138A | 99.88 | |
| TP3 | 5117 | E138A | 99.94 | |
| S5 | TP1 | 7615 | K103N | 100.00 |
| TP2 | 2585 | K103N | 99.96 | |
| TP3 | 6989 | K103N | 99.90 | |
| S6 | TP1 | 4522 | None | None |
| TP2 | 3978 | K101E | 1.86 | |
| TP3 | 8258 | D67N | 2.35 | |
| S8 | TP1 | 5661 | None | None |
| TP2 | 5598 | K65R | 17.39 | |
| TP3 | 7557 | None | None | |
| S9 | TP1 | 4564 | K65R | 2.24 |
| TP2 | 6371 | None | None | |
| TP3 | 7113 | None | None | |
| Standard ART regimen | ||||
| S17 | TP1 | 3895 | K103N | 94.00 |
| TP2 | 4377 | K103N | 100.00 | |
| TP3 | 4294 | K103N | 96.00 | |
| S18 | TP1 | 9008 | RT103 | 99.01 |
| TP2 | 6662 | RT103 | 100.00 | |
| TP3 | NA | NA | NA |
TP, time point.
NA, not available.
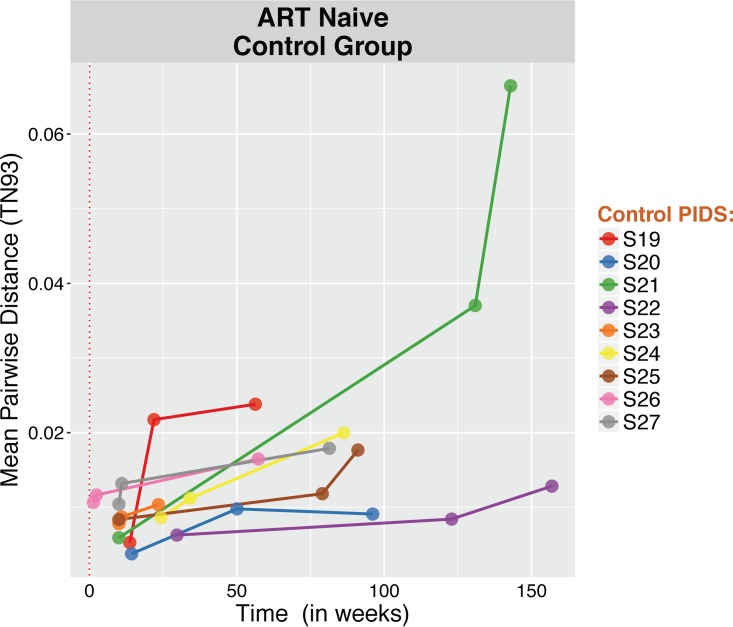
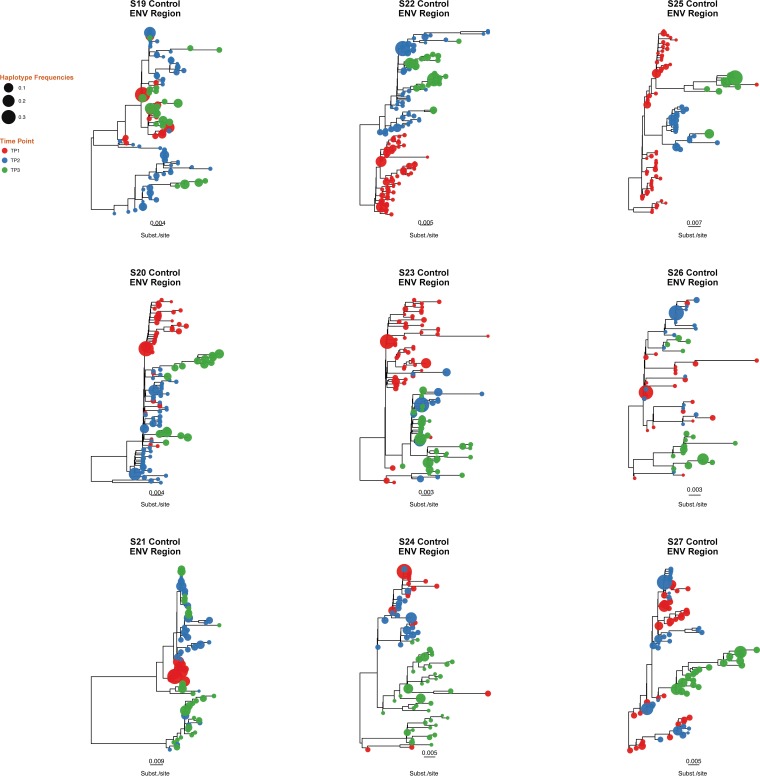
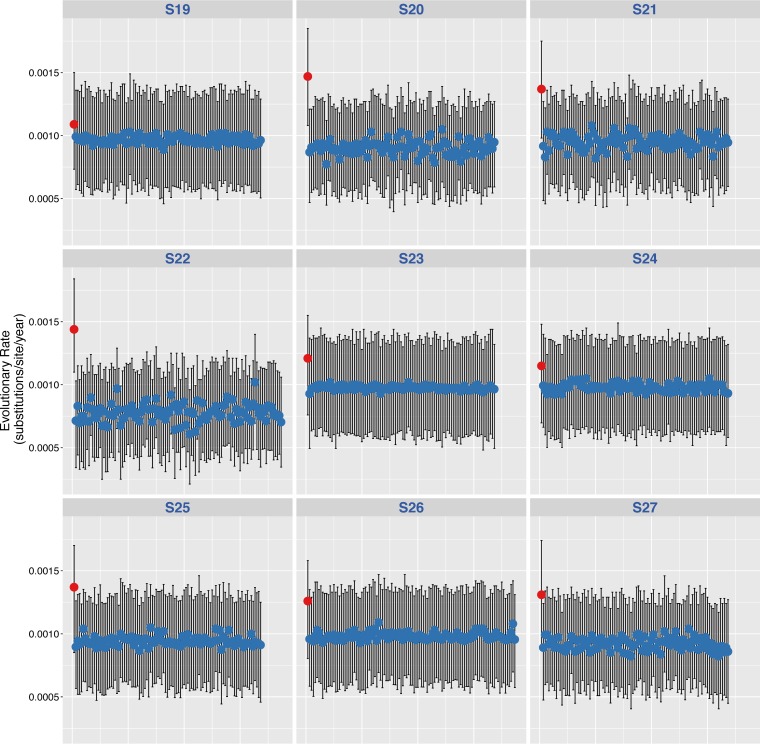
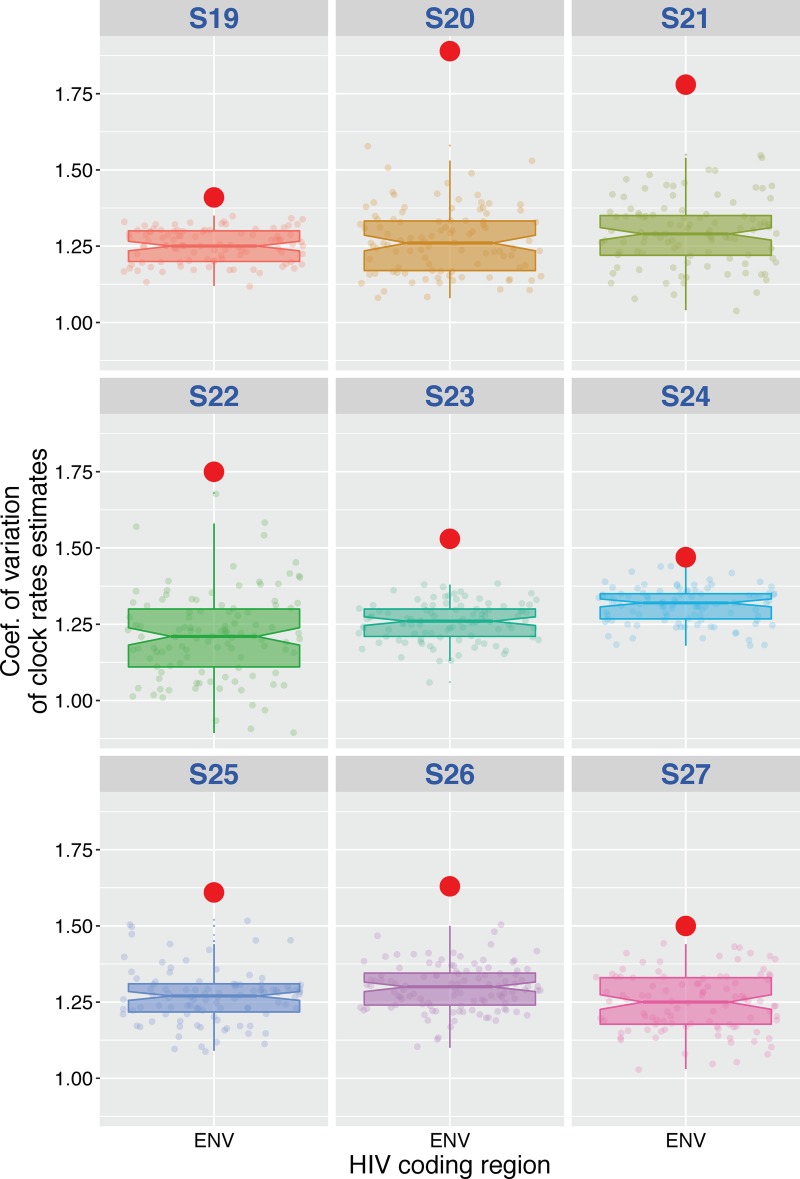
To validate the proposed approach, we performed the analyses mentioned above on a group of 9 ART-naïve, HIV-infected individuals with serially collected blood plasma samples (3 serially collected blood plasma samples over a median of 86 weeks [IQR, 56 to 119 weeks] after the estimated date of infection) (Table 3 provides a summary of baseline characteristics). C2-V3 sequences were generated and revealed (i) a significant increase in viral diversity while ART naïve, (ii) significant compartmentalization between baseline and any longitudinal time points in all participants, (iv) temporal structure of the data with segregated populations in the C2-V3 phylogenies, and (v) evidence of clock signal from the Bayesian inferences (100 iterations per sample) (Fig. 8 to 12), with a median substitution rate of 1.31 × 10⁻³/substitutions/site/year (IQR, 1.19 × 10⁻³ to 1.41 × 10⁻³), as previously described within hosts in ART-naive individuals (25, 26).
TABLE 3.
Characteristics of the ART-naive control group
| Parameter | Value(s) for control group (n = 9) |
|---|---|
| Age (yr) | 32 (27, 43) |
| Median time from EDI to baseline, in days (IQR) | 70 (70, 135) |
| Median CD4 count at baseline, in cells/mm3 (IQR) | 475 (416.5, 512.5) |
| Median HIV RNA Levels at baseline, in log10 copies/ml (IQR) | 4.9 (4.3, 5.1) |
| Median duration of follow up, in days (IQR) | 500 (345, 732) |
| Median no. of haplotypes (IQR) | 24 (18–41) |
| Time point 1 | 34 (17–54) |
| Time point 2 | 29 (19–49) |
| Time point 3 | 23 (16–32) |
FIG 8.
Change in HIV RNA molecular diversity among ART-naive individuals (control group). For each sample, we computed the mean of all pairwise TN93 distances between reads with at least 100 overlapping base pairs to quantify nucleotide diversity (21).
FIG 9.
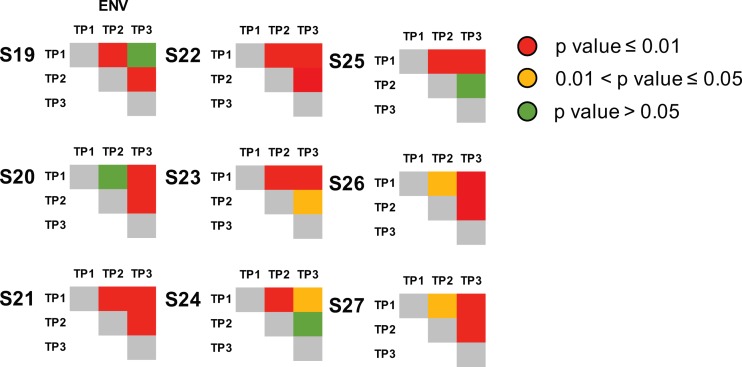
Test for panmixia across time points within env (C2/V3) coding region for the 9 ART-naïve, HIV-infected individuals (control group). We computed the fixation index (FST) for all longitudinal samples within partial env (C2/V3) regions to evaluate the genetic structure of the population (22). The P value threshold for panmixia was set to 0.01 and 0.05, and 10,000 iterations were performed for each set. Significant compartmentalization is shown in yellow (P < 0.01) and red (P < 0.05), and panmixia is shown in green. Significant compartmentalization was identified between baseline and any longitudinal time points for all participants (n = 9), as opposed to the results observed in our MVC+/MVC− study cohort.
FIG 10.
Approximate maximum likelihood phylogenetic reconstruction of C2/V3 coding region for the 9 ART-naïve, HIV-infected individuals (control group). Time points 1, 2, and 3 are depicted in red, blue, and green, respectively. Tip size is proportional to variant frequency. Scale bars indicate substitutions/site.
FIG 11.
Posterior mean and 95% HPDs of the substitution rates for HIV env region for the 9 ART-naïve, HIV-infected individuals (control group). Posterior mean and 95% HPD intervals of the substitution rates estimated from the actual data sets (far left value, red dots) and the 100 permuted replicates for HIV env region (blue dots) are shown.
FIG 12.
Coefficient of variation of the substitution rates for HIV env region of actual data set versus randomly permuted replicates for the 9 ART-naïve, HIV-infected individuals (control group). The coefficient of variation was determined as mean evolutionary rate divided by variance, where variance is 95% upper HPD minus 95% lower HPD.
DISCUSSION
Controversy remains as to whether ongoing propagation of HIV occurs in the setting of modern ART (see the review in reference 20). Here, we sought to identify HIV evolution in the context of a randomized controlled trial of ART intensification with MVC in individuals who initiated ART shortly after infection. Investigating individuals who started modern ART during early infection provided the best opportunity to discern molecular evolution, given the limited diversity of the viral population shortly after infection (27–30). In this study, we found that MVC intensification had no effect on HIV RNA or HIV DNA decay during ART. There was also no effect of MVC intensification on low-level HIV RNA measures. We found no clear evidence of significant clock-like molecular evolution or development of drug resistance in HIV DNA populations derived from circulating PBMC in the setting of standard or intensified ART initiated during early infection. Taken together, we found no evidence of propagating viral infection during modern ART with or without intensification with MVC.
Decay in the size of HIV DNA populations after starting early ART with or without MVC intensification.
Our first hypothesis was that individuals receiving ART intensified with MVC would have a faster decay of their HIV DNA populations than those receiving standard ART regimen (6). The beneficial effect of starting ART during the first weeks or months after infection to reduce the size of the latent reservoir has been reported in numerous studies (31, 32). Studies have also investigated ART intensification with integrase and protease inhibitors showing little impact of HIV DNA levels (33, 34), although treatment intensification with MVC has also been associated with recovery of CD4+ T cells (23, 35, 36) and a limited reduction in the size of the HIV reservoir (23, 37). The potential impact of entry inhibitor drugs, like MVC, on HIV DNA populations during early infection remains limited. As might be expected, there was a significant decay of HIV DNA in PBMC in our study participants who started ART within the first month following their infection (median of 35 days; IQR, 28 to 85), but there was no difference between participants receiving ART intensified with MVC or not. These results are consistent with the treatment intensification study of a raltegravir-based regimen with MVC in early HIV-1 infection from Puertas et al., which revealed a decay in proviral DNA with and without MVC intensification among persons with HIV starting ART during acute/early infection (23).
CD4 T cell count recovery after starting early ART with or without MVC intensification.
Previous studies showed the beneficial immunomodulatory effect of MVC with a faster increase in CD4+ T cell counts (23, 38). Here, we observed a significant increase in CD4+ T cell counts and CD4/CD8 ratio associated with a significant decrease in CD8+ T cell counts over the follow-up period, as previously reported (23, 35, 36). We found no significant difference between groups, but the interpretation of these data is hampered by the limited number of samples analyzed (24).
Limited residual viremia with no impact of treatment intensification.
Our second hypothesis was that residual viremia would be lower in participants receiving MVC intensification. While we cannot exclude the occurrence of larger unmeasured bursts of viral replication, single-copy measurements of HIV RNA levels were low at a median of 2.8 HIV RNA copies/ml across participants and sampled time points (IQR, 1.9 to 7.9 copies/ml). This is consistent with previous longitudinal studies with a real-time PCR-based assay (median of 3.1 copies/ml) (9). Residual viremia between MVC intensification study arms did not differ (median, 4 copies/ml in MVC+ versus 2 copies/ml in MVC−; P = 0.28), which is also consistent with previously reported studies (39, 40). Therefore, it is unlikely that cell-free propagating viral replication is the source of the observed residual viremia. Alternatively, it is likely that production or release of HIV RNA from long-lived infected cells without propagation is responsible for the observed residual viremia (9, 41, 42).
No substantial evidence of HIV evolution during modern ART.
Our third hypothesis was that if viral propagation occurred during ART, then we would see evidence of viral evolution and that it would be more obvious in the participants who did not receive MVC intensification. Evidence of evolution was considered increased viral diversity over time, significant compartmentalization, significant clock-like molecular signal, and development of genetic changes associated with drug resistance. Overall, viral genetic diversity was stable for the entire time of observation (median of 107 weeks; IQR, 97 to 115) across all participants without regard to treatment group. Although some participants showed significant compartmentalization that could reflect viral divergence over time, these results were not consistent across all three HIV coding regions. Further, compartmental mixing of infected cells before or after the initiation of ART could provide false signal of compartmentalization. For example, if subpopulations of infected CD4 T cells circulating in the blood changed over time, then this would look like longitudinal compartmentalization, even though all of the cells had no change in viral composition since the start of ART. However, this scenario would be more likely among participants who started ART during chronic infection. To further assess the presence of viral evolution, we applied a Bayesian approach to our heterochronous data set. While these techniques have been used to estimate the evolutionary rate of HIV RNA populations (43, 44), little is known about the efficacy of these methods to infer evolutionary rates of HIV DNA population, especially during ART. Here, we performed a permutation randomization test to investigate clock-like evolution during the clinical trial period. We were able to reject the absence of clock-like evolution in only 5 of 50 (10%) instances. Detection of the signal of clock-like evolution was inconsistent across the sampled genomic regions, within individuals, and MVC intensification group (Fig. 6 to 7). Further, there was no evidence of pressure from the ART drugs to select for resistance.
To validate our approach, we confirmed in a positive-control data set (collected in the setting of active viral replication) the ability to reveal the temporal structure of the data using a similar framework (Fig. 8 to 12). The observed median mutation rate in this group of 1.31 × 10⁻³/substitutions/site/year (IQR, 1.19 × 10⁻³ to 1.41 × 10⁻³) was consistent with those of intrahost virus estimations in ART-naive individuals (25, 26). Altogether and despite the limited sample size and the difference in population characteristics between the study group and the controls, these results support our initial findings and offer a robust framework for future studies in other settings and with more recent sequencing technologies.
Limitations.
The small sample size (n = 18 participants) of our study and the limited sampling sources (peripheral blood) and sequenced HIV coding regions (partial env, gag, and pol) prevent us from ruling out that HIV evolution occurs in compartments other than blood, with other treatment regimens, or in other populations (22, 45). Like most of the studies that have demonstrated the ability of early ART to reduce the size of the latent reservoir, we conducted our study on cells isolated from peripheral blood. Further analyses of selected anatomical compartments, like the central nervous system, lymph nodes, or genital tract, may allow a better understanding of the dynamics and persistence of HIV populations within these compartments. We also cannot rule out the possibility that we might have been able to document evidence of evolution in other regions of HIV-1 had they been interrogated. The measurements of viral evolution and HIV DNA population size did not assess for replication competence, so no strong conclusions can be made for how the ART regimens studied here impacted the replication-competent HIV reservoir. This study also cannot rule out that clonal expansion of infected cells determines the observed stability of the HIV DNA population (39). Another limitation of this report is the use of the 454 sequencing platform, which is more prone to homopolymer-associated, per-base errors (46) and artifact recombination (47). To overcome this limitation, we applied rigorous quality control procedures for deep sequencing, as previously described by our group (48, 49). Our validated bioinformatics pipeline includes strict quality filtering steps (50–52), and only quality-controlled reads were included in the analysis (53). Future studies using more recent sequencing technologies that are less prone to single-base errors, the use of Primer ID (54), or single-genome amplification/Sanger sequencing (55, 56) in different settings also could be enlightening.
This study of 18 men starting modern ART during acute infection suggested that propagating viral replication is not the mechanism of maintenance of HIV DNA populations during ART. Efforts aimed at eliminating the proviral reservoir should focus on other mechanisms of viral persistence.
MATERIALS AND METHODS
Ethics statement.
This study was a double-blind, placebo-controlled, 1:1 randomized clinical trial (FDA Investigational New Drug Application [IND] waiver number 103.162) comparing a standard-of-care ART regimen (combination of tenofovir, emtricitabine, and ritonavir-boosted atazanavir) (MVC− group) to standard-of-care ART intensified with MVC (MVC+ group) in persons with acute HIV infection. The study was reviewed and approved by the University of California San Diego Human Research Protections Program. All adult participants (age ≥18 years) provided written informed consent.
Study cohort.
Eighteen HIV-infected individuals from the San Diego Primary Infection Resource Consortium were enrolled during acute or very early HIV infection. Their EDI was determined using serologic and virologic parameters, as described previously (57). Individuals initiated ART within 2 weeks of enrollment (median of 35 days after EDI; IQR, 28 to 85). Whole blood was collected and absolute CD4 and CD8 T cell counts and percentages and HIV RNA levels (Amplicor, Roche) were measured at three different time points: (i) within a week before the initiation of ART (median, 7 days; IQR, 1 to 12 days), (ii) approximately 48 weeks after initiation of ART (median, 334 days; IQR, 278 to 341 days), and (iii) at least 72 weeks after ART (median, 764 days; IQR, 670 to 798 days). Study details can be found in reference 24.
DNA extraction and proviral quantification.
Genomic DNA was extracted from 5 million PBMC for each time point using a QIAamp DNA blood minikit (Qiagen) per the manufacturer's protocol. Levels of HIV DNA (pol) were quantified by droplet digital PCR (ddPCR) from extracted DNA (58). Copy numbers were calculated as the means from 3 replicate PCR measurements and normalized to one million cells, as determined by RPP30 (total cell count) (58, 59).
Single-copy HIV RNA.
To quantify plasma HIV RNA below the limit of FDA-approved assays, we used single-copy ddPCR assay (60). A total of 1 ml of cell-free plasma was pelleted for virus by ultra-high-speed centrifugation (23,500 × g, 4°C, 1 h), and RNA was extracted using a QIAamp viral RNA extraction kit (Qiagen) per the manufacturer's protocol. One-step RT-ddPCR advanced kit for probes (Bio-Rad) was used to quantify levels of HIV RNA (gag) by ddPCR. Copy numbers were calculated as the means from 6 replicated measurements and extrapolated to copies per milliliter of plasma.
HIV DNA pyrosequencing analyses.
HIV-1 coding regions of gag p24 (HXB2 coordinates 1366 to 1619), pol, reverse transcriptase (RT; HXB2 coordinates 2708 to 3242), and env C2-V3 (HXB2 coordinates 6928 to 7344) from PBMC were amplified by PCR with region-specific primers (53) on a single 454 GS FLX titanium picoliter plate (454 Life Sciences/Roche, Branford, CT) as previously described (52). We obtained a median of 13,681 (IQR, 4,096, 21,621) reads per PBMC sample. Reads (FASTA) and quality score files produced by the 454 platform were further analyzed using a purpose-built bioinformatics pipeline (50). The pipeline is available at https://github.com/veg/HIV-NGS and has been used by our group in numerous studies (50, 51, 61). After baseline quality control for short (≤50 bp) and low-quality reads and error correction, all reads were screened for evidence of recombination using GARD software (62), APOBEC signatures, hypermutations, and frame shifts. Identical sequence reads were clustered, allowing identification of nonredundant sequences. A minimum of 10 identical sequence reads were clustered into representative variants as previously described by our group (50, 51, 61). Therefore, the output consisted of a list of representative clusters of reads and their relative frequencies. Of note, the pairwise distance between any two reads in the same cluster is 0, since each read in the cluster matches the consensus sequence in all positions where the read has resolved bases. The resulting clusters for each coding region were aligned, and neighbor-joining (NJ) phylogenetic trees were reconstructed for all individuals and all 3 coding regions in HyPhy (63).
Evidence of evolution in sampled HIV DNA populations.
Sequence data were analyzed for evidence of evolution by multiple approaches. (i) For each sample, the APD between reads with at least 100 overlapping base pairs was computed to quantify nucleotide diversity under the Tamura-Nei 93 model (64), and the evolution of viral diversity was evaluated over time. (ii) Evaluation of the population genetic structure for each coding region across longitudinally collected samples by using genetic diversity to compute the fixation index (FST) (65, 66). Briefly, the fixation index is defined as FST = πI/πD, where πI is the estimate of mean pairwise genetic distance (Tamura-Nei 93 [TN93]) for each sample/region (67) and πD is its counterpart. Both quantities were computed by comparing all reads from different time points, with the requirement that they share at least 150 aligned nucleotide positions. The null hypothesis of a random distribution of genetic variation was rejected when permutation testing revealed significant population structure between HIV populations sampled at different time points. The P value thresholds for panmixia were set to 0.01 and 0.05 (Fig. 4, in red and yellow, respectively) to establish significance, and 10,000 iterations were performed for each set. (iii) As emergence of drug resistance mutations may reflect viral evolution in the setting of drug pressure, filtered deep-sequencing reads from pol regions were screened for the presence of reverse transcriptase inhibitor resistance mutations (50) according to the Stanford Drug Resistance Database (score, >35) (http://hivdb.stanford.edu). The relative frequency of each identified DRM was obtained as part of our bioinformatics pipeline (50, 51). Only DRMs with residue frequency greater than the background error rate estimated using our published binomial mixture model (53, 68) and with a minimum frequency of 1% were retained. (iv) Similarly, since MVC is a CCR5 receptor antagonist, we also evaluated the possible evolution of coreceptor tropism. Before ART initiation, tropism was evaluated in blood plasma with the Trofile Assay (Monogram Biosciences). At the last 2 time points, collected during suppressive ART, prediction of HIV coreceptor usage was assessed using V3 nucleotide sequences from sampled HIV DNA and the Geno2pheno algorithm with a false-positive rate cutoff of 5% (69). (v) Finally, to detect significant shifts in population structure that might not be evident from analyses mentioned above, we analyzed each set of partial env, gag, and pol HIV variants for each participant in a Markov chain Monte Carlo (MCMC) framework as implemented in BEAST v1.8.4 (70, 71). We used a discretized gamma distribution (GTR + 4Γ) to account for among-site rate variation. The temporal scale of the process was estimated from the sampling dates of the sequences using a relaxed uncorrelated lognormal molecular clock model, a gamma prior on clock rate, and a coalescent Bayesian skyline model for tree priors (71). To obtain a posterior estimate from the Bayesian model, MCMC simulations were run for 100 × 106 chain steps, subsampling parameters every 20,000 steps. After removing 10% of burn-in, the remaining samples were to estimate posterior densities for individual parameters.
We next estimated the mean substitution rate (substitutions/site/year) while permuting sampling dates 100 times for each participant for each HIV region. A null distribution of the mean substitution rates then was created by permuting the sampling date associated with each sample/sequence with 100 iterations per alignment (72, 73). Finally, we assessed the significance of the clock-like signal by comparing the coefficient of variation of the evolutionary rates (defined as the mean/95% HPD) obtained from the true data set to the coefficient of variation of the 100 permutated replicates. The P value represents the number of times the coefficient of variation (mean/95% HPD) of the true data set was higher than the coefficient of variation in the permuted replicates (72, 73). The hypothesis of significant temporal structure was rejected when the P value was above 0.05.
Finally, we applied a similar framework on a set of partial C2-V3 env sequences (454 platform) obtained from 9 ART-naïve, HIV-infected individuals with 3 serially collected blood plasma samples (Table 3) to demonstrate that evolution can be detected with our methods in the setting of active viral replication.
Statistical analyses.
All statistical analyses were performed using R statistical software (74). We performed a Mann-Whitney or Fisher exact test to assess statistical differences or associations between study groups. We evaluated the longitudinal associations using mixed-effects regression analysis (package nlme [75]) to adjust for repeated measurements. Variables were either log or square root transformed to approximate a normal distribution as assessed by a Shapiro test with a significance of a P value of <0.05 to satisfy model assumptions. To evaluate difference of population structure between groups and across each coding region, we applied a generalized linear mixed model fit by maximum likelihood to the data.
Supplementary Material
ACKNOWLEDGMENTS
We thank our study participants and all additional study-associated staff from the CFAR Genomic, Translational Virology, and Flow Cytometry Cores.
A.C., S.G., M.K., P.J., C.I., J.P.S., S.M.L., and D.M.S. participated in the study design and data analysis and wrote the primary version of the manuscript; A.C. performed the primary data analysis and wrote the primary version of the manuscript; J.O.W., S.R.M., and D.R. participated in the study design and revised the manuscript; S.J.L. and D.M.S. contributed to the study design, enrolled all participants, and revised the manuscript.
A.C., S.G., S.M.L., J.O.W., C.I., and P.J. do not have any commercial or other associations that might pose a conflict of interest. D.M.S. has received grant support from ViiV Pharmaceuticals and consultant fees from Gen-Probe and Testing Talent Services. S.J.L. and J.O.W. have received grant support from Gilead Science, Inc. D.R. has consulted for Gilead, Antiva, Merck, and Monogram. M.K. has received funding from the institution for research and has served on an advisory board for Gilead Sciences.
This work was supported primarily by a grant from the National Institutes of Health, University of California, San Francisco-Gladstone Institute of Virology and Immunology Center for AIDS Research, P30-AI027763 (CNIHR), California HIV Research Program Idea awards to S.G. and J.O.W. (ID15-SD-063 and ID15-SD-052), by the department of Veterans Affairs, the James B. Pendleton Charitable Trust, and additional grants from the National Institutes of Health: AI100665, MH100974, MH097520, DA034978, AI007384, AI027763, AI106039, AI43638,AI074621,AI036214, MH101012, K01AI110181, UL1TR000100, CARE U19 AI096113, and AI068636-09. The funders had no role in study design, data collection and analysis, decision to publish, or preparation of the manuscript.
Footnotes
Supplemental material for this article may be found at https://doi.org/10.1128/JVI.01589-17.
REFERENCES
- 1.Richman DD, Margolis DM, Delaney M, Greene WC, Hazuda D, Pomerantz RJ. 2009. The challenge of finding a cure for HIV infection. Science 323:1304–1307. doi: 10.1126/science.1165706. [DOI] [PubMed] [Google Scholar]
- 2.Finzi D, Hermankova M, Pierson T, Carruth LM, Buck C, Chaisson RE, Quinn TC, Chadwick K, Margolick J, Brookmeyer R, Gallant J, Markowitz M, Ho DD, Richman DD, Siliciano RF. 1997. Identification of a reservoir for HIV-1 in patients on highly active antiretroviral therapy. Science (New York, NY) 278:1295–1300. doi: 10.1126/science.278.5341.1295. [DOI] [PubMed] [Google Scholar]
- 3.Chun TW, Stuyver L, Mizell SB, Ehler LA, Mican JA, Baseler M, Lloyd AL, Nowak MA, Fauci AS. 1997. Presence of an inducible HIV-1 latent reservoir during highly active antiretroviral therapy. Proc Natl Acad Sci U S A 94:13193–13197. doi: 10.1073/pnas.94.24.13193. [DOI] [PMC free article] [PubMed] [Google Scholar]
- 4.Blankson JN, Persaud D, Siliciano RF. 2002. The challenge of viral reservoirs in HIV-1 infection. Annu Rev Med 53:557–593. doi: 10.1146/annurev.med.53.082901.104024. [DOI] [PubMed] [Google Scholar]
- 5.Chun TW, Davey RT, Ostrowski M, Shawn Justement J, Engel D, Mullins JI, Fauci AS. 2000. Relationship between pre-existing viral reservoirs and the re-emergence of plasma viremia after discontinuation of highly active anti-retroviral therapy. Nat Med 6:757–761. doi: 10.1038/77481. [DOI] [PubMed] [Google Scholar]
- 6.Chomont N, El-Far M, Ancuta P, Trautmann L, Procopio FA, Yassine-Diab B, Boucher G, Boulassel M-R, Ghattas G, Brenchley JM, Schacker TW, Hill BJ, Douek DC, Routy J-P, Haddad EK, Sékaly R-P. 2009. HIV reservoir size and persistence are driven by T cell survival and homeostatic proliferation. Nat Med 15:893–900. doi: 10.1038/nm.1972. [DOI] [PMC free article] [PubMed] [Google Scholar]
- 7.Ho DD, Zhang L. 2000. HIV-1 rebound after anti-retroviral therapy. Nat Med 6:736–737. doi: 10.1038/77447. [DOI] [PubMed] [Google Scholar]
- 8.Strain MC, Gunthard HF, Havlir DV, Ignacio CC, Smith DM, Leigh-Brown AJ, Macaranas TR, Lam RY, Daly OA, Fischer M, Opravil M, Levine H, Bacheler L, Spina CA, Richman DD, Wong JK. 2003. Heterogeneous clearance rates of long-lived lymphocytes infected with HIV: intrinsic stability predicts lifelong persistence. Proc Natl Acad Sci U S A 100:4819–4824. doi: 10.1073/pnas.0736332100. [DOI] [PMC free article] [PubMed] [Google Scholar]
- 9.Maldarelli F, Palmer S, King MS, Wiegand A, Polis MA, Mican J, Kovacs JA, Davey RT, Rock-Kress D, Dewar R, Liu S, Metcalf JA, Rehm C, Brun SC, Hanna GJ, Kempf DJ, Coffin JM, Mellors JW. 2007. ART suppresses plasma HIV-1 RNA to a stable set point predicted by pretherapy viremia. PLoS Pathog 3:e46. doi: 10.1371/journal.ppat.0030046. [DOI] [PMC free article] [PubMed] [Google Scholar]
- 10.Palmer S, Maldarelli F, Wiegand A, Bernstein B, Hanna GJ, Brun SC, Kempf DJ, Mellors JW, Coffin JM, King MS. 2008. Low-level viremia persists for at least 7 years in patients on suppressive antiretroviral therapy. Proc Natl Acad Sci U S A 105:3879–3884. doi: 10.1073/pnas.0800050105. [DOI] [PMC free article] [PubMed] [Google Scholar]
- 11.Joos B, Fischer M, Kuster H, Pillai SK, Wong JK, Böni J, Hirschel B, Weber R, Trkola A, Günthard HF, Swiss HIV Cohort Study . 2008. HIV rebounds from latently infected cells, rather than from continuing low-level replication. Proc Natl Acad Sci U S A 105:16725–16730. doi: 10.1073/pnas.0804192105. [DOI] [PMC free article] [PubMed] [Google Scholar]
- 12.Evering TH, Mehandru S, Racz P, Tenner-Racz K, Poles MA, Figueroa A, Mohri H, Markowitz M. 2012. Absence of HIV-1 evolution in the gut-associated lymphoid tissue from patients on combination antiviral therapy initiated during primary infection. PLoS Pathog 8:e1002506. doi: 10.1371/journal.ppat.1002506. [DOI] [PMC free article] [PubMed] [Google Scholar]
- 13.Josefsson L, von Stockenstrom S, Faria NR, Sinclair E, Bacchetti P, Killian M, Epling L, Tan A, Ho T, Lemey P, Shao W, Hunt PW, Somsouk M, Wylie W, Douek DC, Loeb L, Custer J, Hoh R, Poole L, Deeks SG, Hecht F, Palmer S. 2013. The HIV-1 reservoir in eight patients on long-term suppressive antiretroviral therapy is stable with few genetic changes over time. Proc Natl Acad Sci U S A 110:E4987–E4996. doi: 10.1073/pnas.1308313110. [DOI] [PMC free article] [PubMed] [Google Scholar]
- 14.Kearney MF, Spindler J, Shao W, Yu S, Anderson EM, O'Shea A, Rehm C, Poethke C, Kovacs N, Mellors JW, Coffin JM, Maldarelli F. 2014. Lack of detectable HIV-1 molecular evolution during suppressive antiretroviral therapy. PLoS Pathog 10:e1004010. doi: 10.1371/journal.ppat.1004010. [DOI] [PMC free article] [PubMed] [Google Scholar]
- 15.Kearney MF, Wiegand A, Shao W, Coffin JM, Mellors JW, Lederman M, Gandhi RT, Keele BF, Li JZ. 2015. Origin of rebound plasma HIV includes cells with identical proviruses that are transcriptionally active before stopping of antiretroviral therapy. J Virol 90:1369–1376. doi: 10.1128/JVI.02139-15. [DOI] [PMC free article] [PubMed] [Google Scholar]
- 16.Buzón MJ, Massanella M, Llibre JM, Esteve A, Dahl V, Puertas MC, Gatell JM, Domingo P, Paredes R, Sharkey M, Palmer S, Stevenson M, Clotet B, Blanco J, Martinez-Picado J. 2010. HIV-1 replication and immune dynamics are affected by raltegravir intensification of HAART-suppressed subjects. Nat Med 16:460–465. doi: 10.1038/nm.2111. [DOI] [PubMed] [Google Scholar]
- 17.Hatano H, Strain MC, Scherzer R, Bacchetti P, Wentworth D, Hoh R, Martin JN, McCune JM, Neaton JD, Tracy RP, Hsue PY, Richman DD, Deeks SG. 2013. Increase in 2-long terminal repeat circles and decrease in D-dimer after raltegravir intensification in patients with treated HIV infection: a randomized, placebo-controlled trial. J Infect Dis 208:1436–1442. [DOI] [PMC free article] [PubMed] [Google Scholar]
- 18.Dinoso JB, Kim SY, Wiegand AM, Palmer SE, Gange SJ, Cranmer L, O'Shea A, Callender M, Spivak A, Brennan T, Kearney MF, Proschan MA, Mican JM, Rehm CA, Coffin JM, Mellors JW, Siliciano RF, Maldarelli F. 2009. Treatment intensification does not reduce residual HIV-1 viremia in patients on highly active antiretroviral therapy. Proc Natl Acad Sci U S A 106:9403–9408. doi: 10.1073/pnas.0903107106. [DOI] [PMC free article] [PubMed] [Google Scholar]
- 19.McMahon D, Jones J, Wiegand A, Gange SJ, Kearney M, Palmer S, McNulty S, Metcalf JA, Acosta E, Rehm C, Coffin JM, Mellors JW, Maldarelli F. 2010. Short-course raltegravir intensification does not reduce persistent low-level viremia in patients with HIV-1 suppression during receipt of combination antiretroviral therapy. Clin Infect Dis 50:912–919. doi: 10.1086/650749. [DOI] [PMC free article] [PubMed] [Google Scholar]
- 20.Martinez-Picado J, Deeks SG. 2016. Persistent HIV-1 replication during antiretroviral therapy. Curr Opin HIV AIDS 11:417–423. doi: 10.1097/COH.0000000000000287. [DOI] [PMC free article] [PubMed] [Google Scholar]
- 21.Pierson T, McArthur J, Siliciano RF. 2000. Reservoirs for HIV-1: mechanisms for viral persistence in the presence of antiviral immune responses and antiretroviral therapy. Annu Rev Immunol 18:665–708. doi: 10.1146/annurev.immunol.18.1.665. [DOI] [PubMed] [Google Scholar]
- 22.Lorenzo-Redondo R, Fryer HR, Bedford T, Kim EY, Archer J, Kosakovsky Pond SL, Chung YS, Penugonda S, Chipman JG, Fletcher CV, Schacker TW, Malim MH, Rambaut A, Haase AT, McLean AR, Wolinsky SM. 2016. Persistent HIV-1 replication maintains the tissue reservoir during therapy. Nature 530:51–56. doi: 10.1038/nature16933. [DOI] [PMC free article] [PubMed] [Google Scholar]
- 23.Puertas MC, Massanella M, Llibre JM, Ballestero M, Buzon MJ, Ouchi D, Esteve A, Boix J, Manzardo C, Miro JM, Gatell JM, Clotet B, Blanco J, Martinez-Picado J. 2014. Intensification of a raltegravir-based regimen with maraviroc in early HIV-1 infection. AIDS 28:325–334. doi: 10.1097/QAD.0000000000000066. [DOI] [PubMed] [Google Scholar]
- 24.Karris MY, Umlauf A, Vaida F, Richman D, Little S, Smith D. 2016. A randomized controlled clinical trial on the impact of CCR5 blockade with maraviroc in early infection on T-cell dynamics. Medicine (Baltimore, MD) 95:e5315. doi: 10.1097/MD.0000000000005315. [DOI] [PMC free article] [PubMed] [Google Scholar]
- 25.Lemey P, Rambaut A, Pybus OG. 2006. HIV evolutionary dynamics within and among hosts. AIDS Rev 8:125–140. [PubMed] [Google Scholar]
- 26.Pybus OG, Rambaut A. 2009. Evolutionary analysis of the dynamics of viral infectious disease. Nat Rev Genet 10:540–550. doi: 10.1038/nrg2583. [DOI] [PMC free article] [PubMed] [Google Scholar]
- 27.Zhu T, Mo H, Wang N, Nam DS, Cao Y, Koup RA, Ho DD. 1993. Genotypic and phenotypic characterization of HIV-1 patients with primary infection. Science (New York, NY) 261:1179–1181. doi: 10.1126/science.8356453. [DOI] [PubMed] [Google Scholar]
- 28.Learn GH, Muthui D, Brodie SJ, Zhu T, Diem K, Mullins JI, Corey L. 2002. Virus population homogenization following acute human immunodeficiency virus type 1 infection. J Virol 76:11953–11959. doi: 10.1128/JVI.76.23.11953-11959.2002. [DOI] [PMC free article] [PubMed] [Google Scholar]
- 29.Keele BF, Derdeyn CA. 2009. Genetic and antigenic features of the transmitted virus. Curr Opin HIV AIDS 4:352–357. doi: 10.1097/COH.0b013e32832d9fef. [DOI] [PubMed] [Google Scholar]
- 30.Edwards CTT, Holmes EC, Wilson DJ, Viscidi RP, Abrams EJ, Phillips RE, Drummond AJ. 2006. Population genetic estimation of the loss of genetic diversity during horizontal transmission of HIV-1. BMC Evol Biol 6:28. doi: 10.1186/1471-2148-6-28. [DOI] [PMC free article] [PubMed] [Google Scholar]
- 31.Archin NM, Vaidya NK, Kuruc JD, Liberty AL, Wiegand A, Kearney MF, Cohen MS, Coffin JM, Bosch RJ, Gay CL, Eron JJ, Margolis DM, Perelson AS. 2012. Immediate antiviral therapy appears to restrict resting CD4+ cell HIV-1 infection without accelerating the decay of latent infection. Proc Natl Acad Sci U S A 109:9523–9528. doi: 10.1073/pnas.1120248109. [DOI] [PMC free article] [PubMed] [Google Scholar]
- 32.Buzon MJ, Martin-Gayo E, Pereyra F, Ouyang Z, Sun H, Li JZ, Piovoso M, Shaw A, Dalmau J, Zangger N, Martinez-Picado J, Zurakowski R, Yu XG, Telenti A, Walker BD, Rosenberg ES, Lichterfeld M. 2014. Long-term antiretroviral treatment initiated at primary HIV-1 infection affects the size, composition, and decay kinetics of the reservoir of HIV-1-infected CD4 T cells. J Virol 88:10056–10065. doi: 10.1128/JVI.01046-14. [DOI] [PMC free article] [PubMed] [Google Scholar]
- 33.Hatano H, Hayes TL, Dahl V, Sinclair E, Lee T-H, Hoh R, Lampiris H, Hunt PW, Palmer S, McCune JM, Martin JN, Busch MP, Shacklett BL, Deeks SG. 2011. A randomized, controlled trial of raltegravir intensification in antiretroviral-treated, HIV-infected patients with a suboptimal CD4+ T cell response. J Infect Dis 203:960–968. doi: 10.1093/infdis/jiq138. [DOI] [PMC free article] [PubMed] [Google Scholar]
- 34.Gandhi RT, Zheng L, Bosch RJ, Chan ES, Margolis DM, Read S, Kallungal B, Palmer S, Medvik K, Lederman MM, Alatrakchi N, Jacobson JM, Wiegand A, Kearney M, Coffin JM, Mellors JW, Eron JJ. 2010. The effect of raltegravir intensification on low-level residual viremia in HIV-infected patients on antiretroviral therapy: a randomized controlled trial. PLoS Med 7:e1000321. doi: 10.1371/journal.pmed.1000321. [DOI] [PMC free article] [PubMed] [Google Scholar]
- 35.Asmuth DM, Goodrich J, Cooper DA, Haubrich R, Rajicic N, Hirschel B, Mayer H, Valdez H. 2010. CD4+ T-cell restoration after 48 weeks in the maraviroc treatment-experienced trials MOTIVATE 1 and 2. J Acquir Immune Defic Syndr 54:394–397. doi: 10.1097/QAI.0b013e3181c5c83b. [DOI] [PubMed] [Google Scholar]
- 36.Cuzin L, Trabelsi S, Delobel P, Barbuat C, Reynes J, Allavena C, Peytavin G, Ghosn J, Lascoux-Combe C, Psomas C, Corbeau P, Flandre P. 2012. Maraviroc intensification of stable antiviral therapy in HIV-1-infected patients with poor immune restoration: MARIMUNO-ANRS 145 study. J Acquir Immune Defic Syndr 61:557–564. doi: 10.1097/QAI.0b013e318273015f. [DOI] [PubMed] [Google Scholar]
- 37.Ananworanich J, Chomont N, Fletcher JL, Pinyakorn S, Schuetz A, Sereti I, Rerknimitr R, Dewar R, Kroon E, Vandergeeten C, Trichavaroj R, Chomchey N, Chalermchai T, Michael NL, Kim JH, Phanuphak P, Phanuphak N. 2015. Markers of HIV reservoir size and immune activation after treatment in acute HIV infection with and without raltegravir and maraviroc intensification. J Virus Erad 1:116–122. [DOI] [PMC free article] [PubMed] [Google Scholar]
- 38.Cooper DA, Heera J, Goodrich J, Tawadrous M, Saag M, Dejesus E, Clumeck N, Walmsley S, Ting N, Coakley E, Reeves JD, Reyes-Teran G, Westby M, Van Der Ryst E, Ive P, Mohapi L, Mingrone H, Horban A, Hackman F, Sullivan J, Mayer H. 2010. Maraviroc versus efavirenz, both in combination with zidovudine-lamivudine, for the treatment of antiretroviral-naive subjects with CCR5-tropic HIV-1 infection. J Infect Dis 201:803–813. doi: 10.1086/650697. [DOI] [PubMed] [Google Scholar]
- 39.Cillo AR, Hilldorfer BB, Lalama CM, McKinnon JE, Coombs RW, Tenorio AR, Fox L, Gandhi RT, Ribaudo H, Currier JS, Gulick RM, Wilkin TJ, Mellors JW. 2015. Virologic and immunologic effects of adding maraviroc to suppressive antiretroviral therapy in individuals with suboptimal CD4+ T-cell recovery. AIDS 29:2121–2129. doi: 10.1097/QAD.0000000000000810. [DOI] [PMC free article] [PubMed] [Google Scholar]
- 40.Hunt PW, Shulman NS, Hayes TL, Dahl V, Somsouk M, Funderburg NT, McLaughlin B, Landay AL, Adeyemi O, Gilman LE, Clagett B, Rodriguez B, Martin JN, Schacker TW, Shacklett BL, Palmer S, Lederman MM, Deeks SG. 2013. The immunologic effects of maraviroc intensification in treated HIV-infected individuals with incomplete CD4+ T-cell recovery: a randomized trial. Blood 121:4635–4646. doi: 10.1182/blood-2012-06-436345. [DOI] [PMC free article] [PubMed] [Google Scholar]
- 41.Finzi D, Blankson J, Siliciano JD, Margolick JB, Chadwick K, Pierson T, Smith K, Lisziewicz J, Lori F, Flexner C, Quinn TC, Chaisson RE, Rosenberg E, Walker B, Gange S, Gallant J, Siliciano RF. 1999. Latent infection of CD4+ T cells provides a mechanism for lifelong persistence of HIV-1, even in patients on effective combination therapy. Nat Med 5:512–517. doi: 10.1038/8394. [DOI] [PubMed] [Google Scholar]
- 42.Bonhoeffer S, Nowak MA. 1997. Pre-existence and emergence of drug resistance in HIV-1 infection. Proc Biol Sci 264:631–637. doi: 10.1098/rspb.1997.0089. [DOI] [PMC free article] [PubMed] [Google Scholar]
- 43.Vrancken B, Baele G, Vandamme AM, van Laethem K, Suchard MA, Lemey P. 2015. Disentangling the impact of within-host evolution and transmission dynamics on the tempo of HIV-1 evolution. AIDS 29:1549–1556. doi: 10.1097/QAD.0000000000000731. [DOI] [PMC free article] [PubMed] [Google Scholar]
- 44.Novitsky V, Wang R, Rossenkhan R, Moyo S, Essex M. 2013. Intra-host evolutionary rates in HIV-1C env and gag during primary infection. Infect Genet Evol 19:361–368. doi: 10.1016/j.meegid.2013.02.023. [DOI] [PMC free article] [PubMed] [Google Scholar]
- 45.Chun T-W, Nickle DC, Justement JS, Meyers JH, Roby G, Hallahan CW, Kottilil S, Moir S, Mican JM, Mullins JI, Ward DJ, Kovacs JA, Mannon PJ, Fauci AS. 2008. Persistence of HIV in gut-associated lymphoid tissue despite long-term antiretroviral therapy. J Infect Dis 197:714–720. doi: 10.1086/527324. [DOI] [PubMed] [Google Scholar]
- 46.Gilles A, Meglecz E, Pech N, Ferreira S, Malausa T, Martin JF. 2011. Accuracy and quality assessment of 454 GS-FLX Titanium pyrosequencing. BMC Genomics 12:245. doi: 10.1186/1471-2164-12-245. [DOI] [PMC free article] [PubMed] [Google Scholar]
- 47.Shao W, Boltz VF, Spindler JE, Kearney MF, Maldarelli F, Mellors JW, Stewart C, Volfovsky N, Levitsky A, Stephens RM, Coffin JM. 2013. Analysis of 454 sequencing error rate, error sources, and artifact recombination for detection of low-frequency drug resistance mutations in HIV-1 DNA. Retrovirology 10:18. doi: 10.1186/1742-4690-10-18. [DOI] [PMC free article] [PubMed] [Google Scholar]
- 48.Schmieder R, Edwards R. 2011. Quality control and preprocessing of metagenomic datasets. Bioinformatics 27:863–864. doi: 10.1093/bioinformatics/btr026. [DOI] [PMC free article] [PubMed] [Google Scholar]
- 49.Watson SJ, Welkers MR, Depledge DP, Coulter E, Breuer JM, de Jong MD, Kellam P. 2013. Viral population analysis and minority-variant detection using short read next-generation sequencing. Philos Trans R Soc Lond B Biol Sci 368:20120205. doi: 10.1098/rstb.2012.0205. [DOI] [PMC free article] [PubMed] [Google Scholar]
- 50.Fisher RG, Smith DM, Murrell B, Slabbert R, Kirby BM, Edson C, Cotton MF, Haubrich RH, Kosakovsky Pond SL, Van Zyl GU. 2015. Next generation sequencing improves detection of drug resistance mutations in infants after PMTCT failure. J Clin Virol 62:48–53. doi: 10.1016/j.jcv.2014.11.014. [DOI] [PMC free article] [PubMed] [Google Scholar]
- 51.Carter CC, Wagner GA, Hightower GK, Caballero G, Phung P, Richman DD, Pond SL, Smith DM. 2015. HIV-1 neutralizing antibody response and viral genetic diversity characterized with next generation sequencing. Virology 474:34–40. doi: 10.1016/j.virol.2014.10.019. [DOI] [PMC free article] [PubMed] [Google Scholar]
- 52.Wagner GA, Pacold ME, Kosakovsky Pond SL, Caballero G, Chaillon A, Rudolph AE, Morris SR, Little SJ, Richman DD, Smith DM. 2014. Incidence and prevalence of intrasubtype HIV-1 dual infection in at-risk men in the United States. J Infect Dis 209:1032–1038. doi: 10.1093/infdis/jit633. [DOI] [PMC free article] [PubMed] [Google Scholar]
- 53.Gianella S, Delport W, Pacold ME, Young JA, Choi JY, Little SJ, Richman DD, Kosakovsky Pond SL, Smith DM. 2011. Detection of minority resistance during early HIV-1 infection: natural variation and spurious detection rather than transmission and evolution of multiple viral variants. J Virol 85:8359–8367. doi: 10.1128/JVI.02582-10. [DOI] [PMC free article] [PubMed] [Google Scholar]
- 54.Zhou S, Jones C, Mieczkowski P, Swanstrom R. 2015. Primer ID validates template sampling depth and greatly reduces the error rate of next-generation sequencing of HIV-1 genomic RNA populations. J Virol 89:8540–8555. doi: 10.1128/JVI.00522-15. [DOI] [PMC free article] [PubMed] [Google Scholar]
- 55.Boltz VF, Rausch J, Shao W, Hattori J, Luke B, Maldarelli F, Mellors JW, Kearney MF, Coffin JM. 2016. Ultrasensitive single-genome sequencing: accurate, targeted, next generation sequencing of HIV-1 RNA. Retrovirology 13:87. doi: 10.1186/s12977-016-0321-6. [DOI] [PMC free article] [PubMed] [Google Scholar]
- 56.Salazar-Gonzalez JF, Bailes E, Pham KT, Salazar MG, Guffey MB, Keele BF, Derdeyn CA, Farmer P, Hunter E, Allen S, Manigart O, Mulenga J, Anderson JA, Swanstrom R, Haynes BF, Athreya GS, Korber BTM, Sharp PM, Shaw GM, Hahn BH. 2008. Deciphering human immunodeficiency virus type 1 transmission and early envelope diversification by single-genome amplification and sequencing. J Virol 82:3952–3970. doi: 10.1128/JVI.02660-07. [DOI] [PMC free article] [PubMed] [Google Scholar]
- 57.Le T, Wright EJ, Smith DM, He W, Catano G, Okulicz JF, Young JA, Clark RA, Richman DD, Little SJ, Ahuja SK. 2013. Enhanced CD4+ T-cell recovery with earlier HIV-1 antiretroviral therapy. N Engl J Med 368:218–230. doi: 10.1056/NEJMoa1110187. [DOI] [PMC free article] [PubMed] [Google Scholar]
- 58.Strain MC, Lada SM, Luong T, Rought SE, Gianella S, Terry VH, Spina CA, Woelk CH, Richman DD. 2013. Highly precise measurement of HIV DNA by droplet digital PCR. PLoS One 8:e55943. doi: 10.1371/journal.pone.0055943. [DOI] [PMC free article] [PubMed] [Google Scholar]
- 59.Pinheiro LB, Coleman VA, Hindson CM, Herrmann J, Hindson BJ, Bhat S, Emslie KR. 2012. Evaluation of a droplet digital polymerase chain reaction format for DNA copy number quantification. Anal Chem 84:1003–1011. doi: 10.1021/ac202578x. [DOI] [PMC free article] [PubMed] [Google Scholar]
- 60.Palmer S, Wiegand AP, Maldarelli F, Bazmi H, Mican JM, Polis M, Dewar RL, Planta A, Liu S, Metcalf JA, Mellors JW, Coffin JM. 2003. New real-time reverse transcriptase-initiated PCR assay with single-copy sensitivity for human immunodeficiency virus type 1 RNA in plasma. J Clin Microbiol 41:4531–4536. doi: 10.1128/JCM.41.10.4531-4536.2003. [DOI] [PMC free article] [PubMed] [Google Scholar]
- 61.Gianella S, Kosakovsky Pond SL, Oliveira MF, Scheffler K, Strain MC, De la Torre A, Letendre S, Smith DM, Ellis RJ. 2016. Compartmentalized HIV rebound in the central nervous system after interruption of antiretroviral therapy. Virus Evol 2:vew020. doi: 10.1093/ve/vew020. [DOI] [PMC free article] [PubMed] [Google Scholar]
- 62.Pond SL, Frost SD. 2005. A genetic algorithm approach to detecting lineage-specific variation in selection pressure. Mol Biol Evol 22:478–485. doi: 10.1093/molbev/msi031. [DOI] [PubMed] [Google Scholar]
- 63.Pond SLK, Frost SDW, Muse SV. 2005. HyPhy: hypothesis testing using phylogenies. Bioinformatics (Oxford, England) 21:676–679. doi: 10.1093/bioinformatics/bti079. [DOI] [PubMed] [Google Scholar]
- 64.Tamura K. 1992. Estimation of the number of nucleotide substitutions when there are strong transition-transversion and G+C-content biases. Mol Biol Evol 9:678–687. [DOI] [PubMed] [Google Scholar]
- 65.Hudson RR, Slatkin M, Maddison WP. 1992. Estimation of levels of gene flow from DNA sequence data. Genetics 132:583–589. [DOI] [PMC free article] [PubMed] [Google Scholar]
- 66.Achaz G, Palmer S, Kearney M, Maldarelli F, Mellors JW, Coffin JM, Wakeley J. 2004. A robust measure of HIV-1 population turnover within chronically infected individuals. Mol Biol Evol 21:1902–1912. doi: 10.1093/molbev/msh196. [DOI] [PubMed] [Google Scholar]
- 67.Tamura K, Nei M. 1993. Estimation of the number of nucleotide substitutions in the control region of mitochondrial DNA in humans and chimpanzees. Mol Biol Evol 10:512–526. [DOI] [PubMed] [Google Scholar]
- 68.Delport W, Poon AFY, Frost SDW, Kosakovsky Pond SL. 2010. Datamonkey 2010: a suite of phylogenetic analysis tools for evolutionary biology. Bioinformatics (Oxford, England) 26:2455–2457. doi: 10.1093/bioinformatics/btq429. [DOI] [PMC free article] [PubMed] [Google Scholar]
- 69.Thielen A, Lengauer T. 2012. Geno2pheno[454]: a Web server for the prediction of HIV-1 coreceptor usage from next-generation sequencing data. Intervirology 55:113–117. doi: 10.1159/000332002. [DOI] [PubMed] [Google Scholar]
- 70.Drummond AJ, Suchard MA, Xie D, Rambaut A. 2012. Bayesian Phylogenetics with BEAUti and the BEAST 1.7. Mol Biol Evol 29:1969–1973. doi: 10.1093/molbev/mss075. [DOI] [PMC free article] [PubMed] [Google Scholar]
- 71.Drummond AJ, Rambaut A, Shapiro B, Pybus OG. 2005. Bayesian coalescent inference of past population dynamics from molecular sequences. Mol Biol Evol 22:1185–1192. doi: 10.1093/molbev/msi103. [DOI] [PubMed] [Google Scholar]
- 72.Ramsden C, Melo FL, Figueiredo LM, Holmes EC, Zanotto PMA, VGDN Consortium . 2008. High rates of molecular evolution in hantaviruses. Mol Biol Evol 25:1488–1492. doi: 10.1093/molbev/msn093. [DOI] [PubMed] [Google Scholar]
- 73.Firth C, Kitchen A, Shapiro B, Suchard MA, Holmes EC, Rambaut A. 2010. Using time-structured data to estimate evolutionary rates of double-stranded DNA viruses. Mol Biol Evol 27:2038–2051. doi: 10.1093/molbev/msq088. [DOI] [PMC free article] [PubMed] [Google Scholar]
- 74.R Development Core Team. 2008. R: a language and environment for statistical computing. R Foundation for Statistical Computing, Vienna, Austria. [Google Scholar]
- 75.Pinheiro J, Bates D, DebRoy S, Sarkar D. 2015. nlme: linear and nonlinear mixed effects models. R Foundation for Statistical Computing, Vienna, Austria. [Google Scholar]
Associated Data
This section collects any data citations, data availability statements, or supplementary materials included in this article.


