Summary
Transposable elements (TEs) are now recognized not only as parasitic DNA, whose spread in the genome must be controlled by the host, but also as major players in genome evolution and regulation1,2,3,4,5,6. Long INterspersed Element-1 (LINE-1 or L1), the only currently autonomous mobile transposon in humans, occupies 17% of the genome and continues to generate inter- and intra-individual genetic variation, in some cases resulting in disease1,2,3,4,5,6,7. Nonetheless, how L1 activity is controlled and what function L1s play in host gene regulation remain incompletely understood. Here, we use CRISPR/Cas9 screening strategies in two distinct human cell lines to provide the first genome-wide survey of genes involved in L1 retrotransposition control. We identified functionally diverse genes that either promote or restrict L1 retrotransposition. These genes, often associated with human diseases, control the L1 lifecycle at transcriptional or post-transcriptional levels and in a manner that can depend on the endogenous L1 sequence, underscoring the complexity of L1 regulation. We further investigated L1 restriction by MORC2 and human silencing hub (HUSH) complex subunits MPP8 and TASOR8. HUSH/MORC2 selectively bind evolutionarily young, full-length L1s located within transcriptionally permissive euchromatic environment, and promote H3K9me3 deposition for transcriptional silencing. Interestingly, these silencing events often occur within introns of transcriptionally active genes and lead to down-regulation of host gene expression in a HUSH/MORC2-dependent manner. Together, we provide a rich resource for studies of L1 retrotransposition, elucidate a novel L1 restriction pathway, and illustrate how epigenetic silencing of TEs rewires host gene expression programs.
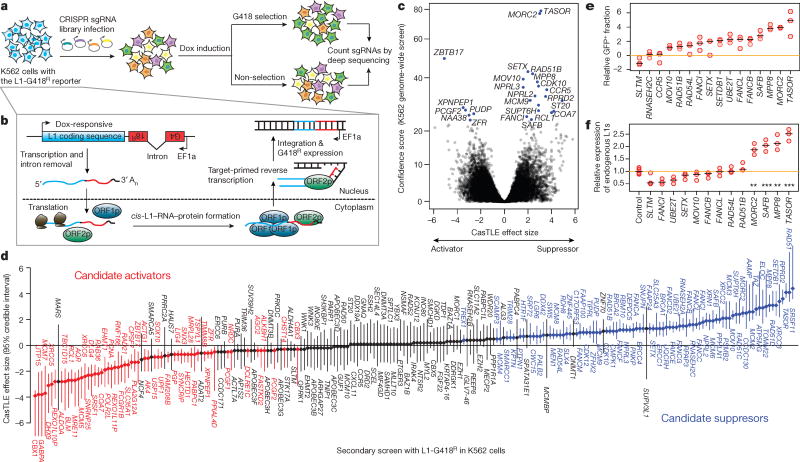
Most of our knowledge about L1 retrotransposition control comes from studies examining individual candidate genes2,3,4,5,6. To systematically identify genes regulating L1 retrotransposition, we performed a genome-wide CRISPR/Cas9 screen in human chronic myeloid leukemia K562 cells using an L1-G418R retrotransposition reporter9 (Fig. 1a,b). Importantly, the L1-G418R reporter was modified to be driven by a doxycycline (dox)-responsive promoter, as opposed to the native L1 5’UTR, to avoid leaky retrotransposition ahead of the functional screen (Extended Data Fig. 1a–c). The cells become G418R antibiotic resistant only when the L1-G418R reporter undergoes a successful retrotransposition event following dox-induction (Fig. 1b). For the screen, we transduced clonal L1-G418R cells with a lentiviral genome-wide sgRNA library such that each cell expressed a single sgRNA10. We then dox-induced the cells to turn on the L1-G418R reporter for retrotransposition, and split the cells into G418-selected conditions and unselected conditions, which served to eliminate cell growth bias in the screen analysis. The frequencies of sgRNAs in the two populations were measured by deep sequencing (Fig. 1a) and analyzed using Cas9 high-Throughput maximum Likelihood Estimator (CasTLE)11. Consequently, cells transduced with sgRNAs targeting L1 suppressors would have more retrotransposition events than negative control cells and would be enriched through the G418 selection; conversely, cells transduced with sgRNAs targeting L1 activators would be depleted.
Figure 1.
Genome-wide screen for L1 activators and suppressors in K562 cells.
a. Schematic for the screen.
b. Schematic for the L1-G418R retrotransposition.
c. CasTLE analysis of (n = 2) independent K562 genome-wide screens. Genes at 10% FDR cutoff colored in blue, CasTLE likelihood ratio test11.
d. The maximum effect size (center value) estimated by CasTLE from two independent K562 secondary screens with 10 independent sgRNAs per gene. Bars, 95% credible interval (CI). L1 activators, red; L1 suppressors, blue; insignificant genes whose CI include 0, gray.
e. L1-GFP retrotransposition in control (infected with negative control sgRNAs, hereinafter referred to as ‘Ctrl’) and mutant K562 cells as indicated. GFP(+) cell fractions normalized to Ctrl. Center value as median. n = 3 biological replicates per gene.
f. RT-qPCR measuring endogenous L1Hs expression in mutant K562 cells, normalized to Ctrl. Center value as median. n = 3 technical replicates per gene. **P < 0.01; ***P < 0.001; two-sided Welch t-test.
Using the above strategy, we identified 25 putative L1 regulators at a 10% FDR cutoff, and 150 genes at a 30% FDR cutoff (Fig. 1c and Extended Data Fig. 1d; see Table S1 for full list). Despite low statistical confidence, many of the 30% FDR cutoff genes overlapped previously characterized L1 regulators (e.g. ALKBH1, SETDB1) and genes functioning in complexes with our top 10% FDR hits (e.g. Fanconi Anemia pathway, HUSH complex), suggesting that they likely encompassed biologically relevant hits. To increase statistical power in distinguishing bona fide L1 regulators among these, we performed a high-coverage secondary screen targeting the 30% FDR hits (150 genes) and an additional 100 genes that were either functionally related to our top hits or which were otherwise previously known to regulate L1 but fell outside of the 30% FDR cutoff threshold (See Table S2 for full list). This secondary screen validated 90 genes out of the top 150 genome-wide screen hits, a fraction close to expected with the 30% FDR cutoff (Fig. 1d and Extended Data Fig. 2a–c).
Altogether, our two-tier screening approach identified 142 human genes that either activate or repress L1 retrotransposition in K562 cells, encompassing over 20 previously known L1 regulators (Extended Data Fig. 2d). Novel candidates are involved in functionally diverse pathways, such as chromatin/transcriptional regulation, DNA damage/repair, and RNA processing (Extended Data Fig. 2e,f). While many DNA damage/repair factors, particularly the Fanconi Anemia (FA) factors, suppress L1 activity, genes implicated in the Non-Homologous End Joining (NHEJ) repair pathway promote L1 retrotransposition (Extended Data Fig. 2f). In agreement, mutations in some of the identified NHEJ factors were previously found to result in decreased retrotransposition frequencies12. Intriguingly, many hits uncovered by our screen (e.g. FA factors, MORC2 and SETX) are associated with human disorders13,14,15,16,17.
To extend our survey of L1 regulators to another cell type, we performed both a genome-wide and a secondary screen in HeLa cells (Extended Data Fig. 1b, 1e) with the same sgRNA libraries used in the K562 screens. Importantly, top hits identified in the K562 genome-wide screen were recapitulated in the HeLa screen (e.g. MORC2, TASOR, SETX, MOV10) (Extended Data Fig. 3a). Furthermore, secondary screens in both K562 and HeLa cells showed concordant effects for groups of genes, for example, the suppressive effects of the FA complex genes, and activating effects of the NHEJ pathway genes (Extended Data Fig. 3b–e). Interestingly, however, a subset of genes showed cell-line selective effects (Extended Data Fig. 3c). At the same time, some of the previously known L1 regulators did not come up as hits in our screen. Several factors could have limited our ability to identify all genes controlling L1 retrotransposition to saturation, such as: (i) a subset of regulators may function in a cell-type specific manner not captured by either K562 or HeLa screens, (ii) essential genes with strong negative effects on cell growth may have dropped out, (iii) regulators that strictly require native L1 UTR sequences may have been missed due to our reporter design. Nonetheless, our combined screens identify many novel candidates for L1 retrotransposition control in human cells and provide a rich resource for mechanistic studies of TEs.
Select screen hits were further validated in K562 cells using a well-characterized L1-GFP reporter18 (Extended Data Fig. 1a), confirming 13 suppressors and 1 activator (SLTM) out of 16 examined genes (Fig. 1e). Interestingly, chromatin regulators (TASOR, MORC2, MPP8, SAFB and SETDB1) suppress the retrotransposition of L1-GFP reporter, but not that of a previously described codon-optimized L1-GFP reporter (hereinafter referred to as (opt)-L1-GFP)19,20, indicating that these factors regulate L1 retrotransposition in a manner dependent upon the native L1 ORF nucleotide sequence (Extended Data Fig. 3f,g). An additional secondary screen against the codon-optimized (opt)-L1-G418R reporter in K562 cells confirmed the sequence-dependent feature of these L1 regulators, and systematically partitioned our top screen hits into native L1 sequence-dependent and –independent candidates (Extended Data Fig. 3h, see Table S2 for full list).
We next examined whether the identified regulators influence the expression of endogenous L1Hs, the youngest and only retrotransposition-competent L1 subfamily in humans. CRISPR-deletion of some genes (TASOR, MPP8, SAFB and MORC2) significantly increased expression of endogenous L1Hs, whereas deletion of other genes, such as SETX, RAD51 or FA complex components, had little effect (Fig. 1f). Since all interrogated genes restrict L1-GFP retrotransposition into the genome (Fig. 1e and Extended Data Fig. 4a), our results suggest that identified suppressors can function at either transcriptional or posttranscriptional level.
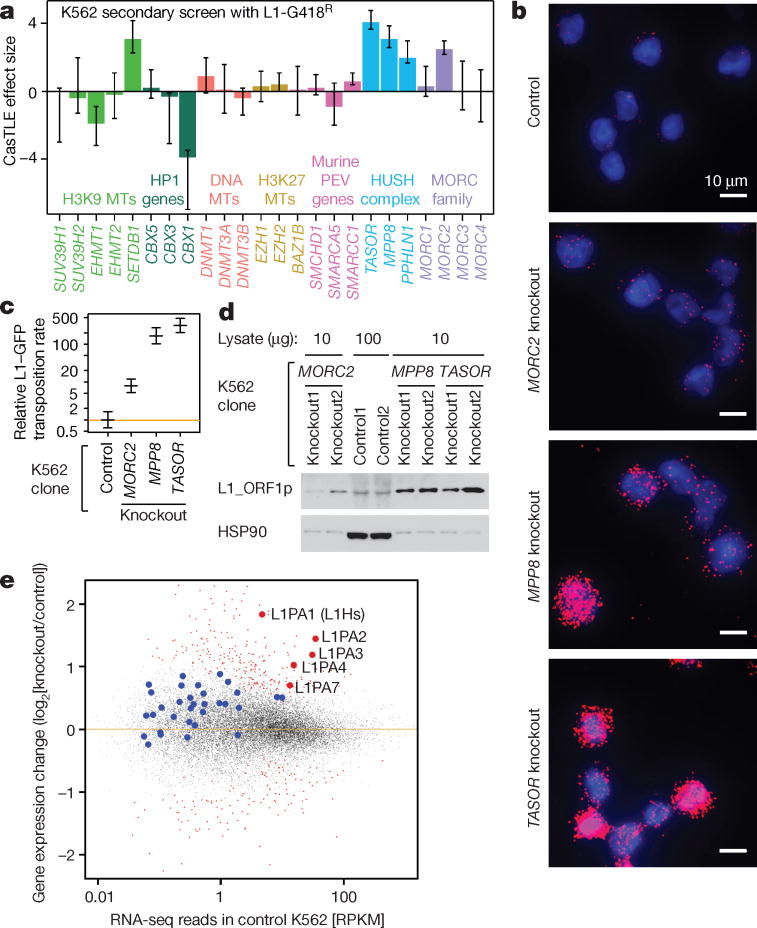
We further investigated three candidate transcriptional regulators of L1: MORC2, TASOR and MPP8. TASOR and MPP8 (along with PPHLN1), comprise the HUSH complex and recruit the H3K9me3 methyltransferase SETDB1 to repress genes8. Notably, PPHLN1 and SETDB1 also came up as L1 suppressors in our screen (Fig. 1d and Extended Data Fig. 3b). MORC2, which has recently been shown to biochemically and functionally interact with HUSH21, is a member of the microrchidia (MORC) protein family that has been implicated in transposon silencing in plants and mice22,23. While MORC2/HUSH have been previously implicated in heterochromatin formation, most heterochromatin factors had no impact on L1 retrotransposition, suggesting a selective effect (Fig. 2a and Extended Data Fig. 4b).
Figure 2.
HUSH and MORC2 silence L1 transcription to inhibit retrotransposition.
a. The maximum effect size (center value) of indicated heterochromatin regulators, estimated by CasTLE from two independent K562 secondary screens with 10 independent sgRNAs per gene. Error bars, 95% credible intervals.
b. Visualization of L1-GFP mRNAs in dox-induced K562 clones, from single smFISH experiment that was independently repeated twice with similar results. See also Extended Data Fig. 4d,e.
c. L1-GFP retrotransposition rate18 (center value) in K562 clones, from logistic regression fit of the GFP(+) cell counts at 7 time points (0, 5, 10, 15, 20, 25, 30 days post-induction) and two independent clones per gene. Over 200 GFP(+) cells per cell count. Data normalized to Ctrl. Bar, 95% credible interval.
d. Endogenous L1_ORF1p level in K562 clones by western blots, HSP90 as loading control. Three experiments repeated independently with similar results.
e. RNA-seq read counts from MORC2 KO, MPP8 KO and TASOR KO K562 clones, compared to Ctrl RNA-seq reads. n = 6 + 2 biologically independent RNA-seq experiments). Dots represent transcripts; large dots represent L1 transcripts. Red, significant changes (padj < 0.1, DESeq analysis); blue and gray, insignificant changes.
Several independent experiments in clonal knockout (KO) K562 lines confirmed that HUSH and MORC2 suppress the retrotransposition of the L1-GFP reporter by silencing its transcription (Fig. 2b,c and Extended Data Fig. 4c–f). Additionally, HUSH/MORC2 repressed endogenous (non-reporter) L1Hs RNA and protein expression in both K562 and human embryonic stem cells24 (hESC, H9) (Fig. 2d and Extended Data Fig. 4g–k). PolyA-selected RNA sequencing (RNA-seq) experiments revealed up-regulated expression of evolutionarily younger L1PA families (including L1Hs) upon HUSH or MORC2 KO in K562 cells (Fig. 2e). Taken together, these data demonstrate that HUSH/MORC2 silence both the reporter transgene as well as endogenous evolutionarily young L1s.
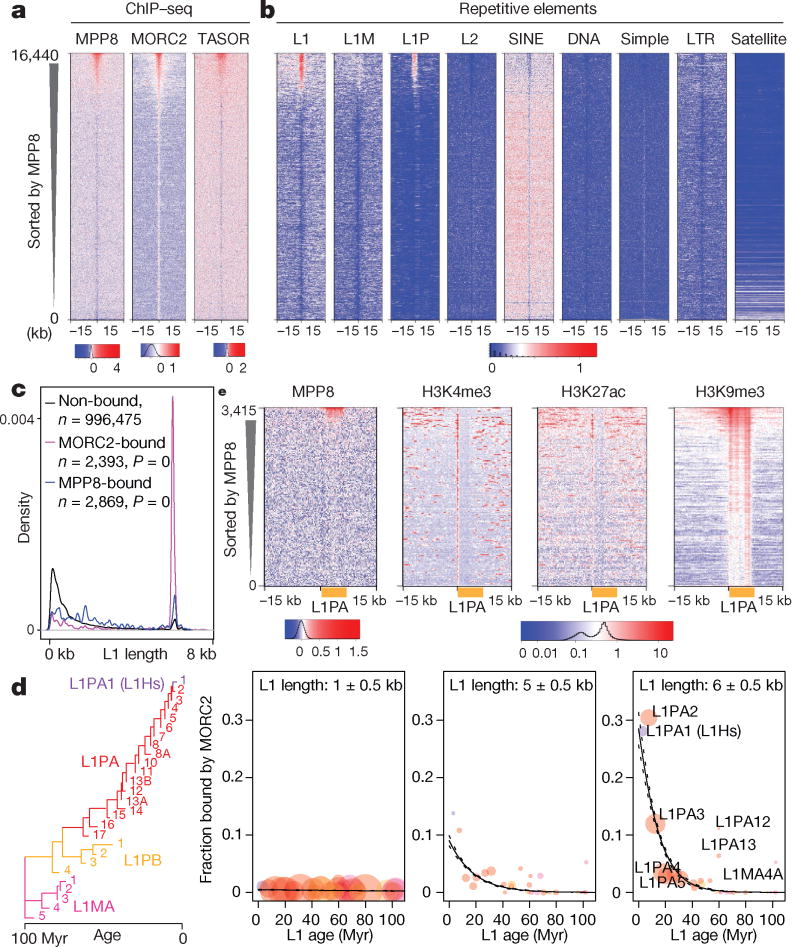
Chromatin immunoprecipitation followed by sequencing (ChIP-seq) from K562 cells and hESCs demonstrated that MORC2, MPP8 and TASOR co-bind genomic regions characterized by specific L1 instances. Elements from the primate-specific L1P family showed higher enrichment than the older L1M family elements (Fig. 3a,b and Extended Data Fig. 5a,b, 7a,b), consistent with the preferential derepression of the former upon HUSH or MORC2 KO (Fig. 2e). Moreover, this enrichment was specific to L1s, as other major repeat classes were not enriched (Fig. 3b and Extended Data Fig. 7b), although all three proteins also targeted expressed KRAB-ZNF genes (Extended Data Fig. 5c,d). HUSH KO in K562 cells almost completely abrogated MORC2 binding at L1s (consistent with recently published observations that HUSH recruits MORC2 for transcriptional repression21), whereas MORC2 deletion led to a modest, but appreciable decrease of HUSH subunit binding (Extended Data Fig. 6). In mouse ESCs, MPP8 bound retrotransposition-competent L1Md-A and L1Md-T, as well as IAP elements, a class of murine endogenous retroviruses that remain currently mobile in the mouse genome (Extended Data Fig. 7c,d), suggesting that regulators uncovered by our study in human cells may in other species target additional active transposons beyond L1s.
Figure 3.
HUSH/MORC2 target young full-length L1s in euchromatic environment.
a. Heatmaps showing signal enrichment of ChIPs with indicated antibodies in K562 cells, sorted by MPP8 ChIP signal and centered on MPP8 and MORC2 peaks. Plotted is normalized ChIP signal (Ctrl subtracted with corresponding KO).
b. Heatmaps showing MPP8 and MORC2 ChIP signal enrichment over repetitive elements, centered and sorted as in (a).
c. Size distribution of the L1s bound or unbound by MORC2 or MPP8 in K562 cells. P-values, two-tailed Kolmogorov-Smirnov test.
d. Fraction of MORC2–bound L1s (center values) as function of L1 length (three size classes are presented) and age (predicted from the phylogenetic analysis27) in K562 cells. Colored circles represent L1 families, with areas proportional to count of L1 instances with indicated age and length. n = 1,501 MORC2–bound L1 + 200,160 unbound L1. p = 2.2 × 10−90 for age–length interaction term, lower for simple terms (ANOVA, χ2 test), plotted logistic regression lines with 95% credible interval.
e. Heatmaps showing signal enrichment of ChIPs with indicated antibodies in K562 cells, centered on the 5’ end of full-length L1PAs.
Interestingly, even within younger human L1Ps only a subset is bound by HUSH/MORC2 in either K562 cells or hESCs, and we sought to identify genomic or epigenomic features that could explain this selectivity. We found that HUSH/MORC2 selectively target young full-length L1s, particularly the L1PA1-5 in human cells (Fig. 3c,d) and L1Md-A/T in mice (Extended Data Fig. 7e). Both MPP8 and MORC2 bind broadly across the L1: while MORC2 binding is skewed towards the 5’ end, MPP8 shows higher enrichments within the body and at 3’ end of L1PAs, including the L1Hs (L1PA1) elements (Extended Data Fig. 7f,g).
Nonetheless, preference for the full-length, evolutionarily younger L1PAs can only partially explain observed HUSH/MORC2 selectivity, as only a subset of such elements is targeted by the complex (Fig. 3d). We found that the additional layer of selectivity can be explained by the state of surrounding chromatin, with HUSH/MORC2-occupied L1s preferentially immersed within the transcriptionally permissive euchromatic environment marked by modifications such as H3K4me3 and H3K27ac (Fig. 3e). In agreement, HUSH/MORC2-bound L1s are enriched within introns of actively transcribed genes (Extended Data Fig. 8a,b). Furthermore, although most HUSH/MORC2-bound L1s are concordant between K562 and hESCs, those that are bound in a cell type-specific manner tend to be associated with genes that are differentially active between the two cell types (Extended Data Fig. 8c). To understand the role of transcription in HUSH/MORC2 targeting of L1s, we investigated MORC2 and MPP8 occupancy at the inducible L1 transgene. We observed increased binding of these factors upon transcriptional induction (Extended Data Fig. 8d), suggesting that transcription through L1 sequences facilitates HUSH/MORC2 binding. Taken together, HUSH/MORC2 selectively target young, full-length L1s located within transcriptionally permissive euchromatic regions, which are precisely the elements that pose the highest threat to genome integrity, as a subset of them remains mobile and transcription is the first step of L1 mobilization.
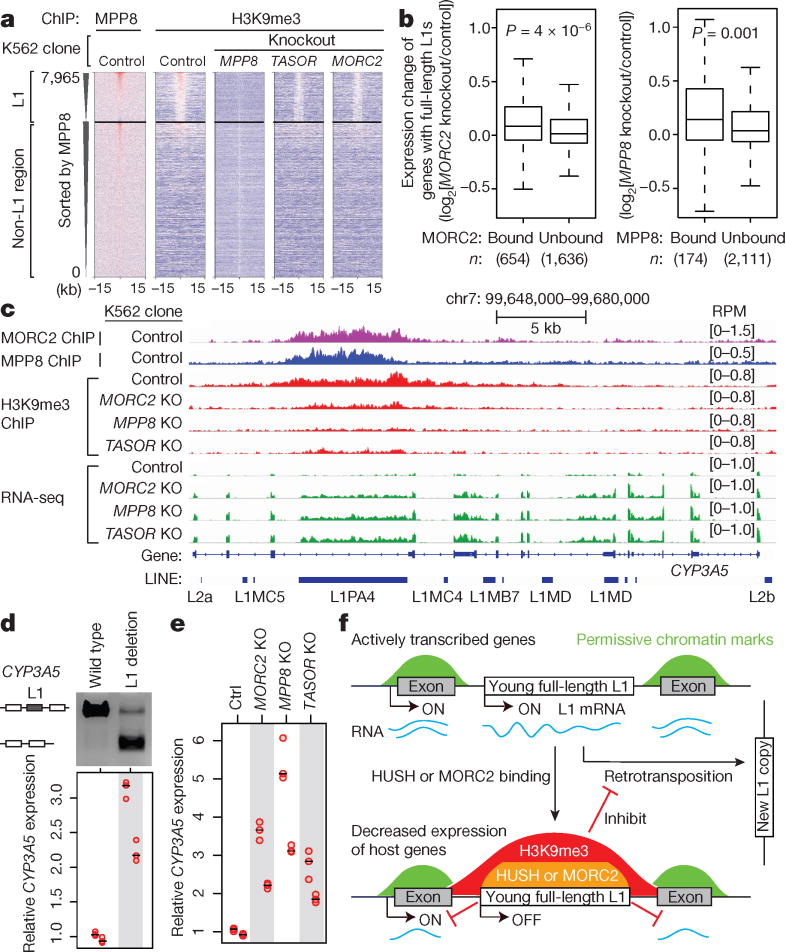
Despite their immersion within the euchromatic environment, HUSH/MORC2-bound L1s themselves are heavily decorated with the transcriptionally repressive H3K9me3 (Fig. 3e), consistent with the role of HUSH in facilitating H3K9me3 deposition at target sites8. HUSH/MORC2 KO decreased H3K9me3 level preferentially at L1 versus non-L1 HUSH/MORC2 genomic targets, and at bound versus unbound L1s (Fig. 4a and Extended Data Fig. 9a,b). Since HUSH/MORC2-bound L1s are significantly enriched within introns of transcriptionally active genes (Extended Data Fig. 8a–c), we examined whether HUSH/MORC2 recruitment and its associated H3K9me3 deposition can influence chromatin modification and expression of the host genes. Despite the transcriptionally active status (Extended Data Fig. 8a,b), promoters and especially bodies of genes harboring MORC2/HUSH-bound L1s show appreciable levels of H3K9me3. This enrichment is substantially diminished in the KO lines (Extended Data Fig. 9c) with the concomitant upregulation of genes harboring MORC2/HUSH-bound L1s, but not those with unbound intronic L1s (Fig. 4b). Thus, HUSH/MORC2 binding at intronic L1s leads to a modest, but significant down-regulation of the active genes that harbor them (Fig. 4c and Extended Data Fig. 9d–g, 10a).
Figure 4.
HUSH/MORC2 binding at L1s decreases active host gene expression.
a. Heatmaps showing MPP8 and H3K9me3 ChIP signal enrichment, centered on MPP8 and MORC2 summits and separated by L1 presence or absence.
b. Expression change of genes with intronic full-length L1s that are bound or unbound by MORC2 or MPP8 (RNA-seq reads from KO K562 clones compared to Ctrl). Box plots show median and interquartile range (IQR), whiskers are 1.5× IQR. p-value, two-sided Mann-Whitney-Wilcoxon test.
c. Genome browser tracks: HUSH/MORC2 loss causing H3K9me3 decrease at the target L1 and expression increase at both the target L1 and its host gene, independently repeated once with similar results.
d. Deleting the target intronic L1 from CYP3A5 in K562 increases CYP3A5 expression, by RT-qPCR normalized to wild-type sample. n = 2 biological replicates × 3 technical replicates (center value as median). Gel image confirms L1 deletion; two experiments repeated independently with similar results.
e. RT-qPCR for CYP3A5 expression in K562 clones, normalized to Ctrl. n = 2 biological replicates × 3 technical replicates (center value as median).
f. Model: HUSH/MORC2 bind young full-length L1s within transcriptionally active genes, and promote H3K9me3 deposition at target L1s to silence L1 transcription. This pathway not only inhibits L1 retrotransposition, but also decreases host gene expression.
Inserting L1 sequences on a transcript leads to decrease in RNA expression via inadequate transcript elongation,25 and this effect has been attributed to the A/T enrichment of L1s. However, our results argue that transcriptional attenuation of host gene expression could be a consequence of epigenetic silencing by HUSH/MORC2 (Fig. 4b,c and Extended Data Fig. 9d–g, 10a), and this possibility is consistent with the described role of genic H3K9me3 in decreasing Pol II elongation rate, leading to its accumulation over the H3K9me3 region26. If such mechanism is at play, then HUSH KO should decrease accumulation of the elongating Pol II over L1 bodies, and this is indeed what we observe in Pol II ChIP-seq experiments (though interestingly, at 5′ UTRs of L1s, Pol II levels are relatively elevated in the KOs) (Extended Data Fig. 10b).
Importantly, host gene regulation is directly dependent on the presence of the intronic L1, as deletion of select MORC2/HUSH-bound L1s from the intron led to the upregulation of host mRNA to a level commensurate with the magnitude of changes caused by HUSH/MORC2 KO (Fig. 4d,e and Extended Data Fig. 10c,d). Thus, dampening expression levels of an active gene can be a by-product of a retrotransposition event and associated HUSH/MORC2-mediated L1 silencing (Fig. 4f). Although observed effects on active host genes are only modulatory, they occur to various extents at hundreds of human genes, illustrating how TE activity can rewire host gene expression patterns.
METHODS
Cell culture and antibodies
K562 cells (ATCC) were grown in Roswell Park Memorial Institute (RPMI) 1640 Medium (11875093, Life Technologies) supplemented with 10% Fetal Bovine Serum (Fisher, Cat# SH30910), 2 mM L-glutamine (Fisher, Cat# SH3003401) and 1% penicillin-streptomycin (Fisher, Cat#SV30010), and cultured at 37 °C with 5% CO2. HeLa cells (ATCC) were grown in Dulbecco’s Modified Eagle’s Medium (Life Technologies, Cat# 11995073) supplemented with 10% FBS, 2 mM L-glutamine, and 1% penicillin-streptomycin, and cultured at 37 °C with 5% CO2. H9 human ES cells were expanded in feeder-free, serum-free medium mTeSR-1 from StemCell technologies, passaged 1:6 every 5–6 days using accutase (Invitrogen) and re-plated on tissue culture dishes coated overnight with growth-factor-reduced matrigel (BD Biosciences). Male mouse embryonic stem cells (R1) were grown as described28. Cell cultures were routinely tested and found negative for mycoplasma infection (MycoAlert, Lonza).
Rabbit MORC2 antibody (A300-149A, Bethyl Laboratories), Rabbit MPP8 antibody (16796-1-AP, Protein Technologies Inc), Rabbit TASOR antibody (HPA006735, Atlas Antibodies) were used in Western blots (1:1000 dilution) and ChIP assays. Mouse anti-LINE-1 ORF1p antibody (MABC1152, Millipore)29, Rabbit HSP90 (C45G5, Cell Signalling, #4877), Beta actin antibody (ab49900, Abcam) were used in Western blots. Histone H3 (tri-methyl K9) antibody (ab8898, Abcam) and RNA Pol II (Santa Cruz Biotechnology, N-20 sc-899) were used in ChIP assays.
L1 reporters
The L1-ORF1-ORF2 sequence is derived from the LRE-GFP30, a gift from John Moran. To make the L1-GFP reporter, we used Gibson assembly to clone the L1_ORF1/2 fragment and a GFP-B-globin-intron cassette driven by the mammalian promoter EF1a into the pB transgene using a dox inducible promoter (modified from PBQM812A-1, System Biosciences) to drive the L1 sequence and a UBC-RTTA3-ires Blast as a selectable marker for reporter integration. To make the L1-G418R reporter, we replaced the GFP-B-globin-intron fragment in the L1-GFP reporter with a NEO-intron-NEO cassette driven by the mammalian promoter EF1a. The codon-optimized L1-ORF1-ORF2 sequence in our (opt)-L1 reporter is derived from the SynL1_optORF1_neo, a gift from Astrid Engel31. We replaced the self-splicing Tetrahymena NEO-intron-NEO cassette with the neo-B-globin-intron-neo cassette driven by the EF1a promoter or the GFP-B-globin-intron-GFP cassette driven by the EF1a promoter. This L1-syn-ORF1-ORF2-indicator cassette was inserted into the pB transgene using a dox inducible promoter and a UBC-RTTA3-ires Blast, as described above.
Genome-wide screen in K562 cells
The K562 cell line (with a BFP-Cas9 lentiviral transgene) was nucleofected with the pB-tetO-L1-G418R/Blast construct and the piggyBac transposase (PB210PA-1, System Biosciences) following the manufacturer’s instructions (Lonza 2b nucleofector, T-016 program). The nucleofected cells were sorted using limiting dilution in 96-well plates, and positive clones were screened first for sensitivity to Blast, and then the ability to generate G418 resistant cells after dox induction. The Cas9/L1-G418R cells were lentivirally infected with a genome-wide sgRNA library as described10, containing ~200,000 sgRNAs targeting 20,549 protein-coding genes and 13,500 negative control sgRNAs at an MOI of 0.3-0.4 (as measured by the mCherry fluorescence from the lentiviral vector), and selected for lentiviral integration using puromycin (1 μg/ml) for 3 days as the cultures were expanded for the screens. In duplicate, 200×106 library-infected cells were dox-induced (1 μg/ml) for 10 consecutive days, with a logarithmic growth (500k cells/ml) maintained each day of the dox-induction. After dox-induction, the cells were recovered in normal RPMI complete media for 24 hours, and then split into the G418-selection condition (300 μg/ml G418, Life Technologies, Cat# 11811031) and non-selection conditions. After 7 days of maintaining cells at 500k/ml, 200 M cells under each condition were recovered in normal RPMI media for 24 hours, before they were pelleted by centrifugation for genomic DNA extraction using Qiagen DNA Blood Maxi kit (Cat# 51194) as described32. The sgRNA-encoding constructs were PCR-amplified using Agilent Herculase II Fusion DNA Polymerase (Cat# 600675) (See Table S4 for the primer sequences used). These libraries were then sequenced across two Illumina NextSeq flow cells (~40 M reads per condition; ~200× coverage per library element). Computational analysis of genome-wide screen was performed as previously described10,11 using CasTLE, which is a maximum likelihood estimator that uses a background of negative control sgRNAs as a null model to estimate gene effect sizes. See Table S1 for the K562 genome-wide screen results.
Secondary screen in K562 cells
The secondary screen library included the following, non-comprehensive sets of genes (253 genes in total, ~10 sgRNAs per gene, plus 2500 negative control sgRNAs): all genes falling within ~30% FDR from the K562 genome-wide screen (~150 genes), genes known to be functionally related to the 30% FDR genes, genes previously implicated in L1 biology, and genes involved in epigenetic regulation or position effect variegation (see Table S2 for a complete list). The library oligos were synthesized by Agilent Technologies and cloned into pMCB320 using BstXI/BlpI overhangs after PCR amplification. The Cas9/L1-G418R (or Cas9/(opt)-L1-G418R) K562 cell line was lentivirally infected with the secondary library (~4,500 elements) at an MOI of 0.3-0.4 as described previously33. After puromycin selection (1 μg/ml for 3 days) and expansion, 40 M (~9,000 coverage per library element) cells were dox-induced for 10 days in replicate, recovered for 1 day, and split for 7-day G418-selection and non-selection conditions, with a logarithmic growth (500k cells/ml) maintained as in the K562 genome-wide screen. 10M cells under each condition were used for genomic extractions, sequenced (~6-10M reads per condition; ~1000-2000× coverage per library element) and analyzed using casTLE as described above10,11. See Table S2 for the K562 secondary screen results with L1-G418R and (opt)-L1-G418R.
Genome-wide screen and Secondary screen in HeLa cells
The pB-tetO-L1-G418R/Blast construct was integrated into Cas9 expressing HeLa cells with piggyBac transposase via nucleofection (Lonza 2b nucleofector, I-013 program) following the manufacturer’s instructions. The Cas9/L1-G418R HeLa cells were blasticidin (10 μg/ml) selected, screened for sensitivity to G418 and the ability to generate G418 resistance cells after dox induction, and lentivirally infected with the genome-wide sgRNA library or with the secondary sgRNA library. Infected cells were then puromycin selected (1 μg/ml) for 5 days and expanded for the screens.
For the genome-wide screen, ~200×106 Cas9/L1-G418R HeLa cells (~1,000× coverage of sgRNA library) were dox-induced for 10 days in replicate, recovered for 1 day, and split for 8-day G418-selection and non-selection conditions, with cells being split every other day to maintain the sgRNA library at a minimum of ~350× coverage. ~200M (1,000× coverage) cells per condition were used for genomic extractions and sequencing as described above for the K562 screens. See Table S1 for the HeLa genome-wide screen results.
For the secondary screen, ~1×10⁷ Cas9/L1-G418R HeLa cells (~2,000× coverage of sgRNA library) were dox-induced for 10 days in replicate, recovered for 1 day, and split for 8-day G418-selection and non-selection conditions, with cells being split every other day to maintain ~400× coverage. ~5 million (1,000× coverage) cells per condition were used for genomic extractions and sequencing as described above. See Table S2 for the HeLa secondary screen results.
Validation of individual candidates using the L1-GFP retrotransposition assay
To validate the genome-wide screen hits, we infected clonal Cas9/L1-GFP K562 cells with individual sgRNAs as previously described32, 3 independent mutant cell lines per gene, each with a different sgRNA (cloned into pMCB320 using BstXI/BlpI overhangs; mU6:sgRNA; EF1a:Puromycin-t2a-mCherry). See Table S3 for sgRNA sequences. The infected cells were selected against puromycin (1 μg/ml) for 3 days, recovered in fresh RPMI medium for 1 day, and dox-induced for 10 days. Then, the percentage of GFP(+) cells was measured on a BD Accuri C6 Flow Cytometer (GFP fluorescence detected in FL1 using 488 nm laser) after gating for live mCherry(+) cells.
CRISPR-mediated deletion of individual genes and intronic L1s
To delete genes in H9 ESCs, we cloned target sgRNAs in pSpCas9(BB)-2A-GFP (PX458) as described34. The sgRNA plasmids were prepared with the Nucleospin plasmid kit (Macherey Nagel) and transfected into H9 ESCs using Fugene following the manufacturer’s instructions. After 48-72 hrs, GFP-positive transfected cells were sorted and expanded. Gene depletion effects were validated by western blots.
To delete the L1 from the host gene intron, we designed sgRNAs targeting both upstream and downstream side of the L1 within the intron; one was cloned into pSpCas9(BB)-2A-BFP, while the other into pSpCas9(BB)-2A-GFP. The two sgRNA plasmids were mixed at 1:1 ratio and nucleofected into K562 cells via electroporation following the manufacturer’s instructions. After 48-72 hours, BFP/GFP-positive transfected cells were single-cell sorted and expanded. The genetic deletion effects were validated by PCR assay.
Western blotting
Live cells were lysed for 30 min at 4°C in protein extraction buffer (300 mM NaCl, 100 mM Tris pH 8, 0.2 mM EDTA, 0.1% NP40, 10% glycerol) with protease inhibitors and centrifuged to collect the supernatant lysate. The cell lysate was measured with Bradford reagent (Biorad), separated on SDS-PAGE gels and transferred to nitrocellulose membranes. The L1-reporter containing K562 cells had not been dox-induced when used for western blot assays characterizing endogenous L1_ORF1p levels (Fig. 2d and Extended Data Fig. 4k).
PCR and gel electrophoresis
PCR experiments characterizing the L1-G418R retrotransposition and the deletion of intronic L1s were performed with Phusion High-Fidelity DNA Polymerase (M0530S, NEB), following the manufacturer’s instructions. In general, 30 cycles of PCR reactions were performed at an annealing temperature 5 ºC below the Tm of the primer. No ‘spliced’ PCR products can be detected without dox-induction, even with 40 PCR cycles. PCR reaction products were separated on 1% agarose gels with ethidium bromide. Primer sequences are in Table S4.
qRT-PCR and PspGI-assisted qPCR
Total RNA was isolated from live cells using the RNeasy kit (74104, Qiagen) and treated with RNase-Free DNase Set (79254, Qiagen) to remove genomic DNA, according to the manufacturer’s instructions. 500 ng total RNA was reverse transcribed with SuperScriptA III First-Strand Synthesis System (18080051, Life Technologies) following the manufacturer’s instructions. Beta-actin mRNA was used as internal control within each RNA sample (Fig. 1f and 4d,e). The sequences of PCR primers, including the one targeting the 5′UTR of L1Hs35,36,37, are summarized in Table S4.
Genomic DNA was isolated using PureLink Genomic DNA Mini Kit (K182001, Life Technologies) with RNase A digestion to remove contaminant RNA, according to the manufacturer’s instructions. 300 ng genomic DNA per sample was digested with 50 units PspGI (R0611S, New England Biolabs) in 1× smart buffer (NEB) at 75 °C for 1hr, to cut uniquely at the intron of the GFP cassette. The reaction mixture was then used in qPCR experiments with primers flanking the intron in the GFP cassette (Table S4). Due to the PspGI digestion, the original unspliced L1-GFP reporter will not be amplified by PCR. Only newly integrated GFP cassettes, where the intron was removed during the retrotransposition process, can be PCR amplified. qPCR runs and analysis were performed on the Light Cycler 480II machine (Roche).
Northern Blotting
Northern blotting was conducted as previously described38. Briefly, 15 μg of total RNA from K562 cells or H9 ESC cells was separated on the 0.7% formaldehyde agarose gel, capillary transferred overnight in 20× SSC to the Hybond N membrane (GE Healthcare), crosslinked with a Stratalinker (Stratagene), and hybridized with32 P-labeled single-stranded DNA probes (106 cpm/ml) in ULTRAhyb-Oligo Hybridization Buffer (AM8663, Life Technologies) following the manufacturer’s instructions. Blots were washed two times with wash buffer (2X SSC, 0.5%SDS), and then exposed to film overnight to several days at –80°C with an intensifying screen. The sequence of oligonucleotide probes is in Table S3.
Single molecule FISH
Single molecule FISH (smFISH) assays were performed following the affymetrix Quantigene ViewRNA ISH Cell Assay user manual. 2.5-5 million live K562 cells were fixed within 4% formaldehyde in 1× PBS for 60 mins at RT, resuspended in 1× PBS, pipetted onto poly-L-lysine coated glass cover slip (~20,000 total cells/spot; spread out with a pipette tip), and baked in dry oven at 50±1 °C for 30 minutes to fix the cells onto the glass slip, followed by digestion with Protease QS (1:4000) in 1× PBS for 10 minutes at RT. Cells were hybridized with smFISH probes, designed to target beta actin mRNA (FITC channel) and the L1-GFP reporter mRNA (Cy3 channel), DAPI stained for 5 mins, and mounted with Prolong Gold Antifade Reagent (10 ml/sample). Images were taken by spinning disk confocal microscope equipped with 60× 1.27NA water immersion objective with an effective pixel size of 108×108 nm. Specifically, for each field of view, a z-series of 8 μm is taken with 0.5 μm/z-step for all 3 channels. For quantitation, maximum-projected images from the z-series is used and analyzed by a custom-written matlab script. In brief, all images are first subtracted with the background determined with the OTSU method39 from the log-transformed image after pillbox blurring with a radius of 3 pixels. mRNA puncta are segmented by tophat filter using the background subtracted images and only the ones above 25th percentile intensity of all segmented puncta are taken for downstream analysis. Each punctum is then assigned to the nuclear mask identified by image areas above the previously determined background. For each single cell, the assigned pixel area of L1-GFP mRNA is then normalized to the assigned pixel area of beta-actin mRNA per cell.
RNA-seq
Two independent biological replicates of K562 cells in culture were extracted to isolate DNA-free total RNA sample, using the RNeasy kit (74104, Qiagen) combined with the RNase-Free DNase Set (79254, Qiagen). PolyA-selected RNA were isolated using ‘Dynabeads mRNA Purification Kit for mRNA Purification from Total RNA preps’ (610-06, Life Technologies) following the manuals. 100 ng polyA-selected RNA was fragmented with NEBNext Magnesium RNA Fragmentation Module (E6150S, New England Biolabs), and used for first strand cDNA synthesis with SuperScriptII (18064-014, Invitrogen) and random hexamers, followed by second strand cDNA synthesis with RNAseH (18021-014, Invitrogen) and DNA PolI (18010-025, Invitrogen). The cDNA was purified, quantified, multiplexed and sequenced with 2× 75bp pair-end reads on an Illumina NEXT-seq (Stanford Functional Genomics Facility).
RNA-seq reads were aligned to hg38 reference genome with hisat2 (–no-mixed, –no-discordant) without constraining to known transcriptome. Known (gencode 25) and de-novo transcript coverages were quantified with featureCount. Repeat Masker coverage was quantified with bedtools coverage. Reads mapping to the same repeat family were then tabulated together, since individual read coverage was too low to obtain meaningful results. Differential expression analysis of join gene-repeat data was performed with DESeq240.
ChIP-seq
Two replicates of ChIP experiments per sample were performed as previously described41,42. Approximately 0.5–1 × 10⁷ cells in culture per sample were crosslinked with 1% paraformaldehyde (PFA) for 10 min at room temperature (RT), and quenched by 0.125 M glycine for 10 min at RT. Chromatin was sonicated to an average size of 0.2-0.7 kb using a Covaris (E220 evolution). Sonicated chromatin was incubated with 5-10 μg antibody bound to 100 μl protein G Dynabeads (Invitrogen) and incubated overnight at 4 °C, with 5% kept as input DNA. Chromatin was eluted from Dynabeads after five times wash (50 mM Hepes, 500 mM LiCl, 1 mM EDTA, 1% NP-40, 0.7% Na-deoxycholate), and incubated at 65 °C water bath overnight (12-16 hrs) to reverse crosslinks. ChIP DNA were subject to end repair, A-tailing, adaptor ligation and cleavage with USER enzyme, followed by size selection to 250-500 bp and amplification with NEBNext sequencing primers. Libraries were purified, quantified, multiplexed (with NEBNext Multiplex Oligos for Illumina kit, E7335S) and sequenced with 2× 75 bp pair-end reads on an Illumina NEXT-seq (Stanford Functional Genomics Facility).
ChIP-seq reads were trimmed with cutadapt (-m 50 -q 10) and aligned with bowtie2 (version 2.2.9, –no-mixed –no-discordant –end-to-end -maxins 500) to the hg38 reference genome. ChIP peaks were called with macs2 (version 2.1.1.20160309) callpeak function with broad peak option and human genome effective size using reads form corresponding loss of gene lines as background model. Visualization tracks were generated with bedtools genomecov (-bg -scale) with scaling factor being 10^6/number aligned reads and converted to bigWig with bedGraphToBigWig (Kent tools). BigWigs were plotted with IGV browser. Individual alignments were inspected with IGB browser.
Heatmaps were generated by intersecting bam alignment files with intervals of interest (bedtools v2.25.0), followed by tabulation of the distances of the reads relative to the center of the interval and scaling to account for total aligned read numbers (10^6/number aligned). Heatmaps were plotted using a custom R function. Aggregate plots were generated by averaging rows of the heatmap matrix. For ChIPs in Ctrl and KO K562 clones, ChIP-seq signals in the corresponding KO cells were used as the null reference.
For ChIP-seq repetitive sequence relationship analysis, repeat masker was intersected with ChIP-seq peak calls to classify each masker entry as MPP8 bound, MORC2-bound or unbound. Enriched families of repeats were identified with R fisher.test() followed by FDR correction with qvalue(). Distribution of sizes of occupied vs non-occupied L1 was plotted using R density() with sizes being taken from repeat masker. ks.test() was used to reject null hypothesis that distribution of sizes for bound and unbound L1s is the same. To investigate relationship between L1 age, length and occupancy, logistic regression was performed with R glm() engine.
Quantitative analysis of H3K9me3 changes was performed by first identifying regions of significant enrichment in each sample relative to corresponding input sample (macs2 callpeak), merging the intervals into a common superset. This superset was joined with a decoy randomized set of intervals, twice the size of actual experimental interval set, with the same size distribution (bedtools shuffle). Next the read coverage was determined for each sample (bedtools coverage) and regions with significant change together with fold changes were identified using DESeq240. H3K9me3 regions were classified into bound vs unbound by performing intersect with MORC2 and MPP8 ChIP peak calls.
Data availability
All sequencing data generated in this work has been deposited at GEO under the accession number: GSE95374. H3K4me3 and H3K27ac K562 ChIP-seq datasets in Fig. 3e are from BioProject (accession number PRJEB8620). hESC RNA-seq datasets in Extended Data Fig. 8c are from SRA run entries SRR2043329 and SRR2043330. The complete results of genome-wide screens in K562 and HeLa cells are in Table S1; The complete results of secondary screens in K562 and HeLa cells are in Table S2. The sequences of gRNAs and oligonucleotides used in this work are in Table S3 and Table S4. The uncropped scans with size marker indications are summarized in the Supplementary Figure. All data are available from the corresponding author upon reasonable request.
Code availability
Detailed Data and further code information are available on request from the authors.
Extended Data
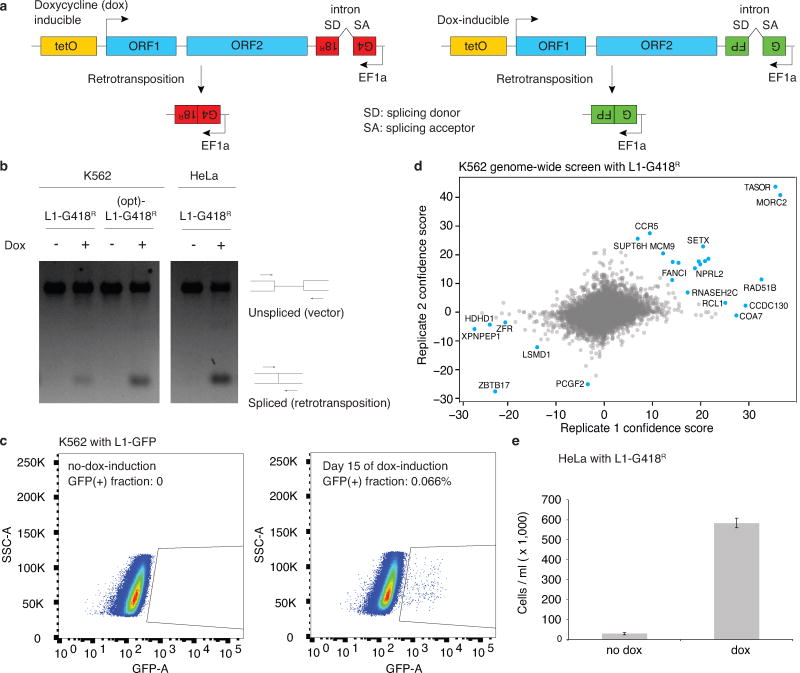
Extended Data Figure 1.
Genome-wide CRISPR/Cas9 screen for L1 regulators in K562 cells.
a. Schematic representation of L1-G418R and L1-GFP reporters used in this work.
b. PCR assay on genomic DNA using primers that flank the engineered intron within the G418R cassette. Two experiments repeated independently with similar results. The spliced PCR bands were not observed prior to dox induction in either K562 or HeLa cells, suggesting that the L1-G418R reporter was not activated prior to the screening. However, there may exist extremely low level of reporter leakiness that is below the PCR assay detection limits.
c. FACS results showing that the L1-GFP cells have no GFP signals without dox-induction (0 out of ~300,000 cells), and begin to produce GFP after dox-induction. Therefore, there is insignificant level of reporter leakiness without dox-induction. Two experiments repeated independently with similar results.
d. CasTLE analysis of genome-wide screens in K562 cells, with 20,488 genes represented as individual points. Genes falling under 10% FDR colored in blue, CasTLE likelihood ratio test11. n = 2 biologically independent screens.
e. HeLa with L1-G418R are resistant to G418 after dox-induction. 7 days of dox-induction followed by 10 days of G418 selection. Live cells in equal volumes were counted in a single (n = 1) FACS experiment. Center value, total number of live cells. Error bar, square root of total events assuming Poisson distribution of counts.
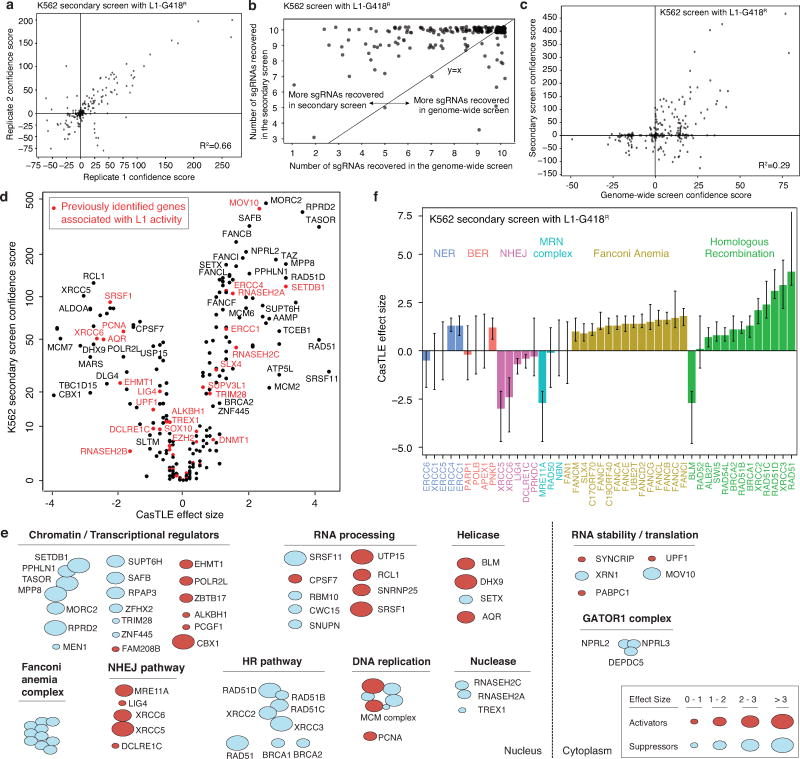
Extended Data Figure 2.
A secondary screen identifies functionally diverse L1 regulators in K562 cells.
a. Reproducibility between two independent secondary screens (n = 2) in K562 cells. R-squared value, linear regression model.
b. The K562 secondary screen recovers more sgRNAs than the K562 genome-wide screen, suggesting a higher detection sensitivity in the secondary screen.
c. Comparison of the secondary screen data (252 genes from n = 2 independent screens) with the genome-wide screen data (n = 2 independent screens) in K562 cells. R-squared value, linear regression model.
d. Volcano plot showing K562 secondary screen results (252 genes from two independent screens), with genes previously implicated in L1 biology colored in red.
e. Classification diverse L1 activators and suppressors identified in K562 cells by their known biological process.
f. The maximum effect size (center value) of indicated DNA repair genes, estimated by CasTLE from two independent K562 secondary screens with 10 different sgRNAs per gene. Error bars, 95% credible intervals of the estimated effect size.
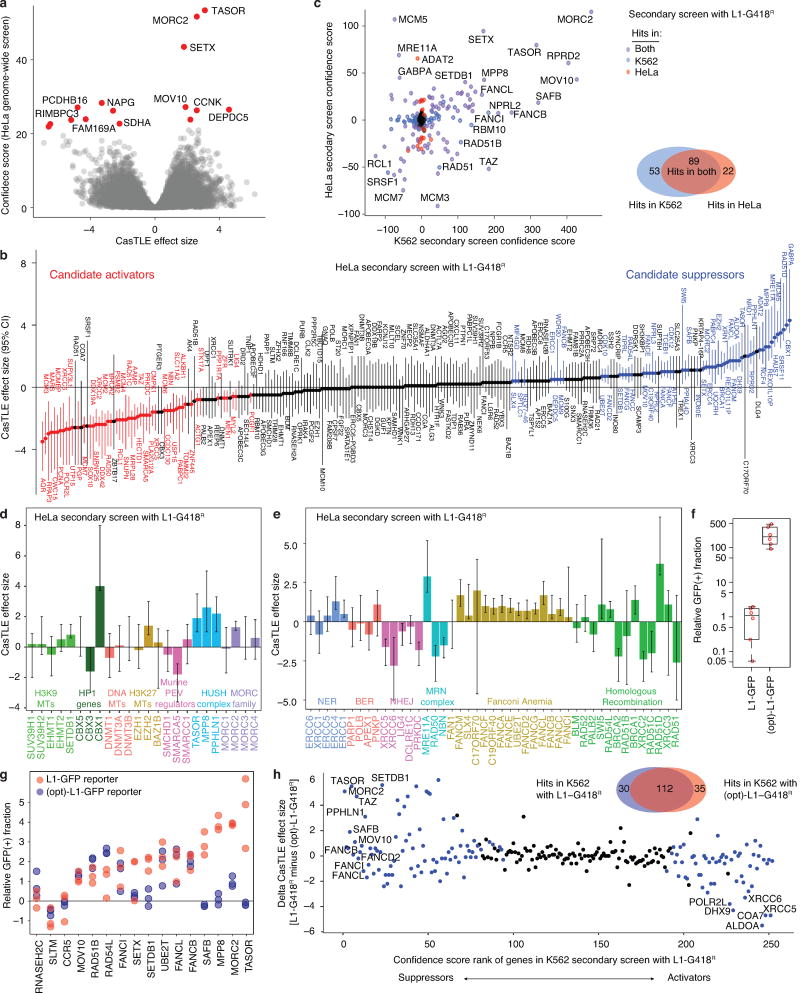
Extended data Figure 3.
Screen for L1 regulators in HeLa cells and and L1- sequence-dependent L1 regulators.
a. CasTLE analysis of two independent genome-wide screens in HeLa cells, with 20,514 genes represented as individual points. Genes at 10% FDR cutoff colored in red, CasTLE likelihood ratio test11.
b. The maximum effect size (center value) estimated by CasTLE from two independent HeLa secondary screens with 10 different sgRNAs per gene. Bars, 95% credible interval (CI). L1 activators, red; L1 suppressors, blue. Genes whose CI include zero are colored in gray and are considered non-effective against L1.
c. Scatter plots showing the secondary screen hits identified in K562 cells and HeLa cells (252 genes from two independent screens in each cell line), with Venn diagram comparing hits in the two cell lines is shown on the right.
d. The maximum effect size (center value) of indicated heterochromatin regulators, estimated by CasTLE from two independent HeLa secondary screens with 10 different sgRNAs per gene. Error bars, 95% credible intervals of the estimated effect size.
e. The maximum effect size (center value) of indicated DNA repair genes, estimated by CasTLE from two independent HeLa secondary screens with 10 different sgRNAs per gene. Error bars, 95% credible intervals of the estimated effect size.
f. The (opt)-L1-GFP reporter retrotransposed more frequently than L1-GFP did in K562. The GFP(+) fraction of cells with the indicated L1 reporter after 15 days of dox induction was normalization to the L1-GFP sample. Box plots show median and interquartile range (IQR), whiskers are 1.5× IQR. n = 6 biologically independent replicates.
g. The GFP(+) fraction of dox-induced Ctrl and mutant cell pools with the L1-GFP reporter or (opt)-L1-GFP reporter. Experiments were performed as Fig. 1e. Chromatin regulators (e.g. TASOR, MORC2, MPP8, SAFB) did not suppress the (opt)-L1-GFP reporter, in which 24% of the L1 ORF nucleotide sequence is altered, without changes in the encoded amino acid sequence19,20, indicating their L1 regulation depends on the native nucleotide-sequence of L1Hs.
h. K562 secondary screen with the (opt)-L1-G418R reporter (252 genes from n = 2 independent screens) revealed genes that regulate retrotransposition dependent or nondependent on the native L1 nucleotide sequence. The K562 secondary screen candidates identified with L1-G418R (252 genes from n = 2 independent screens) were labeled in blue. A Venn diagram comparing hits identified from the two L1-reporters is also shown.
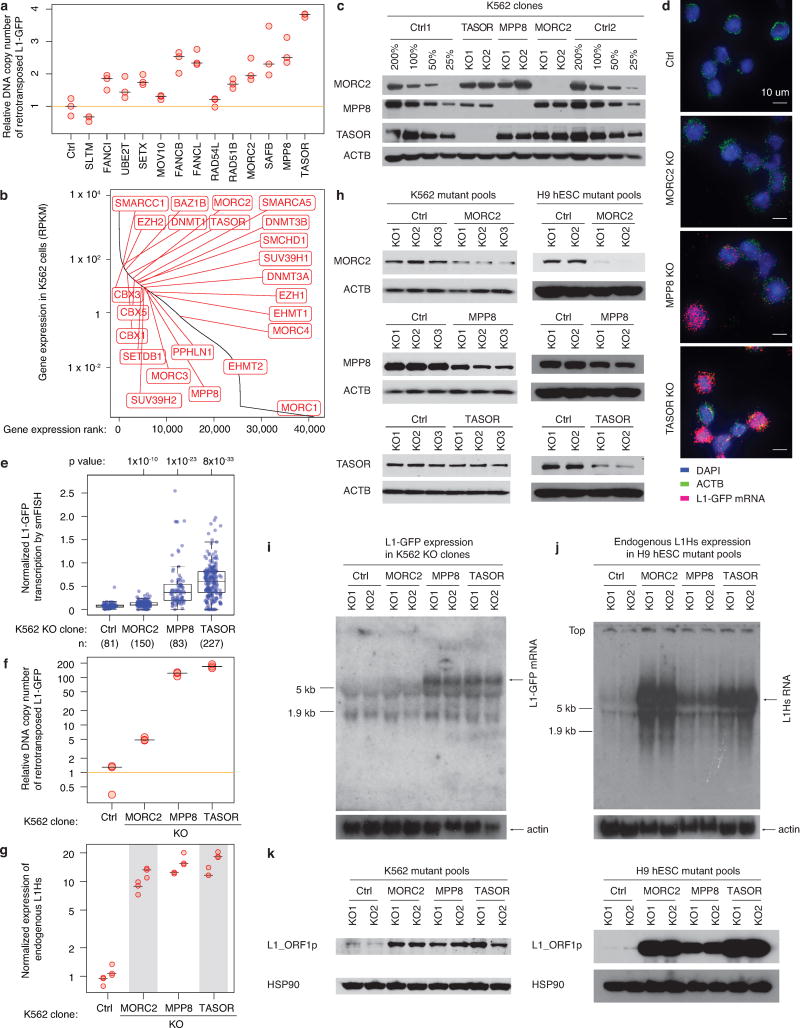
Extended Data Figure 4.
MORC2, MPP8 and TASOR silence L1 transcription.
a. Relative genomic copy number of newly integrated L1-GFP reporters in the indicated mutant K562 pools after dox-induction. PspGI-assisted qPCR assay used here was designed to selectively detect spliced GFP rather than the unspliced version (see Methods section). The L1-GFP copies were normalized to beta-actin DNAs; data then normalized to Ctrl. As a putative L1 activator, SLTM shows an opposite effect on the DNA copy number, compared with L1 suppressors. Center value as median. n = 3 technical replicates per gene.
b. RNA-seq data in Ctrl K562 cells showing that most heterochromatin regulators in Fig. 2a are expressed, supporting the selective effect of HUSH and MORC2 in L1 regulation.
c. Western blots validating the knockout (KO) effects in independent KO K562 cell clones. Ctrl samples were loaded at 4 different amounts (200%, 100%, 50%, 25% of KO clones). Three experiments repeated independently with similar results. To obtain KO clones, we sorted mutant K562 pools (cells used in Fig. 1e,f) into 96-well plates, expanded cells and screened for KO clones through western blotting. Of note, all K562 KO clones were derived from the same starting L1-GFP reporter line, and thus do not differ in reporter transgene integrations among the clones.
d. Representative images of single molecule FISH (smFISH) assays targeting ACTB mRNAs and RNA transcripts from L1-GFP reporters in Ctrl and KO K562 clones after 5 days of dox-induction. No signal was observed from L1-GFP reporters without dox-induction (data not shown). Two experiments repeated independently with similar results. See also panel e and Fig. 2b (showing L1-GFP mRNA only).
e. Quantitation of the L1-GFP transcription level from the indicated number of K562 cells, determined by smFISH assays (panel d and Fig. 2b). The number of L1-GFP mRNA transcripts is normalized to the number of beta-actin mRNAs within each K562 cell. Box plots show median and interquartile range (IQR), whiskers are 1.5× IQR. P-value, two-sided Wilcoxon test. 95% CI for median from 1,000× bootstrap: Control: 0.059-0.082; MORC2: 0.106-0.123; MPP8: 0.264-0.410; TASOR: 0.514-0.671.
f. MORC2, MPP8, and TASOR KOs increase the genomic copy number of newly integrated L1-GFP reporters. PspGI-assisted qPCR assays were performed as in panel a), but using clonal KO K562 clones instead of mutant cell pools. Data normalized to Ctrl. n = 3 technical replicates, center value as median.
g. MORC2 KO, MPP8 KO, and TASOR KO increase the expression of endogenous L1s. RT-qPCR experiments were performed as in (Fig. 1f), but using clonal KO K562 clones instead of mutant cell pools. n = 2 biological replicates × 3 technical replicates (center value as median). The primers do not target the L1-GFP reporter and the cell lines were not dox-induced, so these RT-qPCR assays will not detect L1-GFP transcripts.
h. Western blots showing depletion effects of MORC2, MPP8 and TASOR in the mutant pools of K562 cells (left) and in the mutant pools of H9 hESCs without transgenic L1 reporters (right). Two experiments repeated independently with similar results.
i. Northern blots showing increased transcription from the L1-GFP reporter in KO K562 clones (same cell lines as in panel c) after 5 days’ dox-induction. Two experiments repeated independently with similar results. As observed in Fig. 2b, while HUSH KO significantly increases L1-GFP transcription, MORC2 KO leads to only a modest increase. This is probably because the L1-GFP reporter does not contain the native L1 5’ UTR sequence, where MORC2 intensively binds (See Extended Data Fig. 7f,g). The 5 kb and 1.9 kb marks on the membrane refer to the 28S rRNA and 18S rRNA bands respectively.
j. Northern blots showing that disruption of MORC2, MPP8 and TASOR increases the expression level of endogenous L1Hs in hESCs, same cell lines as in panel h). Size marker indicated as in panel i). Two experiments repeated independently with similar results.
k. Western blots showing protein abundance of L1_ORF1p and HSP90 in the mutant pools of K562 cells and hESCs (same cell line as shown in panel h). Two experiments repeated independently with similar results. Experiments were performed without dox-induction of the transgenic L1 reporter. Due to the strong signal of bands from the KO samples, the blots were exposed for a very short time and the band signal in the Ctrl samples were relatively very weak compared to the KO samples; same case for panels i, j).
Extended Data Figure 5.
The binding profiles of MORC2, MPP8 and TASOR revealed by ChIP-seq in K562 cells.
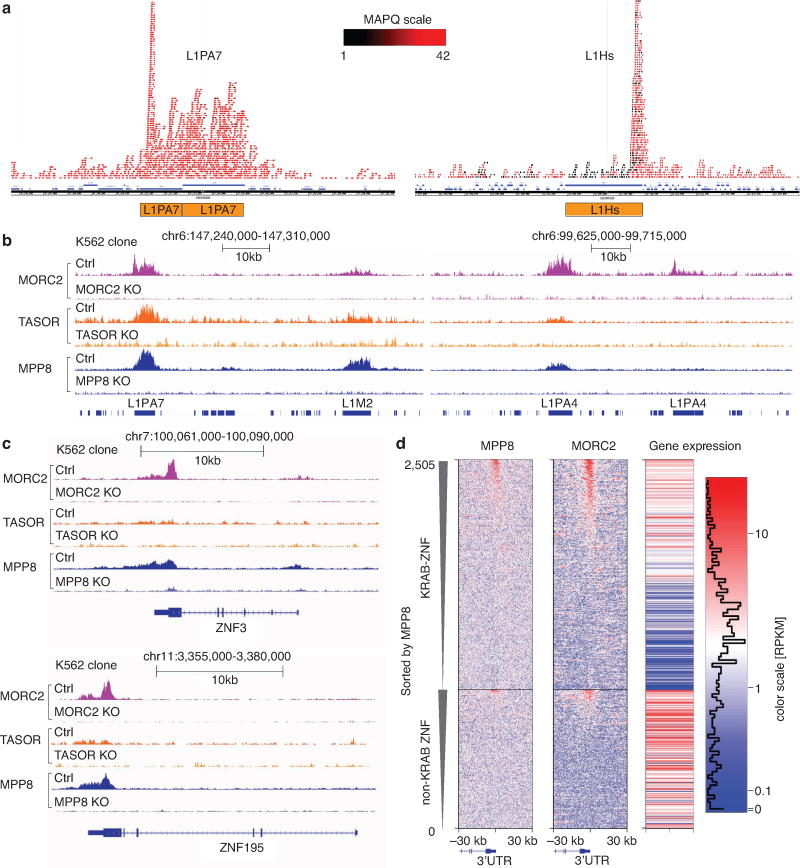
a. Using a paired-end sequencing strategy for the ChIP-seq, together with the sequence divergence within native L1 elements, we could map ChIP-seq reads to individual L1 instances in the genome. Genome browser snapshots of MORC2 ChIP-seq reads alignment over L1PA7 (left) and L1Hs (right). Experiment was repeated once with similar results. Color scale indicates mapping quality score (MAPQ) for each read pair. MAPQ = 10 log10 p, where p is the probability that true alignment belongs elsewhere. With the exception of L1Hs, which is the youngest and least sequence divergent family, the bodies of L1 repeats are uniquely mappable. In case of L1Hs, the 5′UTR is still mappable to determine the level of L1Hs in Ctrl and KO clones.
b. Genome browser snapshots for MPP8 (blue), TASOR (orange) and MORC2 (purple) ChIP-seq read densities from Ctrl and corresponding KO K562 clones at two representative example genomic loci. Experiment was repeated once with similar results. LINE element occurrences are indicated by blue rectangles at the bottom of the plot. Four instances of long L1 elements are named indicating L1 families they belong to. Note complete absence of ChIP-seq signal from KO lines and selectivity toward some but not other L1 instances. Of note, while MPP8 and MORC2 ChIP signals were robust, TASOR ChIPs showed relatively weak enrichments (either due to poor antibody quality or genuine biological properties); for this reason, a subset of our downstream analyses is focused on MORC2 and MPP8.
c. In addition to full length L1, HUSH complex and MORC2 bind 3′UTRs of KRAB Zinc Finger (ZNF) genes. Genome browser snapshots of ChIP-seq read densities over representative examples, from both Ctrl and corresponding KO K562 clones. Experiment was repeated once with similar results.
d. HUSH complex and MORC2 preferentially bind expressed KRAB-ZNF genes over other ZNF genes. Heatmaps of MPP8 (left) and MORC2 (center) signals over 2,600 ZNF genes, centered in the 3′ end of the genes and sorted first by the presence of KRAB domain and then by MPP8 ChIP signal. Upper 1,600 genes are KRAB-ZNF, lower 1,000 non-KRAB ZNF genes. Right heatmaps codes absolute expression level of each gene in RPKM scale from the K562 RNA-seq data (rightmost panel).
Extended Data Figure 6.
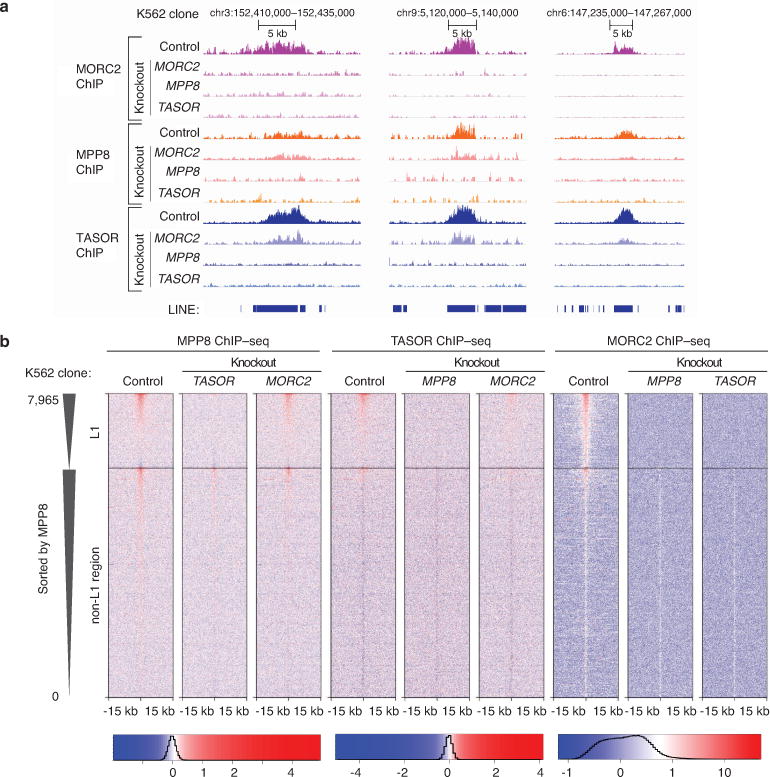
HUSH and MORC2 collaborate at binding target L1s.
a. Representative genome browser view of normalized ChIP-seq read densities over L1 elements. Experiment was repeated once with similar results. Loss of MPP8 and TASOR results in no detectable binding by MORC2, MPP8 and TASOR, while loss of MORC2 results in partially diminished recruitment of HUSH complex subunits.
b. Heatmaps of MPP8 (left), TASOR (center) and MORC2 (right) ChIP-seq signals subtracted for ChIP signal from corresponding KO lines. Heatmaps are centered on MPP8 and MORC2 peaks, separated by the presence or absence of underlying L1 and then sorted by MPP8 ChIP signal strength. Loss of MORC2 has only partial effect on recruitment of MPP8 and TASOR to the L1 elements, while loss of either MPP8 or TASOR abrogates MORC2 recruitment.
Extended Data Figure 7.
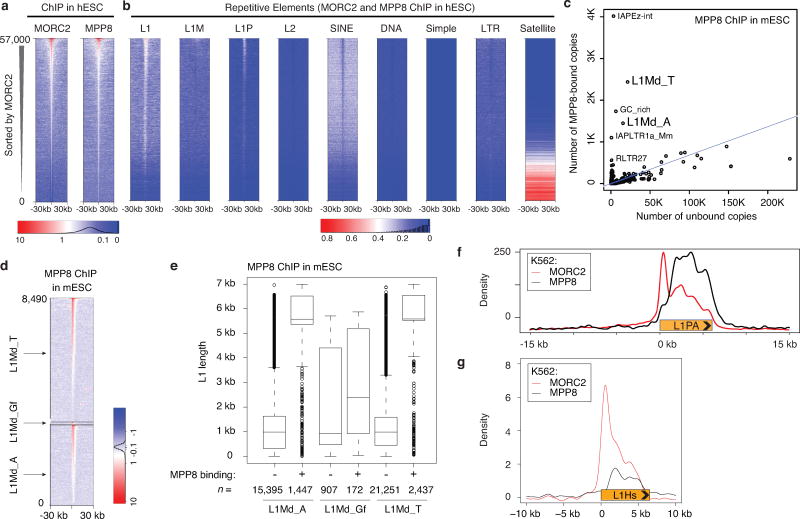
HUSH/MORC2 preferentially bind full-length L1 instances in human ESCs, mouse ESCs and K562 cells.
a. Widespread genomic co-binding of MPP8 and MORC2 in hESCs. Heatmap representation of ChIP-seq results at 57,000 genomic loci, centered on MPP8 and MORC2 summits and sorted by MORC2 ChIP-seq signal. Plotted is normalized ChIP read density from hESCs.
b. Heatmaps of MORC2/MPP8 ChIP-seq density over indicated repeat classes, centered and sorted as in panel a. HUSH complex and MORC2 bind predominantly to L1 elements in hESCs, in particular to the primate-specific L1P families, suggesting that HUSH/MORC2-dependent silencing is relevant in many embryonic and somatic cell types.
c. L1 families that encompass active L1 copies, such as L1Md-T and L1Md-A, are significantly enriched among MPP8 binding sites in mouse ESC. L1Md_Gf is also enriched but not shown due to the low number of instances. Thus, HUSH-mediated L1 regulation appears to be conserved among species. Of note, MPP8 is also strongly enriched at IAP elements, a class of murine endogenous retroviruses that remain currently mobile in the mouse genome.
d. MPP8 ChIP-seq heatmaps in mESCs featuring retrotransposition-competent L1Md-T, L1Md-A and L1Md-Gf.
e. MPP8 preferentially bind full-length L1Md-A and L1Md-T in mESCs. Plotted is size distribution of the indicated L1 instances that overlap with MPP8 ChIP-seq peaks, or remaining L1s that do not overlap with such ChIP-seq signals. Box plots show median and interquartile range (IQR), whiskers are 1.5× IQR.
f. Aggregate plots of MORC2 (red) and MPP8 (black) ChIP-seq signals over 500 full-length, MPP8-bound L1PAs, centered on the L1 5’ end.
g. Aggregate plots of MORC2 (red) and MPP8 (black) ChIP-seq signals on L1Hs (L1PA1). Similar as the binding profile on L1PA (panel f), MPP8/MORC2 occupy the whole body of L1Hs, with MORC2 additionally binding L1Hs 5′UTR. Please note that ChIP-seq fragments are much less likely to be uniquely mapped, and thus removed by the alignment criteria, within the L1Hs non-5’UTR region, due to their minimal sequence divergence (Extended Data Fig. 5a).
Extended Data Figure 8.
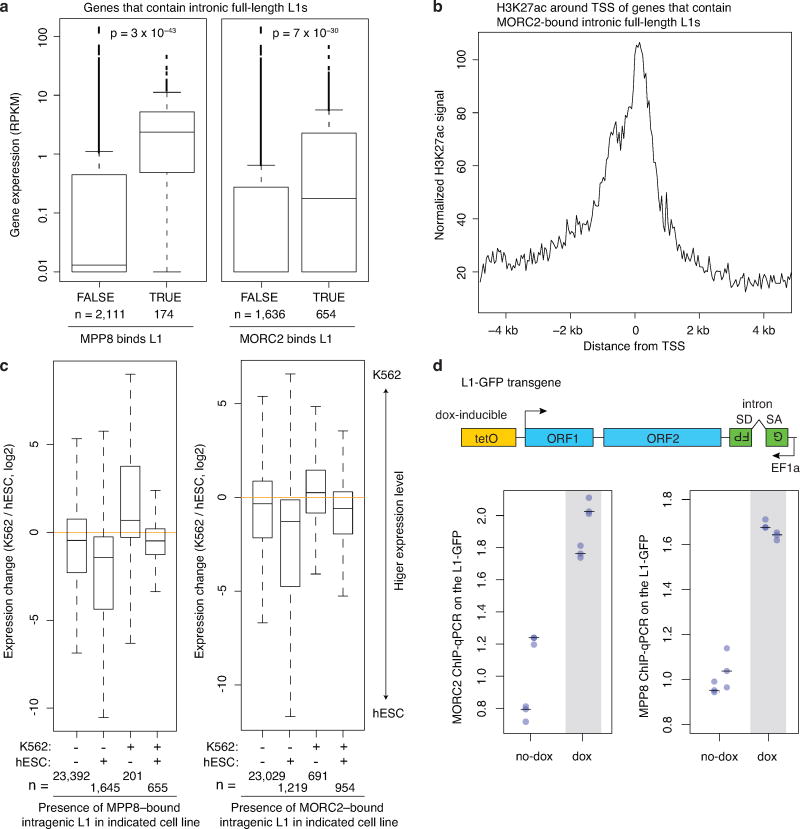
HUSH/MORC2 preferentially bind intronic L1s within actively transcribed genes.
a. Genes that contain MPP8 or MORC2 bound intronic L1s are expressed at significantly higher levels in Ctrl K562 cells, compared to genes that contain intronic full-length L1s unbound by MPP8 or MORC2. p-value, two-sided Mann-Whitney-Wilcoxon test. Box plots show median and interquartile range (IQR), whiskers are 1.5× IQR.
b. The promoters of genes that contain MPP8 or MORC2 bound intronic full-length L1s are marked by transcriptionally permissive H3K27ac in wild-type K562 cells. H3K27ac ChIP-seq data are taken from K562 epigenome pilot study, accession number PRJEB8620. TSS, transcription start site.
c. Genes selectively occupied by MORC2/MPP8 either in K562 or in hESC cells exhibit higher gene expression in the corresponding cell line (p-values = 4.3 × 10−107 for MPP8 binding; p-values = 5.0 × 10−92 for MORC2 binding, Kruskal-Wallis test). Boxplots defined as in panel a. RNA-seq datasets for hESC are from SRA entries SRR2043329 and SRR2043330.
d. ChIP-qPCR assays quantifying HUSH/MORC2 binding to an inducible L1 transgene in K562 cells before or after its transcriptional induction via Dox. Transcriptional induction increases binding of MORC2 and MPP8 to the L1 transgene. n = 2 biological replicates × 3 technical replicates (center value as median).
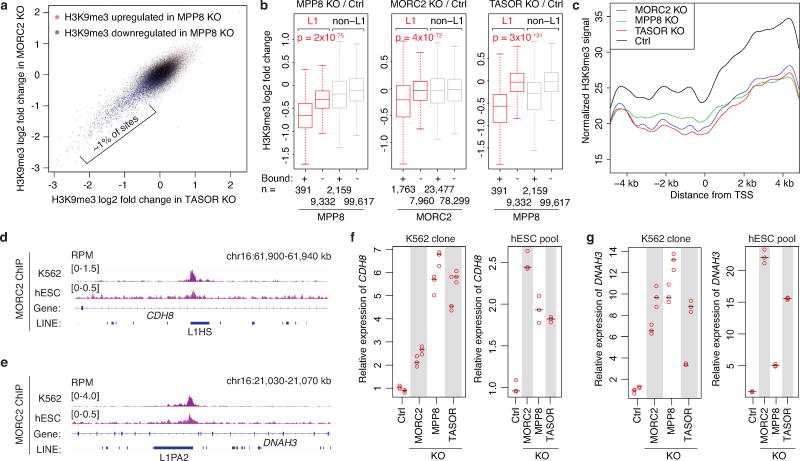
Extended Data Figure 9.
HUSH/MORC2 facilitate H3K9me3 at their L1 targets for transcription repression.
a. Concordant subset (~1%) of (n = 111,499) H3K9me3 sites in the genome lose H3K9me3 signal in MORC2 KO, MPP8 KO and TASOR KO K562 clones. Two independent lines each for WT, MORC2KO, TASOR KO, MPP8 KO. Plotted is log2 fold change in H3K9me3 ChIP signal in TASOR KO relative to Ctrl (x-axis) and log2 fold change in H3K9me3 ChIP signal in MORC2 KO relative to Ctrl (y-axis). Points are color coded with blue sites having significant H3K9me3 loss in MPP8 KO, red sites significantly gaining the signal in MPP8 KO, while gray have no detectable change. Sites that significantly lose H3K9me3 signal in KO line are more likely to have corresponding loss in other KO lines. Odds ratios: 26.23 with 95% confidence intervals (CI) [23,66, 29.10] for MORC2 versus MPP8; 21.70 with 95% CI [19.75, 23.83] for TASOR versus MPP8; 122.53 with 95% CI [109.21, 137.43] for TASOR versus MORC2. P = 0 each case, two-sided Fisher’s exact test.
b. Genomic sites that exhibit the strongest loss of H3K9me3 in MORC2, MPP8 or TASOR KOs are preferentially L1 occupied by these factors. Boxplots of log2 fold change in H3K9me3 relative to Ctrl for MPP8 KO (left), MORC2 KO (center) and TASOR KO (right). Box plots show median and interquartile range (IQR), whiskers are 1.5× IQR. MPP8 and MORC2 bound L1s show significant loss of H3K9me3 (p-values, two-sided Mann-Whitney-Wilcoxon test).
c. Averaged distribution of H3K9me3 ChIP-seq signals in Ctrl and KO K562 clones over the host genes that contain the MORC2-targeted intronic full-length L1s, centered on the transcription start site (TSS) of the host genes.
d. Genome browser showing MORC2 binding at the intronic full-length L1Hs within CDH8 in both K562 and hESCs. Experiment was repeated once with similar results.
e. Genome browser showing MORC2 binding at the intronic full-length L1PA2 within DNAH3 in both K562 and hESCs. Experiment was repeated once with similar results.
f. Depletion of MORC2/HUSH increases the expression of CDH8 in both K562 (n = 2 biological replicates × 3 technical replicates) and hESCs (n = 3 technical replicates), as measured by RT-qPCR assay. The CDH8 expression level was normalized to beta-actin mRNA. All samples were then normalized to Ctrl sample. Center value as median.
g. Depletion of MORC2/HUSH increases the expression of DNAH3 in both K562 (n = 2 biological replicates × 3 technical replicates) and hESCs (n = 3 technical replicates), as measured by RT-qPCR assay. The DNAH3 expression level was normalized to beta-actin mRNA. All samples were then normalized to Ctrl sample. Center value as median.
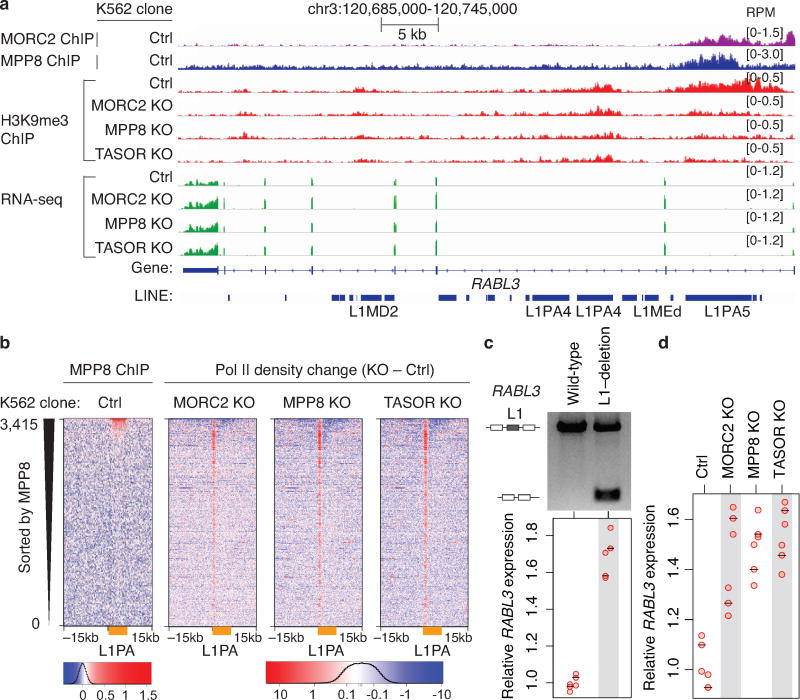
Extended Data Figure 10.
HUSH/MORC2 binding at intronic L1s results in the decreased expression of active host genes.
a. Genome browser tracks illustrating loss of HUSH/MORC2 causing decreased H3K9me3 over the intronic L1PA5 element and concomitant increase in the expression of host gene RABL3. Experiment was repeated once with similar results.
b. Loss of HUSH/MORC2 leads to increased Pol II signals at 5’UTR and decreased Pol II signals within L1 bodies at HUSH-bound L1PA elements (orange bars). Heatmaps show Pol II density change in KO K562 clones compared to Ctrl, centered on the L1 5’ end and sorted by MPP8 ChIP signal.
c. Deletion of the intronic L1 within RABL3 causes increased RABL3 expression. Upper panel: an agarose gel analysis of the PCR assay with primers flanking the HUSH/MORC2-bound intronic L1; two experiments repeated independently with similar results. Lower panel: RT-qPCR analysis of RABL3 expression. The RABL3 expression level was normalized to beta-actin mRNA. All samples were then normalized to wild-type sample. n = 2 biological replicates × 3 technical replicates (center value as median).
d. Depletion of MORC2, MPP8, TASOR increases RABL3 expression. RT-qPCR data normalized as in panel c). n = 2 biological replicates × 3 technical replicates (center value as median).
Supplementary Material
Acknowledgments
We thank J. Moran for the LRE-GFP plasmid and Astrid Engel for the codon-optimized L1 construct. We thank D. Fuentes, A. Spencley, R. Srinivasan, J. Mohammed, V. Bajpai, K. Tsui, G. Hess, D. Morgens, G. Cornelis for assistance and discussions. We thank K. Cimprich, A. Fire, A. Urban for comments on the manuscript. This work was funded by Jane Coffin Childs Memorial Fund for Medical Research (N.L.), NSF DGE-114747 (C.H.L.), NIH R01HG008150 (M.C.B.), NIH 1DP2HD084069-01 (M.C.B.), NIH R01 GM112720 and Howard Hughes Medical Institute grants (J.W.).
Footnotes
ACCESSION NUMBERS
The accession number of all sequencing samples reported is GEO: GSE95374.
SUPPLEMENTAL INFORMATION is available in the online version of the paper.
CONTRIBUTIONS
N.L., C.L., T.S., J.W., M.B. designed and performed experiments, analyzed data and wrote the manuscript. E.G., C.L., J.W., M.B. initiated the K562 genome-wide screen. B.G. analyzed smFISH data. J.W., M.B. supervised the entire work.
The authors declare no competing financial interests.
References
- 1.Lander ES, et al. Initial sequencing and analysis of the human genome. Nature. 2001;409:860–921. doi: 10.1038/35057062. [DOI] [PubMed] [Google Scholar]
- 2.Levin HL, Moran JV. Dynamic interactions between transposable elements and their hosts. Nat Rev Genet. 2011;12:615–627. doi: 10.1038/nrg3030. [DOI] [PMC free article] [PubMed] [Google Scholar]
- 3.Beck CR, Garcia-Perez JL, Badge RM, Moran JV. LINE-1 Elements in Structural Variation and Disease. Annu Rev Genomics Hum Genet. 2011;12:187–215. doi: 10.1146/annurev-genom-082509-141802. [DOI] [PMC free article] [PubMed] [Google Scholar]
- 4.Mita P, Boeke JD. How retrotransposons shape genome regulation. Curr Opin Genet Dev. 2016;37:90–100. doi: 10.1016/j.gde.2016.01.001. [DOI] [PMC free article] [PubMed] [Google Scholar]
- 5.Goodier JL. Restricting retrotransposons: a review. Mob DNA. 2016;7:16. doi: 10.1186/s13100-016-0070-z. [DOI] [PMC free article] [PubMed] [Google Scholar]
- 6.Chuong EB, Elde NC, Feschotte C. Regulatory activities of transposable elements: from conflicts to benefits. Nat Rev Genet. 2017;18:71–86. doi: 10.1038/nrg.2016.139. [DOI] [PMC free article] [PubMed] [Google Scholar]
- 7.Philippe C, et al. Activation of individual L1 retrotransposon instances is restricted to cell-type dependent permissive loci. eLife. 2016;5:e13926. doi: 10.7554/eLife.13926. [DOI] [PMC free article] [PubMed] [Google Scholar]
- 8.Tchasovnikarova IA, et al. Epigenetic silencing by the HUSH complex mediates position-effect variegation in human cells. Science. 2015;348:1481–1485. doi: 10.1126/science.aaa7227. [DOI] [PMC free article] [PubMed] [Google Scholar]
- 9.Moran JV, et al. High Frequency Retrotransposition in Cultured Mammalian Cells. Cell. 1996;87:917–927. doi: 10.1016/s0092-8674(00)81998-4. [DOI] [PubMed] [Google Scholar]
- 10.Morgens DW, et al. Genome-scale measurement of off-target activity using Cas9 toxicity in high-throughput screens. Nat Commun. 2017;8:15178. doi: 10.1038/ncomms15178. [DOI] [PMC free article] [PubMed] [Google Scholar]
- 11.Morgens DW, Deans RM, Li A, Bassik MC. Systematic comparison of CRISPR-Cas9 and RNAi screens for essential genes. Nat Biotechnol. 2016;34:634–636. doi: 10.1038/nbt.3567. [DOI] [PMC free article] [PubMed] [Google Scholar]
- 12.Suzuki J, et al. Genetic Evidence That the Non-Homologous End-Joining Repair Pathway Is Involved in LINE Retrotransposition. PLoS Genet. 2009;5 doi: 10.1371/journal.pgen.1000461. [DOI] [PMC free article] [PubMed] [Google Scholar]
- 13.Chance PF, et al. Linkage of the gene for an autosomal dominant form of juvenile amyotrophic lateral sclerosis to chromosome 9q34. Am J Hum Genet. 1998;62:633–640. doi: 10.1086/301769. [DOI] [PMC free article] [PubMed] [Google Scholar]
- 14.Németh AH, et al. Autosomal Recessive Cerebellar Ataxia with Oculomotor Apraxia (Ataxia-Telangiectasia–Like Syndrome) Is Linked to Chromosome 9q34. Am J Hum Genet. 2000;67:1320–1326. doi: 10.1016/s0002-9297(07)62962-0. [DOI] [PMC free article] [PubMed] [Google Scholar]
- 15.Albulym OM, et al. MORC2 mutations cause axonal Charcot–Marie–Tooth disease with pyramidal signs. Ann Neurol. 2016;79:419–427. doi: 10.1002/ana.24575. [DOI] [PMC free article] [PubMed] [Google Scholar]
- 16.Schottmann G, Wagner C, Seifert F, Stenzel W, Schuelke M. MORC2 mutation causes severe spinal muscular atrophy-phenotype, cerebellar atrophy, and diaphragmatic paralysis. Brain. 2016;139:e70–e70. doi: 10.1093/brain/aww252. [DOI] [PubMed] [Google Scholar]
- 17.Brégnard C, et al. Upregulated LINE-1 Activity in the Fanconi Anemia Cancer Susceptibility Syndrome Leads to Spontaneous Pro-inflammatory Cytokine Production. EBioMedicine. 2016;8:184–194. doi: 10.1016/j.ebiom.2016.05.005. [DOI] [PMC free article] [PubMed] [Google Scholar]
- 18.Ostertag EM, Luning Prak ET, DeBerardinis RJ, Moran JV, Kazazian HH. Determination of L1 retrotransposition kinetics in cultured cells. Nucleic Acids Res. 2000;28:1418–1423. doi: 10.1093/nar/28.6.1418. [DOI] [PMC free article] [PubMed] [Google Scholar]
- 19.Han JS, Boeke JD. A highly active synthetic mammalian retrotransposon. Nature. 2004;429:314–318. doi: 10.1038/nature02535. [DOI] [PubMed] [Google Scholar]
- 20.Wagstaff BJ, Barnerβoi M, Roy-Engel AM. Evolutionary Conservation of the Functional Modularity of Primate and Murine LINE-1 Elements. PLOS ONE. 2011;6:e19672. doi: 10.1371/journal.pone.0019672. [DOI] [PMC free article] [PubMed] [Google Scholar]
- 21.Tchasovnikarova IA, et al. Hyperactivation of HUSH complex function by Charcot-Marie-Tooth disease mutation in MORC2. Nat Genet. 2017;49:1035–1044. doi: 10.1038/ng.3878. [DOI] [PMC free article] [PubMed] [Google Scholar]
- 22.Moissiard G, et al. MORC Family ATPases Required for Heterochromatin Condensation and Gene Silencing. Science. 2012;336:1448–1451. doi: 10.1126/science.1221472. [DOI] [PMC free article] [PubMed] [Google Scholar]
- 23.Pastor WA, et al. MORC1 represses transposable elements in the mouse male germline. Nat Commun. 2014;5:5795. doi: 10.1038/ncomms6795. [DOI] [PMC free article] [PubMed] [Google Scholar]
- 24.Garcia-Perez JL, et al. LINE-1 retrotransposition in human embryonic stem cells. Hum Mol Genet. 2007;16:1569–1577. doi: 10.1093/hmg/ddm105. [DOI] [PubMed] [Google Scholar]
- 25.Han JS, Szak ST, Boeke JD. Transcriptional disruption by the L1 retrotransposon and implications for mammalian transcriptomes. Nature. 2004;429:268–274. doi: 10.1038/nature02536. [DOI] [PubMed] [Google Scholar]
- 26.Saint-André V, Batsché E, Rachez C, Muchardt C. Histone H3 lysine 9 trimethylation and HP1γ favor inclusion of alternative exons. Nat Struct Mol Biol. 2011;18:337–344. doi: 10.1038/nsmb.1995. [DOI] [PubMed] [Google Scholar]
- 27.Khan H, Smit A, Boissinot S. Molecular evolution and tempo of amplification of human LINE-1 retrotransposons since the origin of primates. Genome Res. 2006;16:78–87. doi: 10.1101/gr.4001406. [DOI] [PMC free article] [PubMed] [Google Scholar]
- 28.Buecker C, et al. Reorganization of Enhancer Patterns in Transition from Naive to Primed Pluripotency. Cell Stem Cell. 2014;14:838–853. doi: 10.1016/j.stem.2014.04.003. [DOI] [PMC free article] [PubMed] [Google Scholar]
- 29.Taylor MS, et al. Affinity proteomics reveals human host factors implicated in discrete stages of LINE-1 retrotransposition. Cell. 2013;155:1034–1048. doi: 10.1016/j.cell.2013.10.021. [DOI] [PMC free article] [PubMed] [Google Scholar]
- 30.Brouha B, et al. Evidence Consistent with Human L1 Retrotransposition in Maternal Meiosis I. Am J Hum Genet. 2002;71:327–336. doi: 10.1086/341722. [DOI] [PMC free article] [PubMed] [Google Scholar]
- 31.Gasior SL, Roy-Engel AM, Deininger PL. ERCC1/XPF limits L1 retrotransposition. DNA Repair. 2008;7:983–989. doi: 10.1016/j.dnarep.2008.02.006. [DOI] [PMC free article] [PubMed] [Google Scholar]
- 32.Deans RM, et al. Parallel shRNA and CRISPR-Cas9 screens enable antiviral drug target identification. Nat Chem Biol. 2016;12:361–366. doi: 10.1038/nchembio.2050. [DOI] [PMC free article] [PubMed] [Google Scholar]
- 33.Bassik MC, et al. A Systematic Mammalian Genetic Interaction Map Reveals Pathways Underlying Ricin Susceptibility. Cell. 2013;152:909–922. doi: 10.1016/j.cell.2013.01.030. [DOI] [PMC free article] [PubMed] [Google Scholar]
- 34.Cong L, et al. Multiplex Genome Engineering Using CRISPR/Cas Systems. Science. 2013;339:819–823. doi: 10.1126/science.1231143. [DOI] [PMC free article] [PubMed] [Google Scholar]
- 35.Coufal NG, et al. L1 Retrotransposition in Human Neural Progenitor Cells. Nature. 2009;460:1127–1131. doi: 10.1038/nature08248. [DOI] [PMC free article] [PubMed] [Google Scholar]
- 36.Shukla R, et al. Endogenous Retrotransposition Activates Oncogenic Pathways in Hepatocellular Carcinoma. Cell. 2013;153:101–111. doi: 10.1016/j.cell.2013.02.032. [DOI] [PMC free article] [PubMed] [Google Scholar]
- 37.Carreira PE, et al. Evidence for L1-associated DNA rearrangements and negligible L1 retrotransposition in glioblastoma multiforme. Mob DNA. 2016;7 doi: 10.1186/s13100-016-0076-6. [DOI] [PMC free article] [PubMed] [Google Scholar]
- 38.Doucet AJ, Wilusz JE, Miyoshi T, Liu Y, Moran JV. A 3′ Poly(A) Tract Is Required for LINE-1 Retrotransposition. Mol Cell. 2015;60:728–741. doi: 10.1016/j.molcel.2015.10.012. [DOI] [PMC free article] [PubMed] [Google Scholar]
- 39.Otsu N. A Threshold Selection Method from Gray-Level Histograms. IEEE Trans Syst Man Cybern. 1979;9:62–66. [Google Scholar]
- 40.Love M, Huber W, Anders S. Moderated estimation of fold change and dispersion for RNA-seq data with DESeq2. Genome Biol. 2014;15:550. doi: 10.1186/s13059-014-0550-8. [DOI] [PMC free article] [PubMed] [Google Scholar]
- 41.Bajpai R, et al. CHD7 cooperates with PBAF to control multipotent neural crest formation. Nature. 2010;463:958–962. doi: 10.1038/nature08733. [DOI] [PMC free article] [PubMed] [Google Scholar]
- 42.Rada-Iglesias A, et al. A unique chromatin signature uncovers early developmental enhancers in humans. Nature. 2011;470:279–283. doi: 10.1038/nature09692. [DOI] [PMC free article] [PubMed] [Google Scholar]
Associated Data
This section collects any data citations, data availability statements, or supplementary materials included in this article.
Supplementary Materials
Data Availability Statement
All sequencing data generated in this work has been deposited at GEO under the accession number: GSE95374. H3K4me3 and H3K27ac K562 ChIP-seq datasets in Fig. 3e are from BioProject (accession number PRJEB8620). hESC RNA-seq datasets in Extended Data Fig. 8c are from SRA run entries SRR2043329 and SRR2043330. The complete results of genome-wide screens in K562 and HeLa cells are in Table S1; The complete results of secondary screens in K562 and HeLa cells are in Table S2. The sequences of gRNAs and oligonucleotides used in this work are in Table S3 and Table S4. The uncropped scans with size marker indications are summarized in the Supplementary Figure. All data are available from the corresponding author upon reasonable request.


