Abstract
Purpose
To detect local cholinergic changes in human medial temporal lobe, during configural working memory performance.
Materials and Methods
Proton magnetic resonance spectroscopy (1H-MRS) measurements were acquired at 3T from a 2×2×3 cm voxel in right medial temporal lobe from 36 subjects during performance of a configural visual working memory task (cWMT). In order to compensate for expected task-based BOLD T2* effects, resonance signal changes of unbound choline-containing metabolites (Cho) were referenced to an internal standard of creatine + phosphocreatine metabolites (Cre) and compared between four task blocks: rest, memorization, active memory maintenance, and recognition. An unannounced memory retention test was conducted in 21 subjects. Quality assurance analyses examined task-based Cho and Cre individually as well as referenced to resonance signal from N-acetylaspartate (NAA).
Results
Increases from a resting baseline in the Cho/Cre ratio were observed during 60-second blocks of active memory maintenance across the group (p = .0042). Behavioral accuracy during task performance correlated with memory retention (r = .48, p = .027). Quality assurance measures showed task-based changes in Cre resonance signal both individually (p = .00099) and when utilized as a non-cholinergic internal reference (NAA/Cre, p = .00079).
Conclusions
Increases in human MTL 1H-MRS Cho/Cre ratio occur during the maintenance of configural working memory information. However, interpretation of these results as driven by cholinergic activity cannot be assumed, as NAA, a non-cholinergic metabolite, shows similar results when utilizing Cre as a reference. Caution is advised when considering Cre as an internal standard for task-based 1H -MRS measurements.
Keywords: Magnetic Resonance Spectroscopy, Creatine, Choline, Acetylcholine, Working Memory, Medial Temporal Lobe
INTRODUCTION
Working memory, classically defined as the memory system responsible for the temporary maintenance and manipulation of conscious information during a cognitive task (1, 2), relies on medial temporal lobe (MTL) when processing novel relationships or configurations (3). A principal mechanistic proposal from this research is that cholinergic neurotransmission tunes MTL network dynamics for active maintenance during working memory (4). Direct measurements in the MTL of rats show increases of acetylcholine (ACh) during working memory tasks (5) that rise with task performance (6) as well as task difficulty (10).
Though replicating invasive measurements is not feasible in human subjects, systemic pharmacological interventions have evidenced a similar role for MTL cholinergic control in working memory tasks with novel or configural stimuli. Systemic scopolamine administration causes deficits in task performance (8) and decreases blood oxygen level-dependent (BOLD) fMRI signal in MTL during active maintenance of task information (9); importantly, this MTL activity during active maintenance has been correlated with subsequent performance on post-learning memory retention tests (10), supporting hypotheses that local acetylcholine mediates encoding for longer-term memory storage (9).
Functional magnetic resonance spectroscopy (fMRS), which collects measurements time-locked to the performance of behavioral tasks, has most commonly been used to measure metabolic changes in lactate production (11), GABAergic neurotransmission (12), and more recently, glutamatergic neurotransmission (13). During a target detection task of emotional face stimuli, Nishitani (14) showed increases in human MTL choline-containing compound resonance signal (Cho) that paralleled an increase in MTL theta activity measured by magnetoencephalography. However, task-based changes in observed 1H -MRS signal do not necessarily indicate changes in the underlying concentration of contributing metabolites, especially because neural activation also drives task-based changes in metabolite T2* relaxation due to BOLD-related local field changes. In order to account for task-related BOLD signal changes, the current study considers a ratio of Cho to resonance signal from creatine and phosphocreatine (Cre). Estimations of Cre are commonly used as an internal reference in MR spectroscopy, as creatine and phosphocreatine are expected to remain at constant concentrations due to a slow and steady conversion to creatinine (not resolvable by 1H-MRS), remain soluble, and not interact with other molecules via bonds strong enough to disrupt their contribution to the resonance peak. Unlike creatine, choline-derived metabolites do bind other molecules with strengths sufficient to eliminate contributions to the Cho resonance detected by 1H-MRS. Phosphotidylcholine, the choline-derived metabolite with the highest concentration in brain, does not contribute to the observed resonance due to its involvement in the non-soluble cell membrane (15). Free choline and acetylcholine, when stored in intracellular vesicles, also interact at near-covalent strengths to the phosphate groups of cell membranes (16, 17), and cholinergic activity accounts for an estimated 30-50% of extracellular free choline and acetylcholine (18). By using an internal reference and evaluating metabolite-to-Cre concentration ratios rather than estimations of absolute metabolite concentrations, comparisons between spectra collected at different points in time can be made more accurate as well as robust to line broadening and reduced signal-to-noise; the improved accuracy is due to correlational changes in model fitting in the presence of collection-related changes such as magnetic field drift, inhomogeneity, and T2 fluctuations (19).
Based on animal and human evidence associating increased cholinergic activity with relational working memory, as well as previous data presented by our lab (20), we hypothesized that we would observe an increase in the Cho/Cre ratio during active maintenance on a configural working memory task (cWMT).
METHODS
Subjects
Thirty-six volunteer subjects were recruited via advertisements posted on a university campus or using an online research volunteer program. Four volunteers received course credit through the university Department of Psychology; the remaining subjects volunteered with no compensation. All subjects self-reported as right-handed, having normal or corrected-to-normal vision with no deficiency in color perception, no history of psychiatric or neurological disorders, no use of nicotine, and no use of psychoactive medications. Subjects were screened before scanning to ensure compatibility with an MR environment; as such, subjects were not claustrophobic, not pregnant, and were able to remove all preclusive metallic or magnetic devices. All research was conducted in compliance with a study protocol approved by the university Institutional Review Board.
After providing written informed consent, each subject completed a standardized cWMT training module on a computer in a private office and reported feeling comfortable with task instructions. The deck of cards used during training was not one of the four decks presented during fMRS data collection (see Stimuli section below).
Behavioral Data Collection
Configural Working Memory Task
Each run of the cWMT consisted of three consecutive one-minute blocks: a memorization block, an active maintenance block, and a test block (Fig. 1). In the scanner, the subject held a thumb-button response box in each hand — one hand designated as the new button and the other designated as the old button, the sides of which were counterbalanced across subjects. Each cWMT run was immediately preceded and followed by a one-minute rest block during which subjects were instructed to fixate on a centrally located fixation cross, below which appeared the word “REST”, while letting their mind wander.
Figure 1.
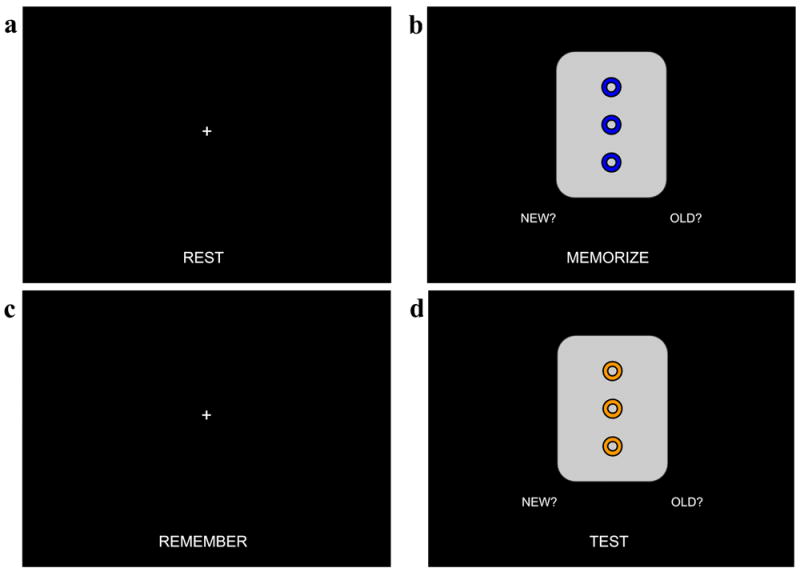
Configural working memory task (cWMT) procedure. Each subject performed the cWMT four times in the MRI scanner. Each task block lasted one minute. A rest block (a) was conducted immediately before and after each run of the three task blocks, during which subjects were instructed to keep their eyes fixed on the cross and let their minds rest. During the memorization block (b), subjects were shown four cards for four seconds each with one second between card presentations; these four cards were then repeated twice more, for twelve total presentations. Subjects pressed the button box in their hand corresponding to the “NEW” icon to indicate that it was the first time observing this card, or pressed the button in their other hand corresponding to the “OLD” icon to indicate that the card had been shown before. During the remember block (c), subjects were instructed to fix their eyes on the cross and keep the previously memorized cards in their mind. During the test block (d), subjects were shown twelve different cards, four of which were the previously memorized cards. Similar to the memorize block, subjects indicated via button press if the card had been shown previously.
During the memorization block, subjects were shown four serially presented cards, each card presented for four seconds, interspersed by one second of blank screen. Beneath each card, the word “OLD” appeared on the side corresponding to the subject’s response box for the old button, and the word “NEW” appeared on the side corresponding to the subject’s response box for the new button. The series of four cards was presented three times in identical order, for twelve total card presentations. The subject was instructed to memorize the cards and to press the new button if the card had not previously been shown, or press the old button if it had been shown; thus, the correct answers for the memorization block were always four new responses followed by eight old responses.
During the active maintenance block, subjects were shown a centrally located fixation cross, below which appeared the word “REMEMBER”, and instructed to keep their eyes on the cross while keeping in mind the four cards presented to them during the memorization block.
During the test block, subjects were shown twelve separate cards with timing, appearance, and instructions similar to the memorization block; however, eight of the cards were foils that had not been presented for memorization, and the remaining four were the cards presented during the memorization block. Presentation of the four memorized cards was pseudorandomly ordered such that one appeared within the span of each three cards presented.
Importantly, the visual and response components of the cWMT are identical between the memorization and test blocks, as well as between the remember and rest blocks; as such, comparisons between these matched blocks remove confounds for perceptual and motor representations.
In order to avoid memory interference between runs, four novel decks of cards — each with distinct colors and shapes — were presented across the four cWMT runs. The order of deck presentation was counterbalanced across subjects. Each deck of cWMT cards comprised 16 cards, including all possible combinations between four binary stimulus dimensions: shape, color, number, and orientation. For example, each card from the deck used during task training (Fig. 2) presented either one or two (number) blue or orange (color) X’s or O’s (shape) aligned vertically or horizontally (orientation). Before each run, four of the 16 cards were pseudorandomly selected for presentation during the remember block, ensuring that no pair of the selected cards matched across more than two stimulus dimensions. As such, each of the foils presented in the test block necessarily matched at least two of the remembered cards in more than one stimulus dimension, and task performance relied on the subject remembering the configural relationships between stimulus attributes. All stimulus presentation scripts were written in MATLAB (Mathworks, Natick, MA) using the Psychophysics Toolbox extension (21, 22). To enhance shape contrast, stimuli items were outlined in black and presented on grey cards; all screen backgrounds were black, and all text was white.
Figure 2.
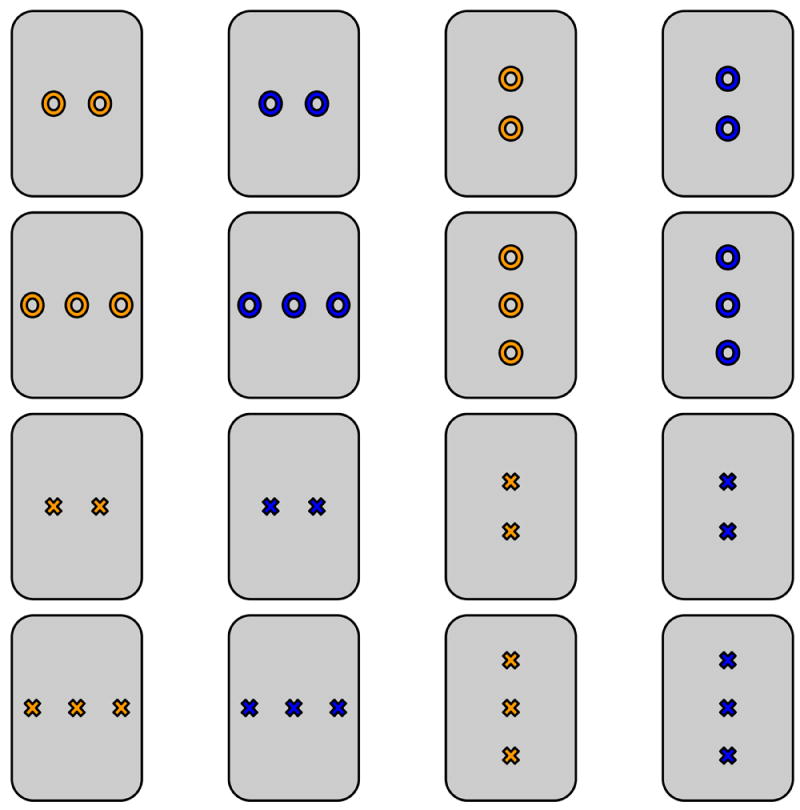
Example cWMT card deck. Five cards decks, one for task training and one for each of the four runs performed by each subject, were constructed based on the same principle. Each deck consisted of sixteen cards representing all combinations across four stimulus dimensions: number (two or three), color (e.g., orange or blue), shape (e.g., X or O), and orientation (horizontal or vertical). Each deck of cards used unique colors and shapes.
Memory Retention Test
Beginning 5-10 minutes after scanning, 21 of the 31 subjects performed a post-learning test to evaluate memory retention on a computer outside the scanner. Subjects were not made aware that a retention test would take place. The instructions and screen display were identical to the test block of the cWMT task, except that each card was presented on the screen for an unlimited duration and advanced only after the subject made a new or old decision. The sixteen cards that had been presented to the subject across four cWMT memorization blocks were randomly shuffled with the sixteen unseen foils, four from each of the decks; thus, each card in the memory retention test was either one that had been memorized during scanning or one that had never been presented to the subject.
MR Data Collection
Scanning utilized a 3-Tesla Siemens Magnetom Tim Trio whole-body scanner (Erlangen, Germany) and a manufacturer supplied 12-channel phased array head coil. Following a high resolution structural scan (T1-weighted magnetization prepared rapid acquisition gradient echo; TR/TE = 1900/2.52ms, flip angle = 9°, 160 1mm sagittal slices, FoV = 256×160×256mm, 1mm3 resolution) used for subsequent MRS voxel positioning, each subject performed four cWMT runs while undergoing fMRS scanning (point resolved spectroscopy sequence; TR/TE= 2000/30ms, flip angle = 90°, VOI = 30×20×20mm, bandwidth = 1800Hz, water suppression bandwidth = 60Hz, acquisition duration = 284ms, timepoints = 512; 10 averages for unsuppressed collections, 30 averages for water suppressed collections). Unsuppressed spectra used for water referencing and eddy current correction were collected before cWMT run 1, after run 2, before run 3, and after run 4. Based on the methods used in Nishitani (14), the rectangular MRS voxel was manually positioned along the hippocampal fissure — guided by the high resolution structural scan — to cover a maximal amount of medial temporal lobe grey matter while avoiding the enlarged portion of the temporal horn of the lateral ventricle (Fig. 3). Thus, the voxel included portions of hippocampus as well as entorhinal, perirhinal, and parahippocampal cortices. Head movement was minimized by padding the space between the subjects’ protective headphones and the scanning coil. Following automatic shims of the B0 magnetic field within the voxel location, additional linear shims were manually optimized prior to MRS scanning.
Figure 3.
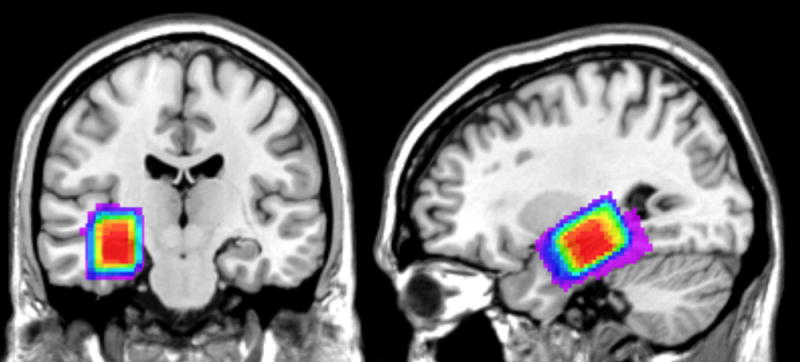
Voxel position. The 2×2×3 cm MRS voxel was manually positioned along the right hippocampal fissure of each subject just anterior to the temporal horn enlargement of the lateral ventricle. Color coding on a normalized anatomical template shows the overlaid voxel positioning for each subject: red areas were included in at least 27 subjects, and purple areas were included in fewer than five subjects.
MR Data Analysis
Quantitation of metabolites contributing to the observed 1H-MRS spectra was estimated using LCModel software, version 6.3 (Provencher Inc., Oakville, Canada; 23). LCModel fits a linear combination of canonical metabolite peaks from an empirical scanner-specific basis set to estimate concentrations and uncertainties contributing to observed data with a minimum of subjective input. Unsuppressed data from the VOI — collected with identical scan parameters except without a water suppression pulse — were used to estimate eddy current effects and improve baseline fit, line shape, and zero-order phase correction within the model.
Though a full basis set of 27 metabolites was used to fit the frequency domain data (as well as common spectral contributions from four lipids and five macromolecules to produce an informed background signal), main outcome measures were estimates of two metabolite concentrations: first, ammonium trimethyl contributions dominated by a peak at 3.20 ppm calculated from the combination of fitted peaks for glycerophosphocholine and phosphocholine ([Cho]); and second, methylamino contributions dominated by a peak at 3.03 ppm (and supported by a concurrent ethyl contribution at 3.91 ppm) calculated from the combination of fitted peaks for creatine and phosphocreatine ([Cre]). For each subject, estimates of these metabolite concentrations were used to determine the Cho/Cre signal ratio for each rest block and each task block across the four cWMT runs.
MR Data Quality Control
Inclusion Criteria
Each individual frequency domain spectrum from the acquired data was assessed for reliability based on the determined Cramér-Rao lower bounds (CRLB) of the metabolites of interest, as well as the linewidth (FWHM) and signal-to-noise ratio (SNR) of the largest representative metabolite peak, typically N-Acetylaspartate (NAA) at 2.01 ppm, to twice the root mean square of the residuals. The CRLB of the model fit represents the lowest possible standard deviation of all unbiased model parameter estimates obtained from the data and provide an evaluation for the precision of metabolite estimations (24). For each CRLB, FWHM, and SNR, Chauvenet’s criterion was used on the pooled set of all collected spectra in order to determine an unbiased cut-off for inclusion in final analyses (25); thus, the maximum CRLB for [Cho] was 17% (median = 8%), maximum CRLB for [Cre] was 16% (median = 8%), maximum FWHM was 17.6 Hz (median = 10.6 Hz), and minimum SNR was 4 (median = 9). Representative spectra are presented in Figure 4. Five subjects had at least one spectrum excluded from each of their four cWMT runs and were excluded from further analysis. Among the remaining 31 subjects (682 total spectra), 21 spectra were excluded due to failed quality control measures. Subsequent statistical analyses included data only from cWMT runs with unexcluded data from all task blocks and at least one of the adjacent rest blocks, resulting in 24 subjects retaining all 4 cWMT runs, 4 subjects retaining 3 cWMT runs, and 3 subjects retaining 2 cWMT runs.
Figure 4.
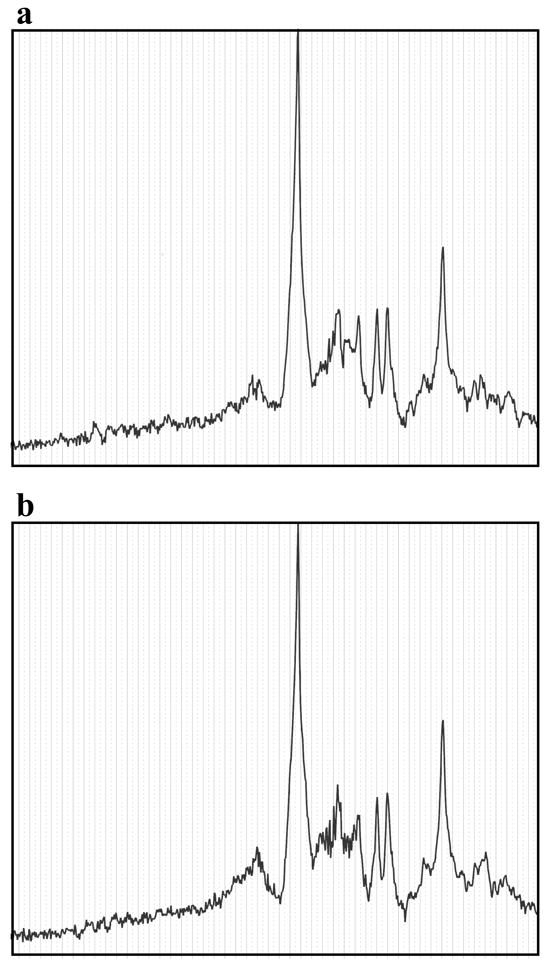
Representative 1H MRS spectra. Full window raw frequency domain spectra from 10 ppm on the left to 0.2 ppm on the right from Subject 1 for (a) rest and (b) remember task blocks. The largest peak near the center at approximately 4.7 ppm represents the residual water peak.
Determination of Outcome Measure
In order to confirm that model fitting of the collected data produced correlative trends across metabolites (i.e., that higher [Cho] estimations predicted higher [Cre] estimations within the same voxel across time), the Pearson’s correlation coefficient was determined between [Cho] and [Cre] across spectra within each subject, and a z-test was performed on the Fisher transformed z-scores across subjects; the significant groupwise correlation between estimations of [Cho] and [Cre] (mean r = 0.50, 95% CI = [0.19 0.73], df = 30, p = 0.0014) determined that metabolite ratios should be used as a more sensitive outcome measure than estimated absolute metabolite concentrations (19).
In order to confirm that poorer scan quality within a subject correlated with the variance of metabolite ratios between scans measured for that subject (i.e., that a subject with poorer overall scan quality showed greater changes in Cho/Cre within the same voxel across time), a Pearson’s correlation coefficient was determined across subjects for the estimated average within-spectra Cho/Cre variance (based on CRLB[Cho]2 + CRLB[Cre]2) and across-spectra Cho/Cre variance. The resulting significant correlation (r = 0.46, p = 0.0085) determined that metabolite ratios should be normalized within subjects in order to reduce the effect of quality-related variance increases; as such, metabolite ratios were z-scored within-subjects before groupwise comparisons of concentration changes across time. Thus, the main outcome of interest for task-related metabolite concentration changes was determined to be within-subject z-scored Cho/Cre.
Determination of Order Effects
One-way ANOVAs for each block type provided no concern for order effects of Cho/Cre measurements across runs: for rest blocks F = 0.25, df = 5, p = 0.94; for memorization blocks F = 0.23, df = 3, p = 0.87; for remember blocks F = 0.71, df = 3, p = 0.55; and for test blocks F = 0.59, df = 3, p = 0.63. In addition, paired t-test between pre- and post-task rest blocks (with subject as a random effect) revealed no significant difference in resting baseline Cho/Cre whether the measurement was taken before or after task completion (t = 0.18, df = 24, p = 0.85).
All reported statistical tests were two-tailed with a significance threshold of p < .05.
Quality Assurance Analyses
In order to characterize the individual contributions of [Cho] and [Cre] to the results of ratios between the two, follow-up analyses were performed on within-subject z-scored concentration estimates (z-Cho and z-Cre, respectively) as well as on respective ratios with estimated [NAA] (z-Cho/NAA and z-NAA/Cre). The NAA resonance signal, like the Cre resonance signal, is not theorized to undergo neurometabolic changes on a task-based time scale; if this is the case, results should be consistent for z-Cho/Cre and z-Cho/NAA, and no task differences should be observed for z-NAA/Cre.
RESULTS
Demographic Results
Of 36 recruited subjects (28 females, 8 males between 18.2 - 38.3 years; mean ± standard deviation 22.5 ± 4.9 years), 5 subjects failed scan quality control measures (see MR data quality control) resulting in data reported from 31 subjects (24 females, 7 males between 18.2 - 33.4 years; mean ± standard deviation 22.0 ± 4.0 years).
Behavioral Results
Accuracy on the cWMT (d’ = 3.71 ± 1.29, acc. = 92.6 ± 11.6%) showed that the subject group was able to perform the task at ceiling level on 68 of 124 runs. Six of the 31 subjects scored perfectly across all 4 cWMT runs. Of the 3 subjects that did not score any perfect runs, 2 answered only a single trial incorrectly on 3 of the 4 runs; the remaining subject also scored above chance levels (d’ = 1.54 ± 0.708, acc. = 69.5 ± 4.81%). Subject accuracy scores are reported in Table 1. Reaction times for correct answers (1.70 ± .353 sec) were significantly faster than RT for incorrect answers (2.09 ± 0.658 sec) based on a paired sample t-test among subjects with incorrect responses (t = 2.9, df = 52, p = .0049). Mean subject accuracy (d’) correlated inversely with mean subject reaction time (Pearson’s r = -0.56, p = 0.0010, 95% CI = [-.76 -.26]).
Table 1.
Subject data: task block Cho/Cre, task accuracy, and retention test accuracy.
| Subject | REST | MEMORIZE | REMEMBER | TEST | d’ | post-d’ |
|---|---|---|---|---|---|---|
| 1 | 0.29 | 0.282 | 0.296 | 0.297 | 2.47 | NC |
| 2 | 0.3 | 0.33 | 0.332 | 0.312 | 4.67 | NC |
| 3 | 0.31 | 0.297 | 0.32 | 0.306 | 4.36 | NC |
| 4 | 0.314 | 0.33 | 0.337 | 0.348 | 3.75 | NC |
| 5 | 0.306 | 0.328 | 0.32 | 0.278 | 2.64 | NC |
| 6 | 0.407 | 0.369 | 0.433 | 0.394 | 3.22 | NC |
| 7 | 0.285 | 0.257 | 0.317 | 0.261 | 2.27 | NC |
| 8 | 0.312 | 0.323 | 0.29 | 0.34 | 3.83 | NC |
| 9 | 0.314 | 0.287 | 0.3 | 0.267 | 3.16 | 0.971 |
| 10 | 0.349 | 0.342 | 0.351 | 0.329 | 4.25 | 1.34 |
| 11 | 0.257 | 0.263 | 0.241 | 0.256 | 4.67 | 2.99 |
| 12 | 0.324 | 0.335 | 0.309 | 0.315 | 4.25 | 1.18 |
| 13 | 0.234 | 0.262 | 0.287 | 0.268 | 4.36 | 0.971 |
| 14 | 0.301 | 0.322 | 0.324 | 0.304 | 3.94 | 0.154 |
| 15 | 0.231 | 0.21 | 0.258 | 0.267 | 2.52 | 0.505 |
| 16 | 0.334 | 0.333 | 0.331 | 0.333 | 3.94 | 0.813 |
| 17 | 0.26 | 0.264 | 0.254 | 0.279 | 3.94 | 0.659 |
| 18 | 0.325 | 0.317 | 0.326 | 0.343 | 4.06 | 0.312 |
| 19 | 0.29 | 0.295 | 0.323 | 0.289 | 4.67 | 1.16 |
| 20 | 0.338 | 0.36 | 0.327 | 0.37 | 3.53 | 1.59 |
| 21 | 0.279 | 0.271 | 0.297 | 0.309 | 4.67 | 1.43 |
| 22 | 0.315 | 0.305 | 0.33 | 0.35 | 3.94 | 0.478 |
| 23 | 0.346 | 0.359 | 0.366 | 0.364 | 3.83 | 0.386 |
| 24 | 0.279 | 0.309 | 0.297 | 0.282 | 3.25 | 0.957 |
| 25 | 0.366 | 0.39 | 0.382 | 0.39 | 2.52 | NC |
| 26 | 0.315 | 0.324 | 0.361 | 0.319 | 3.36 | 1.34 |
| 27 | 0.333 | 0.307 | 0.328 | 0.335 | 3.45 | 1.43 |
| 28 | 0.364 | 0.343 | 0.406 | 0.346 | 4.67 | NC |
| 29 | 0.274 | 0.261 | 0.264 | 0.294 | 3.36 | -0.505 |
| 30 | 0.281 | 0.32 | 0.322 | 0.311 | 0.991 | 0 |
| 31 | 0.302 | 0.318 | 0.326 | 0.307 | 4.67 | 1.34 |
Accuracy on the memory retention test (group: d’ = 0.93 ± 0.72, acc. = 78.0 ± 12.8%) showed that 20 of 21 subjects performed significantly better than chance based on binomial tests (cutoff at 20 out of 32 correct for p < .05); the remaining subject scored 13 out of 32 correct. Memory retention test reaction times for correct answers (3.30 ± 1.28 sec) were not significantly different from incorrect answers (3.33 ± 1.17 sec). There was no significant correlation between retention test accuracy and reaction time (r = -0.19, p = 0.42, 95% CI = [-.57 .27]).
Correlations between the cWMT and memory retention tests were significant for both subject d’ (r = .48, p = .027, 95% CI [0.063 0.76]) and subject reaction time (r = .44, p = .049, 95% CI = [.0042 .73]) based on z-tests of Fisher-transformed Pearson’s correlation coefficients (Fig. 5).
Figure 5.
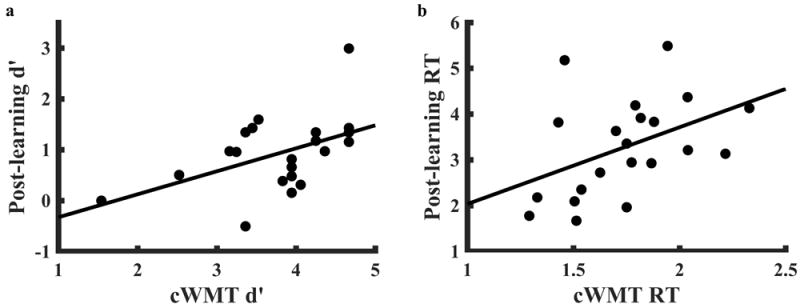
In-scanner task performance correlates with memory retention test performance. After performing four runs of the in-scanner configural working memory task (cWMT), 21 subjects performed an unexpected recognition test on 32 items: the 16 memorized cards (four from each cWMT run) and 16 previously unseen foils (four from each of the card decks). Both accuracy (a) and reaction time (b) correlated between tests. d’: d-prime accuracy score, RT: reaction time, in seconds.
MR Data Results
The mean and standard deviation of Cho/Cre values across within-subject averages was 0.31 ± 0.036. Subject Cho/Cre measurements are reported in Table 1. To identify task-related changes in metabolite measurements, modeled concentrations of each metabolite, as well as the Cho/Cre ratio, were z-scored within each subject across all blocks that passed quality control (see Determination of Outcome Measure section above); subsequent analyses refer to these measurements as z-Cho/Cre. Group averages for Cho/Cre and z-Cho/Cre are reported in Table 2.
Table 2.
Group averages and standard deviations for MRS measures.
| REST | MEMORIZE | REMEMBER | TEST | |
|---|---|---|---|---|
| z-Cho/Cre | -0.17 ± 0.30 | -0.055 ± 0.44 | 0.25 ± 0.49 | 0.083 ± 0.48 |
| Cho/Cre | 0.31 ± 0.038 | 0.31 ± 0.039 | 0.32 ± 0.041 | 0.31 ± 0.037 |
| z-Cho | 0.038 ± 0.34 | -0.086 ± 0.50 | 0.047 ± 0.46 | -0.02 ± 0.49 |
| z-Cre | 0.21 ± 0.43 | -0.051 ± 0.39 | -0.23 ± 0.44 | -0.071 ± 0.49 |
| z-Cho/NAA | -0.012 ± 0.24 | -0.0067 ± 0.45 | 0.11 ± 0.41 | -0.067 ± 0.37 |
| z-NAA/Cre | -0.16 ± 0.36 | -0.11 ± 0.39 | 0.15 ± 0.40 | 0.20 ± 0.40 |
Increases in Cho/Cre During Remember Blocks
A one-way repeated measures ANOVA showed a significant effect of block type (rest, memorization, remember, test) on z-Cho/Cre (F(3, 503) = 4.46, p = .0042). A post-hoc Tukey HSD test revealed one significant difference between block types: remember blocks >rest blocks (p = .0025, 95% CI = [0.11, 0.71]) (Fig. 6a). A similar ANOVA using the raw Cho/Cre values showed a similar effect (F(3, 503) = 3.81, p = .01, Tukey HSD p = .0068, 95% CI = [0.0027, 0.024]) (Fig. 6b).
Figure 6.
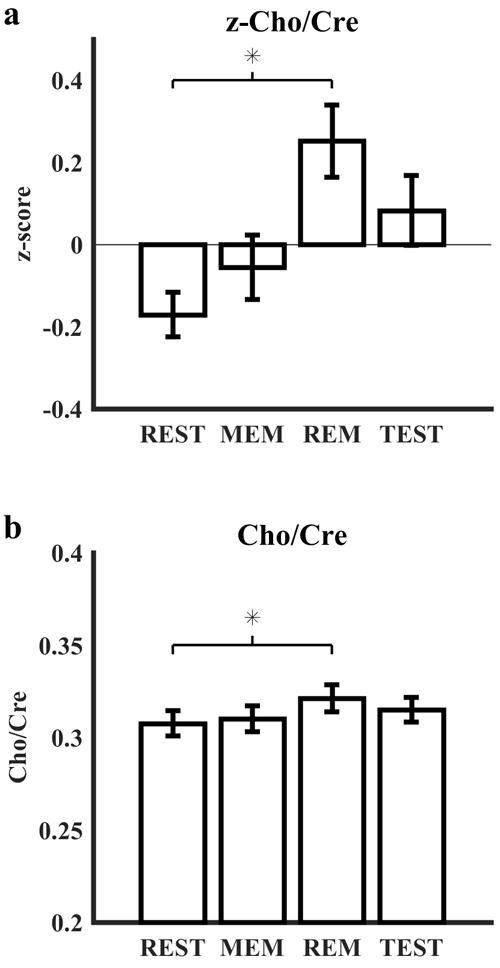
MRS measurements of main outcome measure by task block. (a) Estimation of the Cho/Cre ratio was z-scored within each of the 31 subjects and averaged across the group for each block type of the configural working memory task. The z-Cho/Cre ratio showed a significant increase while subjects performed the remember blocks compared to the rest blocks. (b) Non-normalized Cho/Cre ratio results are presented to show the scale of effect size. Error bars represent standard error from the mean. REST: rest blocks, MEM: memorization blocks, REM: remember blocks, TEST: test blocks.
No Observed Correlations Between Behavioral and fMRS Results
To test for correlations between cWMT behavioral measures and within-subject changes in metabolite concentrations, z-Cho/Cre increases above resting baseline for remember blocks were tested for correlation with subject d’ scores as well as mean within-subject reaction time, with no significant correlations found for either the in-scanner task or memory retention test (in-scanner d’: r = -.11, p = .57, 95% CI = [-.44 .26]; in-scanner RT: r = .11, p = .56, 95% CI = [-.25 .45]; retention d’: r = -.24, p = .30, 95% CI = [-.61 .22]; retention RT: r = -.27, p = .23, 95% CI = [-.63 .18]).
Quality Assurance Analyses
Group averages for z-Cho, z-Cre, z-Cho/NAA, and z-NAA/Cre are reported in Table 2. A one-way repeated measures ANOVA showed no significant effect of block type (rest, memorization, remember, test) for z-Cho (F(3, 503) = 0.46, p = .71) (Fig. 7a) or for z-Cho/NAA (F(3, 503) = 0.93, p = .43) (Fig. 7c). A similar tests showed a significant effect of block for z-Cre (F(3, 503) = 5.8, p = .00099) with a post-hoc Tukey HSD test revealing one significant difference between block types: rest blocks > remember blocks (p = .0006, 95% CI = [0.15, 0.71]) (Fig. 7b); additionally, a similar test showed a significant effect of block for z-NAA/Cre (F(3, 503) = 5.97, p = .00079) with a post-hoc Tukey HSD test revealing two significant differences between block types: remember blocks > rest blocks (p = .012, 95% CI = [0.05, 0.58]) and test blocks > rest blocks (p = .0026, 95% CI = [0.096, 0.62]) (Fig. 7d).
Figure 7.
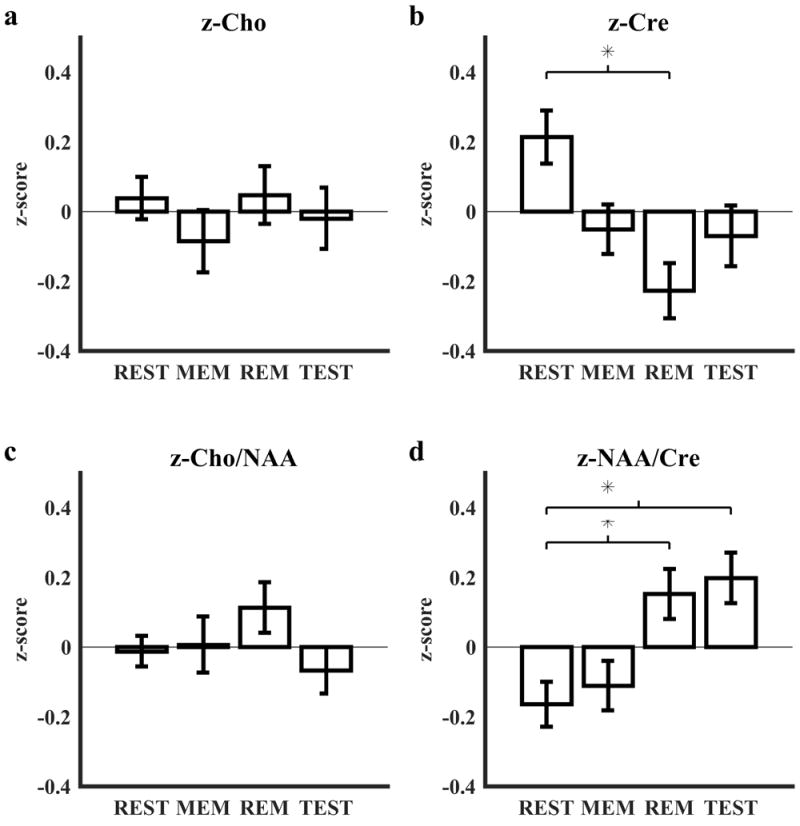
Quality assurance analyses. Estimation of (a) [Cho], (b) [Cre], (c) Cho/NAA, and (d) NAA/Cre were z-scored within each of the 31 subjects and averaged across the group for each block type of the configural working memory task. Error bars represent standard error from the mean. REST: rest blocks, MEM: memorization blocks, REM: remember blocks, TEST: test blocks.
DISCUSSION
This study demonstrated that changes in short-timescale 1H-MRS measurements correlate with cognitive processes in human MTL during a configural working memory task. Though the main outcome measure — the ratio of choline-containing metabolites to an internal standard of signal from creatine and phosphocreatine — increased while subjects actively maintained task-relevant information (remember blocks), quality assurance measures preclude a conclusion that this ratio increase was driven by cholinergic activity.
First, there was no evidence that estimates of [Cho] undergo task-based changes, while estimates of [Cre] did decrease during periods of active maintenance compared to rest; this finding alone does not preclude cholinergic contributions to the ratio change, since estimates of [Cre] were theorized to stand as a proxy for expected BOLD-related local field changes. However, the Cho/NAA ratio also did not present any task-related effects, and Cre resonance signal additionally drove significant task-dependent fluctuations in the NAA/Cre ratio, which would not be expected if both Cre and NAA resonance signals were affected similarly by local field changes.
Though [Cho] correlated across all scans with [Cre], the ratio increased during active maintenance, indicating a relative increase in [Cho] from the pairing. If faith in [Cre] as a reliable internal standard is maintained, this might be interpreted as an increase in cholinergic transmission. On the other hand, the task-based separation of [Cre] from [NAA] was unexpected, and does not support the theory that both resonances undergo correlational changes in model fitting alone; rather, this study establishes evidence for a task-based effect.
Study Design Limitations
Due to BOLD-related field changes, additional signal change from individual 1H-MRS-resolvable metabolite resonances cannot be separated as estimations of task-based activity. The attempt to use [Cre] as an internal standard was not convincing as a proxy for BOLD-related magnetic field changes. Future studies aiming to elucidate task-based changes in metabolite resonance signal should consider interleaved scan sequences that allow for ongoing collections of unsuppressed spectra interspersed with water-suppressed measurements for metabolite estimation (26), allowing for delineation of BOLD-related effects on the water signal during acquisition.
In conclusion, this study shows task-related changes in 1H-MRS metabolite resonance signals specific to human MTL during the active maintenance of configural working memory information. However, results also provide evidence to question the theory that creatine resonance signal could provide a reliable baseline for task-based local magnetic field fluctuations, so the underlying causes of signal fluctuations cannot be concluded. Caution is advised when considering Cre resonance signal as an internal standard for task-based 1H-MRS measurements until the nature of short-timescale changes is sufficiently characterized.
Acknowledgments
None
Grant support: US National Institutes of Health National Center for Advancing Translational Sciences (NIH-NCATS) 1KL2RR031974-01
References
- 1.Baddeley AD, Hitch G. Working memory. Psychology of learning and motivation. 1974 Dec 31;8:47–89. [Google Scholar]
- 2.Eichenbaum H, Cohen NJ. From conditioning to conscious recollection: Memory systems of the brain. Oxford University Press on Demand. 2004 Nov 18;:471–506. [Google Scholar]
- 3.Jonides J, Lewis RL, Nee DE, Lustig CA, Berman MG, Moore KS. The mind and brain of short-term memory. Annu Rev Psychol. 2008;59:193–224. doi: 10.1146/annurev.psych.59.103006.093615. [DOI] [PMC free article] [PubMed] [Google Scholar]
- 4.Barry C, Heys JG, Hasselmo ME. Possible role of acetylcholine in regulating spatial novelty effects on theta rhythm and grid cells. Front Neural Circuits. 2012;6:5. doi: 10.3389/fncir.2012.00005. [DOI] [PMC free article] [PubMed] [Google Scholar]
- 5.Fadda F, Melis F, Stancampiano R. Increased hippocampal acetylcholine release during a working memory task. European Journal of Pharmacology. 1996 Jun 27;307(2):R1–2. doi: 10.1016/0014-2999(96)00289-0. [DOI] [PubMed] [Google Scholar]
- 6.Fadda F, Cocco S, Stancampiano R. Hippocampal acetylcholine release correlates with spatial learning performance in freely moving rats. Neuroreport. 2000 Jul 14;11(10):2265–9. doi: 10.1097/00001756-200007140-00040. [DOI] [PubMed] [Google Scholar]
- 7.Egorov AV, Hamam BN, Fransén E, Hasselmo ME, Alonso AA. Graded persistent activity in entorhinal cortex neurons. Nature. 2002 Nov 14;420(6912):173–8. doi: 10.1038/nature01171. [DOI] [PubMed] [Google Scholar]
- 8.Beatty WW, Butters N, Janowsky DS. Patterns of memory failure after scopolamine treatment: implications for cholinergic hypotheses of dementia. Behav Neural Biol. 1986 Mar;45(2):196–211. doi: 10.1016/s0163-1047(86)90772-7. [DOI] [PubMed] [Google Scholar]
- 9.Schon K, Atri A, Hasselmo ME, Tricarico MD, LoPresti ML, Stern CE. Scopolamine reduces persistent activity related to long-term encoding in the parahippocampal gyrus during delayed matching in humans. J Neurosci. 2005 Oct 5;25(40):9112–23. doi: 10.1523/JNEUROSCI.1982-05.2005. [DOI] [PMC free article] [PubMed] [Google Scholar]
- 10.Schon K, Hasselmo ME, LoPresti ML, Tricarico MD, Stern CE. Persistence of Parahippocampal Representation in the Absence of Stimulus Input Enhances Long-Term Encoding: A Functional Magnetic Resonance Imaging Study of Subsequent Memory after a Delayed Match-to-Sample Task. J Neurosci. 2004 Dec 8;24(49):11088–97. doi: 10.1523/JNEUROSCI.3807-04.2004. [DOI] [PMC free article] [PubMed] [Google Scholar]
- 11.Prichard J, Rothman D, Novotny E, Petroff O, Kuwabara T, Avison M, et al. Lactate rise detected by 1H NMR in human visual cortex during physiologic stimulation. Proc Natl Acad Sci U S A. 1991 Jul 1;88(13):5829–31. doi: 10.1073/pnas.88.13.5829. [DOI] [PMC free article] [PubMed] [Google Scholar]
- 12.Stagg CJ. Magnetic Resonance Spectroscopy as a tool to study the role of GABA in motor-cortical plasticity. NeuroImage. 2014 Feb 1;86:19–27. doi: 10.1016/j.neuroimage.2013.01.009. [DOI] [PubMed] [Google Scholar]
- 13.Lally N, Mullins PG, Roberts MV, Price D, Gruber T, Haenschel C. Glutamatergic correlates of gamma-band oscillatory activity during cognition: A concurrent ER-MRS and EEG study. NeuroImage. 2014 Jan 15;85(Part 2):823–33. doi: 10.1016/j.neuroimage.2013.07.049. [DOI] [PubMed] [Google Scholar]
- 14.Nishitani N. Dynamics of cognitive processing in the human hippocampus by neuromagnetic and neurochemical assessments. NeuroImage. 2003 Sep;20(1):561–71. doi: 10.1016/s1053-8119(03)00280-5. [DOI] [PubMed] [Google Scholar]
- 15.Miller BL, Chang L, Booth R, Ernst T, Cornford M, Nikas D, McBride D, Jenden DJ. In vivo 1H MRS choline: correlation with in vitro chemistry/histology. Life Sci. 1996;58(22):1929–35. doi: 10.1016/0024-3205(96)00182-8. [DOI] [PubMed] [Google Scholar]
- 16.Yeagle PL, Hutton WC, Huang CH, Martin RB. Headgroup conformation and lipid--cholesterol association in phosphatidylcholine vesicles: a 31P(1H) nuclear Overhauser effect study. Proc Natl Acad Sci U S A. 1975 Sep;72(9):3477–81. doi: 10.1073/pnas.72.9.3477. [DOI] [PMC free article] [PubMed] [Google Scholar]
- 17.Ohno H, Maeda Y, Tsuchida E. 1H-NMR study of the effect of synthetic polymers on the fluidity, transition temperature and fusion of dipalmitoyl phosphatidylcholine small vesicles. Biochim Biophys Acta. 1981 Mar 20;642(1):27–36. doi: 10.1016/0005-2736(81)90134-6. [DOI] [PubMed] [Google Scholar]
- 18.Nilsson OG, Kalén P, Rosengren E, Björklund A. Acetylcholine release in the rat hippocampus as studied by microdialysis is dependent on axonal impulse flow and increases during behavioural activation. Neuroscience. 1990;36(2):325–38. doi: 10.1016/0306-4522(90)90429-8. [DOI] [PubMed] [Google Scholar]
- 19.Kanowski M, Kaufmann J, Braun J, Bernarding J, Tempelmann C. Quantitation of simulated short echo time 1H human brain spectra by LCModel and AMARES. Magn Reson Med. 2004 May 1;51(5):904–12. doi: 10.1002/mrm.20063. [DOI] [PubMed] [Google Scholar]
- 20.Jones DT, Shattuck KF, Brar JS, VanMeter JW. Organization for Human Brain Mapping. San Francisco: 2009. Choline Functional Magnetic Resonance Spectroscopy Correlated with BOLD Deactivations in the Default Mode Network. abstract 249. [Google Scholar]
- 21.Brainard DH. The Psychophysics Toolbox. Spat Vis. 1997;10(4):433–6. [PubMed] [Google Scholar]
- 22.Pelli DG. The VideoToolbox software for visual psychophysics: transforming numbers into movies. Spat Vis. 1997;10(4):437–42. [PubMed] [Google Scholar]
- 23.Provencher SW. Estimation of metabolite concentrations from localized in vivo proton NMR spectra. Magn Reson Med. 1993 Dec 1;30(6):672–9. doi: 10.1002/mrm.1910300604. [DOI] [PubMed] [Google Scholar]
- 24.Cavassila S, Deval S, Huegen C, van Ormondt D, Graveron-Demilly D. Cramér-Rao bounds: an evaluation tool for quantitation. NMR Biomed. 2001 Jun;14(4):278–83. doi: 10.1002/nbm.701. [DOI] [PubMed] [Google Scholar]
- 25.Bol’shev LN, Ubaidullaeva M. Chauvenet’s Test in the Classical Theory of Errors. Theory of Probability and its Applications. 1975;19(4):10. [Google Scholar]
- 26.Apšvalka D, Gadie A, Clemence M, Mullins PG. Event-related dynamics of glutamate and BOLD effects measured using functional magnetic resonance spectroscopy (fMRS) at 3T in a repetition suppression paradigm. Neuroimage. 2015 Sep;118:292–300. doi: 10.1016/j.neuroimage.2015.06.015. [DOI] [PubMed] [Google Scholar]


