Abstract
Central-field loss necessitates the use of peripheral vision which makes reading slow and difficult. Slower temporal processing of letter recognition has been shown to be a limiting factor in peripheral letter recognition and reading. Previous studies showed that perceptual learning can increase the number of letters recognized on each fixation and is accompanied by an increase in reading speed. We hypothesized that improvement in temporal processing speed underlies the observed training effects. Here, we proposed an adaptive training procedure to focus on boosting the speed of letter recognition, and investigated whether peripheral reading would be enhanced by this training method. Seven normally-sighted subjects were trained with four daily one-hour sessions of a letter recognition task at 10° in the lower visual field in a pre/post design. During training, we adjusted stimulus duration on a block by block basis to maintain task difficulty near a pre-defined level of 80% performance accuracy. Stimulus duration progressively decreased with training, indicative of faster letter recognition at the 80% criterion. Following training, reading speed measured using a rapid serial visual presentation showed a substantial improvement in the trained (lower) field (41%) and the untrained (upper) field (27%), similar to the improvements observed from the training with a fixed stimulus duration. Despite being no more effective than the previous training, the adaptive temporal training method may allow individualized training, and may have advantages for clinical populations.
Keywords: peripheral vision, reading speed, perceptual learning, temporal processing, visual span
1. Introduction
People with central-field loss must rely on their peripheral vision to read. Peripheral vision is characterized by reduced visual acuity, decreased contrast sensitivity, increased letter-position uncertainty (mislocation errors), and crowding over a larger spatial extent. Reading speed in these people is consequently severely reduced compared to foveal reading in normally-sighted people (Faye, 1984; Fine & Peli, 1995; Fletcher, Schuchard, & Watson, 1999; Legge, Rubin, Pelli, & Schleske, 1985). Since difficulty in reading is the most common complaint bringing people to low vision clinics (Elliott et al., 1997), it would be highly desirable to develop an effective training method to enhance reading performance for people with low vision.
Although both perceptual and oculomotor factors may have a major impact on peripheral reading and are relevant to rehabilitation, our current study focuses only on the perceptual deficit.
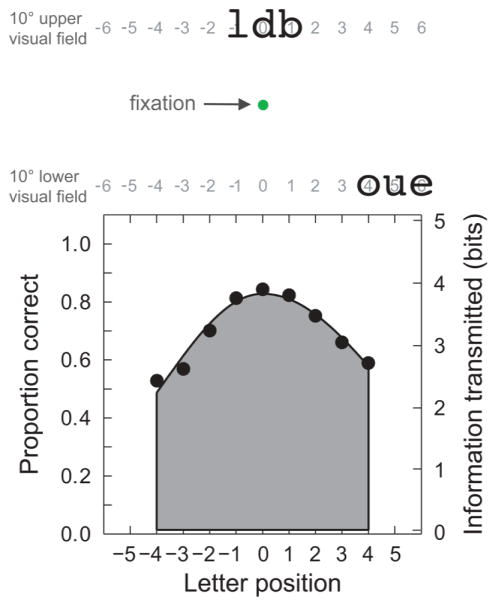
In reading, the number of neighboring letters that can be recognized accurately without moving the eyes is termed the visual span (Figure 1). Empirical evidence indicates that this spatial constraint may impose a sensory bottleneck on reading speed in both central and peripheral vision (Legge et al., 2007; Legge, Mansfield & Chung, 2001; Pelli et al., 2007; Yu, Cheung, Legge, & Chung, 2007; Yu, Park, Gerold, & Legge, 2010). Several perceptual learning studies have shown that peripheral reading speed can be improved through the expansion of the visual span with extensive practice on a letter-recognition task (identifying strings of three random letters) in the normal periphery (Chung et al., 2004; He, Legge, & Yu, 2013; Lee, Kwon, Legge, & Gefroh, 2010; Yu, Cheung, Legge, & Chung, 2010; Yu, Legge, et al., 2010). Across several studies, training yielded an expansion of the visual span by 0.7 to 1.9 letters, accompanied by an enhancement in reading speed of 41 to 66% (Chung et al., 2004; He et al., 2013; Lee et al., 2010; Yu et al., 2010; Yu, Legge, et al., 2010). In these studies, reading speed was measured using rapid serial visual presentation (RSVP) (see Methods for details) to minimize the need for eye movements.
Figure 1.
Examples of trigrams presented in the upper and lower visual fields and an example of a visual-span profile. Each trigram was presented at a letter position on a horizontal line intersecting the vertical midline at 10° above or below the fixation dot. A visual-span profile is constructed by plotting letter-recognition accuracy (proportion correct) as a function of letter position. The right vertical scale illustrates a conversion from proportion-correct for letter recognition to information transmitted in bits. The size of the visual span is indicated by the gray area under the visual-span profile.
Temporal processing also plays an important role in reading. It was found that the spatial extent of the visual span in peripheral vision increased with stimulus exposure time (Legge et al., 2001). It would therefore seem plausible that if processing speed increased from training, the same spatial extent of the visual span would be achieved with shorter stimuli, possibly allowing for faster reading. In reading, one important factor determining reading speed is the duration taken to process the spatial information (such as letter identity and position) within each fixation (i.e. speed of information processing). In aged patients with central-field loss, there is significant association between slower processing speed of visual letter recognition and reduced RSVP reading speed (Cheong et al., 2007).
As people age, processing speed decreases, as indicated by measures such as slower reaction times (Salthouse, 1996), possibly due to noisy brain processing arising from degraded sensory inputs (Mahncke, Bronstone, & Merzenich, 2006). Central-field loss may be exacerbated by age-related changes. Compared with age-matched normally-sighted older adults, people with central-field loss appear to have even slower speed of visual pattern recognition (Cheong, Legge, Lawrence, Cheung, & Ruff, 2008). Fortunately, training has been found to be effective in boosting processing speed in older adults (Astle, Blighe, Webb & McGraw, 2015; Edwards et al., 2005; Hertzog, Williams, & Walsh, 1976; Polat, Schor, et al., 2012). Improved temporal processing may underlie the training-induced improvement in many visual functions (Sterkin, Yehezkel & Polat, 2011; Lev, Ludwig et al., 2014; Polat, 2009; Polat, Schor, et al., 2012). For instance, training central vision to improve temporal processing has resulted in faster reading speed (eye-movement based reading) for small print in presbyopia (Polat, Schor, et al., 2012).
A similar mechanism may be true for perceptual learning in peripheral reading. Increase in temporal processing speed of letter recognition may underlie training-based improvements in RSVP reading found in previous studies (e.g., Yu, Legge, et al., 2010). In agreement with this hypothesis, a study showed that subjects with juvenile macular dystrophy exhibited training-induced improvements in page reading that were correlated with shorter fixation durations (Nguyen, Stockum, Hahn, & Trauzettel-Klosinski, 2011).
Previously, we assessed the effectiveness of peripheral-vision training with the trigram (string of three random letters) task on a group of normally-sighted older adults aged 55 to 76 years (Yu et al., 2010). Although the training benefit was less pronounced than for young, normally sighted adults, training did improve peripheral RSVP reading speed among these older subjects. As we hypothesized, the training outcome might fundamentally be an increase in the speed of letter processing rather than the apparent spatial enlargement of the visual span. Since the speed of letter processing is significantly impaired in people with central-field loss (Cheong et al., 2008), training may become more effective if it is designed to focus on improving temporal processing.
In the present study, we tested an adaptive procedure to focus on boosting the speed of letter processing, and investigated whether it would amplify improvements in peripheral reading speed. Two features of the adaptive training could be beneficial: 1) varying the exposure duration of training stimuli allows practice at multiple durations, which may help increase the speed of letter processing; and 2) adaptively adjusting exposure duration of training stimuli can help maintain task difficulty at a desired level.
A previous study showed that training on a sentence reading task resulted in greater improvement in peripheral RSVP reading compared with training on trigram letter recognition (Yu, Legge, et al., 2010). Unlike the training with trigrams which used stimuli with a single, fixed duration, the sentence reading training used a range of exposure durations. Since the duration taken to process spatial information is a factor limiting reading speed, practice processing spatial information at various durations might have been the basis for the more effective training using the reading task. In the present study, we adopted trigrams, the typical stimuli used in other learning studies, as the training stimuli while varying their exposure durations from block to block.
Task difficulty plays an important role in determining the magnitude of perceptual learning (Green & Bavelier, 2006) and generalization/specificity of learning (Ahissar & Hochstein, 1997). To maximize learning and its transfer, the training task needs to be “just barely too difficult” (Green & Bavelier, 2006). Retaining a constant intermediate level of task difficulty is also recommended for the purpose of keeping the trainee motivated (Chermak & Musiek, 2002). In addition, maintaining a constant performance level through manipulations such as decreasing exposure duration of training stimuli has been shown to be effective in increasing speed of processing (Ball et al., 1988; 2002). Here, we monitored the subject’s performance on the training task and adaptively altered the stimulus exposure duration on a block by block basis to keep the task difficulty (performance) close to a pre-determined level.
In summary, the primary goal of this study was to evaluate a training paradigm designed to improve peripheral reading with the focus of speeding up letter recognition while maintaining an appropriate level of task difficulty during training. We hypothesized that the adaptive temporal training proposed here is more effective for enhancing reading speed in the periphery compared with the training using stimuli with a single presentation time.
2. Methods
2.1. Subjects
Fourteen normally-sighted young adults (ages from 18 to 22 years) were randomly assigned to either a control group or a training group (seven subjects per group). The sample size was determined using a power analysis so that a clinically significant change in reading speed of 40% could be detected with a power of 0.8 and alpha of 0.05. The subjects were all native English speakers and had no prior experience with the tasks used in this study. A consent form approved by the Institutional Review Board of the University of Minnesota was signed by each subject before the testing. The present study was carried out in accordance with the Code of Ethics of the World Medical Association (Declaration of Helsinki).
2.2. Apparatus, stimuli, experimental design and data analysis
MATLAB (version 5.2.1) and the Psychophysics Toolbox extensions (Brainard, 1997; Pelli, 1997) were used to generate the stimuli and conduct our experiments. The stimuli were displayed on a SONY Trinitron colour graphic display (model: GDM-FW900; refresh rate: 76 Hz; resolution: 1,600 × 1,024), controlled by a Power Mac G4 computer (model: M8570).
All testing was carried out binocularly in a dimly lit room at a viewing distance of 40 cm. Stimuli were black letters on a white background (luminance of 89 cd/m2) with a Weber contrast of −99%. Letters were rendered in lowercase Courier, a serif font with fixed width. A print size (defined as x-height) of 3.5° was used for all testing because this value is larger than the critical print size for reading at 10° eccentricity (Chung, Mansfield, & Legge, 1998).
Pre- and post-test measurement: RSVP reading speed
The RSVP method was used to present sentences when measuring reading speed in the pre- and post-tests. In RSVP, words of a sentence are displayed sequentially one at a time at the same location (left justified) on the screen. Subjects fixated on a horizontal line while reading aloud sentences shown in the periphery. Two visual field locations, 10° eccentricity in the upper (untrained) and lower (trained) visual fields, were tested. A string of x’s was presented before the first word of each sentence to indicate the location of the upcoming words and also after the last word of each sentence as a post-mask.
For each visual field location, the proportion of words read correctly was measured at five different exposure durations (26, 53, 118, 250, and 526ms per word) using the method of constant stimuli. Each exposure duration was tested with six sentences. Subjects were able to read more than 80% of words correctly at the longest exposure duration and less than 30% of words correctly at the shortest exposure duration. A Weibull function was used for fitting the data. Reading speed was computed from the exposure duration producing 80% accuracy.
Pre- and post-test measurement: Visual-span profiles
Visual-span profiles, plots of proportion correct letter recognition as a function of letter position, were obtained with a trigram letter-recognition task (Legge et al., 2001). The stimuli were trigrams (random strings of three lowercase English letters) presented at various letter positions left and right of the midline. Subjects identified all three letters of each trigram in a left-to-right order while maintaining their fixation at the center of the display. Figure 1 shows examples of trigrams presented in the upper and lower visual fields and a visual-span profile. For each visual-span profile, letter positions are distributed along a horizontal line. The negative and positive numbers are used to label the position of the letter relative to the vertical midline. The position of each trigram is indicated by the location of the middle letter of the trigram. For example, trigram “ldb”, shown in Figure 1, is presented at letter position 0 at 10° in the upper visual field. The three letters are located at letter position −1, 0, and 1, respectively. For trigram “oue”, the three letters are at letter position 4, 5, and 6. Letter position 5 is the position of the trigram. We tested 11 trigram positions ranging from position −5 to 5. Sixteen trials were completed at each position. Each data point on the visual-span profile represents letter recognition accuracy calculated based on 48 trials in which the left, middle, or right letters of the trigrams were presented at the given letter position. Only the central 9 letter positions (−4 to 4) were analyzed because fewer trials presented letters at letter positions −6, −5, 5 and 6. Each visual-span profile was fit with an asymmetric Gaussian function defined by three parameters: peak amplitude, left-side standard deviation, and right-side standard deviation (Legge et al., 2001). As shown in Figure 1, proportion-correct of letter recognition (the left vertical scale) can be converted to bits of information transmitted (the right vertical scale) using the equation: bits of information transmitted = −0.036996 + 4.6761 × proportion-correct of letter recognition (Beckmann & Legge, 2002). The size of the visual span was quantified by summing the amount of information transmitted across the nine letter slots. This calculation is similar to computing the area under the profile.
Training
Subjects in the training group completed four one-hour daily sessions of a trigram letter recognition task at 10° in the lower visual field. By varying stimulus exposure duration according to the subject’s performance during training, we were able to train each subject at an approximately constant level of difficulty. Since there is no existing standard for how to select optimal task difficulty, we identified a range of training durations and a difficulty level for our adaptive procedure based on previous data. We established a performance level of 80% trigram recognition (computed as recognition accuracy averaged across the central 9 letter positions in a block of trials). We reanalyzed the RSVP training data from Yu, Legge, et al. (2010) and found that the post-test duration yielding this level of performance was close to 150ms. The maximum training-related improvement in RSVP reading accuracy also occurred for this stimulus duration. To ensure that the training covered the most improvable range of duration, we decided to concentrate the training close to the peak of the improvement, and set the long duration cutoff at 250ms.
As training progressed and overall performance in trigram letter recognition improved, stimulus duration was gradually reduced to maintain a constant letter recognition accuracy (80%). The exposure durations available to use in training were 250, 158, 132, 105, 92, 79 and 66ms (19, 12, 10, 8, 7, 6 and 5 frames). Subjects completed 16 blocks (11 letter positions × 4 trials per position = 44 trials per block) of the trigram letter-recognition task in each training session. After each block, performance accuracy was calculated and used to select the exposure duration in the next block. Duration was kept constant for all trials within the same block.
We adjusted the exposure duration through implementing a one-up, one-down staircase procedure. Exposure duration went down to the next shorter duration on the list in the subsequent block of trials each time subject’s performance exceeded the 80% criterion, and was increased to the next longer duration when performance failed to meet the criterion. For all subjects, training always began at 250ms on training day 1. Each subject continued working on this duration until his/her performance reached the 80% criterion. For the other training days, exposure duration of the first block was always the same as the last duration trained on the previous day. In the previous spatial training studies (Chung et al., 2004; Yu, Legge, et al., 2010), learning curves reached a plateau after two to three days, therefore for the present study, we decided to adopt a total number of training trials approximately equivalent to three days of training as in Yu, Legge, et al. (2010). Each trained subject completed a total of 2816 trials (704 trials per day) of the trigram task during training. Subjects in the control group received no training.
Experimental design
To assess whether learning generalized to an untrained visual field location, we trained at 10° in the lower visual field but measured visual span and reading speed at 10° in both lower and upper visual fields before and after training. We also evaluated the possible transfer of learning across exposure durations by measuring visual-span profiles at two exposure durations (a trained and an untrained duration) in the pre- and post-tests. The two durations were selected based on previous studies and pilot data. Previous learning studies (Chung et al., 2004; Yu, Legge, et al., 2010) used exposure duration of 105 ms to measure visual-span profiles. Our pilot data suggested that trained durations in the present study were likely to include 105 ms but not likely to include very short durations such as 39 ms. Therefore, we considered 105 ms as a trained duration and 39 ms as an untrained duration, and used these two durations to evaluate the possible transfer of learning across exposure durations.
In the pre-test, subjects completed 4 blocks of the RSVP reading task, 2 blocks for each visual field with a total of 60 trials. These were then followed by 16 blocks of the trigram letter-recognition task, 4 blocks for each combination of visual field location (upper and lower) and exposure duration (39 ms and 105 ms) with a total of 704 trials. This testing sequence was reversed in the post-test. For each task, a pseudo-randomized block sequence was used to minimize any sequencing effects. Practice trials (10 for RSVP and 44 for trigram task) were given at the beginning of each session and were excluded from data analyses. The control group participated in the same pre- and post-tests but did not participate in any lab sessions in-between.
Subjects’ eye positions were monitored through direct observation throughout the experiment by a second experimenter who could reliably detect eye movements as small as 1.5° (Fogt, Baughman, & Good, 2000). About 9% of RSVP reading trials were cancelled due to the detection of vertical eye movements. We discarded and replaced 1.4% of trigram trials containing eye movements.
3. Results
3.1. Adaptive changes across training
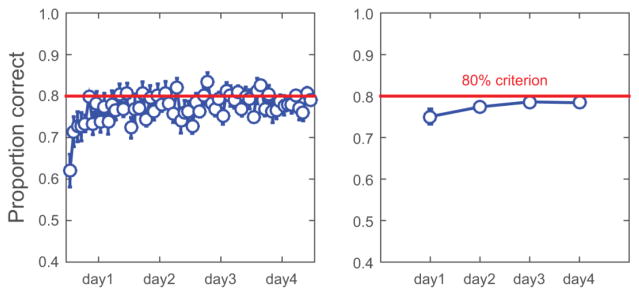
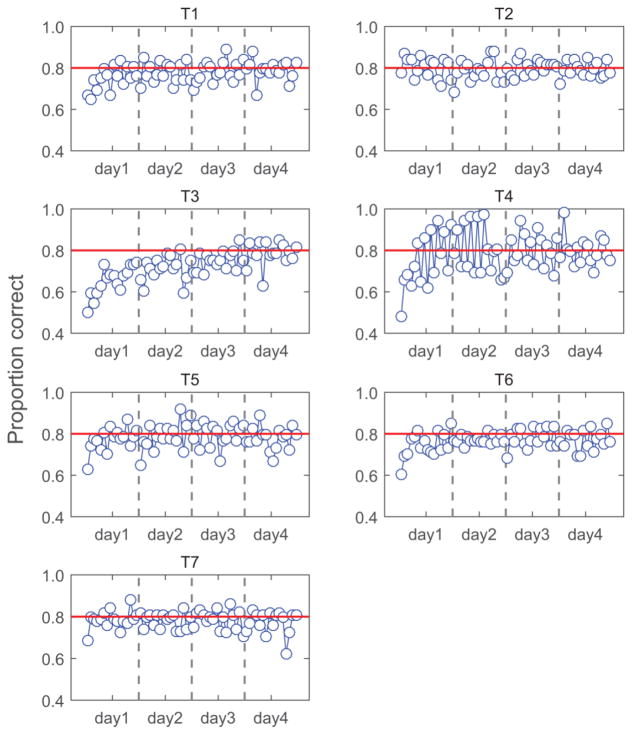
Figure 2 displays block-by-block (left panel) and day-by-day (right panel) changes in performance accuracy for the group average (see Appendix for individual subjects’ training data). By adjusting stimulus duration on a block by block basis, task difficulty was maintained at roughly 80% performance accuracy. Specifically, the average letter recognition accuracy was 75% on the first training day, gradually improved as training progressed, and was 78% on the last training day. There was a significant lapse in training benefit between training days 1 and 2 (3.45 ± 0.92 bits; calculated by subtracting visual-span size for the last block of day 1 from the one for the first block of day 2), t = −3.75, p = 0.01, but not between the other training days. This result, consistent with previous observations in the same age group (Yu, Legge, et al., 2010), suggests that learning becomes more stable as training progresses.
Figure 2.
Group-average performance accuracy during training. Left panel: block-by-block changes. Each data point is derived from one training block (44 trigram trials per block) and seven training subjects. Right panel: day-by-day changes (averaging performance accuracy across seven subjects and 16 blocks on each training day). The red horizontal line represents the 80% accuracy criterion. Error bars indicate standard errors.
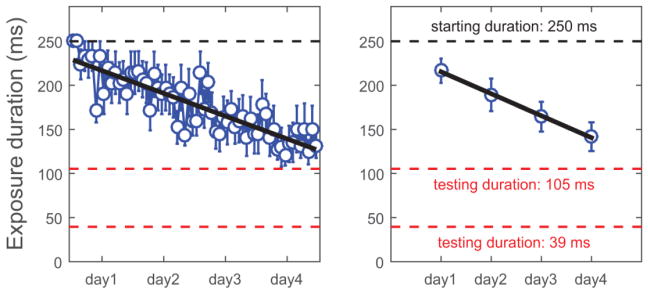
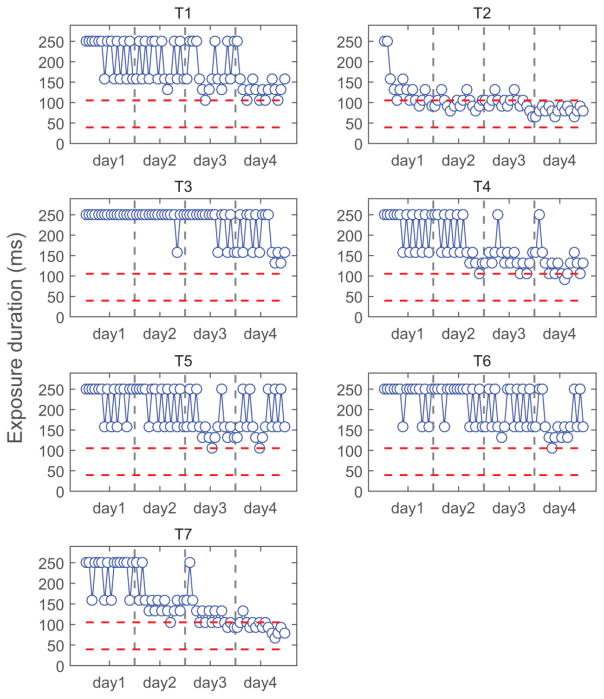
We also examined the changes in adaptive exposure duration across training for each subject (Figure A2) and for the group average (Figure 3). Training always started at 250ms. In order to maintain a constant letter recognition accuracy, stimulus duration was progressively reduced. As shown in Figure 3, the average trained exposure duration was 217 ms on training day one, and gradually reduced to 142 ms on day four. Data were fitted with a straight line with a slope of −25 ms/day or 1.6 ms/block. In other words, it took subjects 25 ms less time to process the same amount of information after each training day. In the trained (lower) visual field, we were able to estimate the exposure duration required to obtain 80% reading accuracy for both the pre- and post-tests. We found that the average threshold duration for reading was 278 ms before training and 196 ms after training. The amount of reduction in word processing time was 82 ms (about 21 ms/day averaged across 4 training days), which is close to the learning rate observed in the letter recognition training. During training, subjects were exposed to three to seven different exposure durations, based on the adaptive staircase (Figure A2). All except one trained subject (T3) were tested with the exposure duration of 105 ms (for 1 to 18 blocks). None had practiced at 39 ms. Therefore, we can consider 105 ms as a trained duration and 39 ms as an untrained duration. By comparing pre and post performance, we can examine whether or not visual span had similar increase at the trained and untrained exposure durations.
Figure 3.
Group-average trained exposure duration (ms). Left panel: block-by-block changes. Each data point corresponds to one training block averaged across the seven training subjects. Right panel: day-by-day changes (averaging trained exposure durations across seven subjects and 16 blocks on each training day). The black solid lines represent the best-fitted lines to the data. The black horizontal dashed line corresponds to the initial and also the longest exposure duration used in training, 250 ms. The red horizontal dashed lines represent the two exposure durations tested in the pre- and post-tests (105ms and 39ms). Error bars indicate standard errors.
3.2. Post-pre difference comparisons between the training and control groups
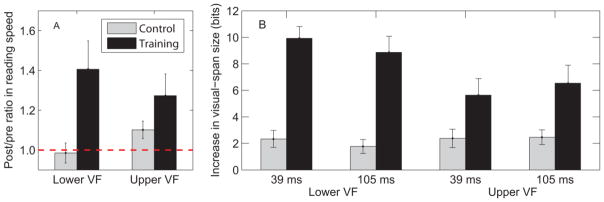
Visual-span size was analyzed using a repeated measures ANOVA with group as the between-subject factor. Three within-subject factors were test condition, visual field location and exposure duration. The ANOVA revealed three main effects (test condition, exposure duration, and group), two two-way interaction effects (test condition × visual field and test condition × group), and a three-way interaction of test condition, visual field and group. To interpret the interactions, post-hoc tests were performed. As shown in Figure 4B, although both groups showed significant increases in visual-span size, F(1,12) = 79.4, p < 0.0005, visual span increased more in the training group than in the control group, F(1,12) = 24.2, p < 0.0005. The training group (but not the control group) improved more in the trained (lower) visual field than in the untrained (upper) visual field (Figure 4B and Table 1), indicating partial transfer of learning across visual field, F(1,12) = 14.9, p = 0.002. Visual-span size was, on average, larger for 105 ms (23.8 bits) than for 39 ms (14.8 bits), F(1,12) = 628.3, p < 0.0005. However, no interaction effect of exposure duration and test condition emerged on visual-span size, suggesting a similar training-related improvement occurred for the two durations tested in the pre- and post-tests.
Figure 4.
Post/pre ratio in RSVP reading speed (Panel A) and post-pre difference in visual-span size (Panel B) for the control and training groups in both lower and upper visual fields. The red horizontal dashed line in Panel A indicates a post/pre ratio of one corresponding to no improvement. Error bars denote standard errors.
Table 1.
Mean improvement in performance ± standard error for the control and training groups.
| Visual Field | Exposure Duration (ms) | Control Group | Training Group | |
|---|---|---|---|---|
| RSVP Reading Speed (post/pre ratio) | Lower VF | 0.99 ± 0.05 | 1.41 ± 0.14 | |
| Upper VF | 1.10 ± 0.04 | 1.27 ± 0.11 | ||
| Visual-span Size (post-pre difference in bits) | Lower VF | 39 | 2.34 ± 0.64 | 9.92 ± 0.89 |
| 105 | 1.77 ± 0.52 | 8.87 ± 1.22 | ||
| Upper VF | 39 | 2.38 ± 0.69 | 5.64 ± 1.25 | |
| 105 | 2.46 ± 0.55 | 6.54 ± 1.36 |
Log reading speeds were used in the analysis so that equivalent post-pre changes in reading speed represent the same percentage changes in raw data. A repeated measures ANOVA was used to analyze log RSVP reading speed. The within-subject factor was test condition (pre- and post-tests) and visual field location (lower and upper visual fields). The between-subject factor was group (control and training groups). We found a significant interaction effect between test condition and group for log RSVP reading speed, F(1,12) = 6.97, p = 0.02. As shown in Figure 4A and Table 1, subjects in the training group showed significant post/pre improvements in RSVP reading speed while those in the control group did not. There is also an effect of visual field, F(1,12) = 4.99, p = 0.045. In general, reading speed was faster in the lower visual field (for instance, 227 wpm, averaged across the two groups in the pre-test) than in the upper visual field (207 wpm).
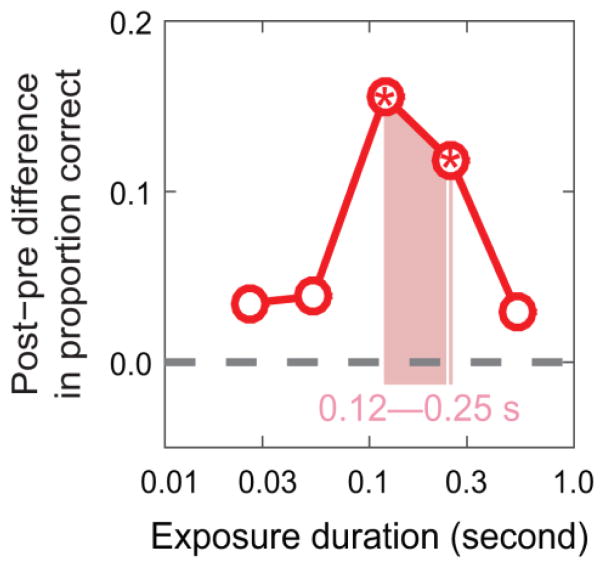
As shown in Figure 5, we also examined the transfer of learning to reading accuracy across various durations. In the present study, although the enlargement in visual span was transferred to an untrained duration of 39ms, the improvements in reading performance were observed only near the trained durations (110 and 250ms; ps < 0.05).
Figure 5.
The post-pre difference in reading accuracy in the trained (lower) visual field plotted as a function of exposure duration. The proportion of words read correctly was measured at five exposure durations. The horizontal dashed line represents zero difference between the post- and pre-tests. The pink shaded region represents the group averages of block-by-block trained exposure durations (250ms to 120ms). Stars within the circular symbols indicate that the corresponding post-pre difference in reading accuracy was significantly different than zero (based on two-tailed t-test).
3.3. Correlations
We examined the correlation between the post-pre improvement in RSVP reading speed and the post-pre improvement in visual-span size across all the fourteen subjects, and found significant correlations for both visual field locations and both exposure durations (0.54 ≤ r ≤ 0.86, ps < 0.05).
We also assessed the correlations between pre-test performance and post-pre improvement for the size of the visual span and reading speed in the training group. As shown in Table 2, all correlations are negative and almost all are statistically significant. The findings of negative correlations are in agreement with many previous perceptual learning studies (Astle, Li, Webb, Levi, & McGraw, 2013; Baldassarre et al., 2012; Fahle & Henke-Fahle, 1996; Tarita-Nistor, Brent, Steinbach, Markowitz, & González, 2014) and suggest that subjects with poorer starting performance are more likely to benefit from training.
Table 2.
Correlations between pre-test performance and post-pre improvement for both visual-span size and reading speed.
| Lower Visual Field | Upper Visual Field | |||
|---|---|---|---|---|
|
| ||||
| r | p | r | p | |
| Visual-span size (39 ms) | −0.60 | 0.157 | −0.89 | 0.007 |
| Visual-span size (105 ms) | −0.85 | 0.016 | −0.88 | 0.008 |
| Log(Reading speed) | −0.81 | 0.029 | −0.87 | 0.011 |
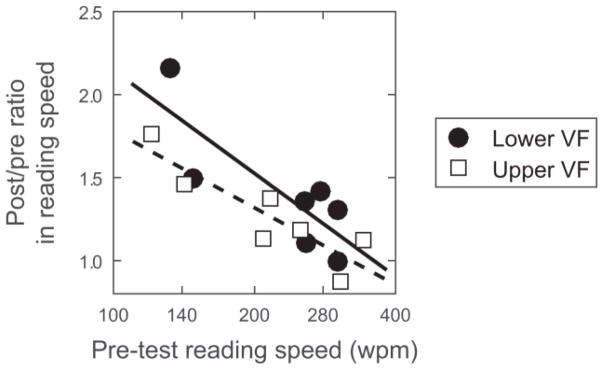
For instance, Figure 6 shows the negative correlations between the pre-test reading speed (log-transformed) and the post-pre improvement in reading speed for both upper and lower visual fields. Based on the best fit line for the trained visual field, subjects with a pre-test reading speed of 150 wpm can attain 75% improvement following the four daily one-hour training sessions. However, subjects who read at 200 wpm before training can only improve about 50%. For subjects who can already read at 300 wpm prior to training, our four-day training program may provide little benefit. Overall, subjects who have a higher starting level end up still a bit higher in performance after training than the subjects with the lower starting levels.
Figure 6.
Post/pre ratio in RSVP reading speed versus pre-test RSVP reading speed (on a log scale). The filled circles represent data for the lower (trained) visual field. The open squares represent data for the upper (untrained) visual field. The black solid line and the black dotted line are the best fit lines for the lower and upper visual fields, respectively.
4. Discussion and conclusion
Both spatial and temporal processing play an important role in reading. Since the speed of letter processing is significantly impaired in people with central-field loss (Cheong et al., 2008) and the slower processing speed is associated with reduced RSVP reading speed (Cheong et al., 2007), training for improving peripheral reading speed may be more effective if it is designed to focus on improving temporal processing. We tested a modified perceptual-learning procedure intended to boost the speed of letter recognition in peripheral vision. This adaptive procedure resulted in faster letter recognition. We hypothesized that lower temporal thresholds for letter recognition would transfer to greater improvements in reading speed following training. However, the magnitude of improvement we found in RSVP reading speed (41% in the trained field) was similar to improvements found previously (41 to 66%) (Chung et al., 2004; He et al., 2013; Lee et al., 2010; Yu, Legge, et al., 2010). We acknowledge that the comparison may not be entirely accurate because of the differences in experimental details across the studies. Consistent with previous findings (Chung et al., 2004; He et al., 2013; Lee et al., 2010; Yu et al., 2010; Yu, Legge, et al., 2010), the training effect transferred to an untrained visual field location for both RSVP reading speed and visual-span size. The transfer of learning across retinal locations was incomplete for visual-span size, indicating that the neural basis of the training may occur at both retinotopic and nonretinotopic levels of the visual pathway. As suggested by Yu, Jiang, Legge, and He (2015), the neural bottleneck for slower reading with peripherally presented text likely spans multiple cortical stages, from the early retinotopic cortical representation to the object category selective cortex.
The two features of the modified training—variable stimulus durations rather than a fixed duration, and focusing the training on an intermediate level of difficulty—did not result in amplified transfer to reading. What are the implications of this finding?
First, the transfer of the learning (increased speed of letter processing) to reading may be determined by something other than the number of trained exposure durations. The adaptive temporal training concentrated most of the trials in durations close to the fixed values used in the previous spatial training studies (about 100 ms (Chung et al., 2004; Yu, Legge, et al., 2010) and 200 ms (He et al., 2013; Lee et al., 2010)). It may be that trained exposure duration within a particular range is a key determining factor for training benefits. The similar amount of learning attained in both training methods indicates that the fixed durations may have already been well chosen.
Second, the training was intended to, but might have failed to focus on a proper level of difficulty to maximize learning and its transfer. The average block-by-block trained exposure duration was between 250ms and 120ms. Some of the previous studies that showed similar benefits from learning (Chung et al., 2004; Yu, Legge, et al., 2010) adopted a shorter exposure duration (about 100 ms) throughout the training in which the level of task difficulty is obviously higher. It is possible that the adaptive criterion of 80% letter recognition did not make the task difficult enough to promote greater perceptual learning.
We matched the number of training trials to the amount of training required to reach asymptote in the previous studies (as discussed in the Methods). As shown in Figure 3, the trained exposure duration monotonically reduced with training in a linear fashion, suggesting that we did not have enough trials to reach asymptote in the current training. It remains possible that additional sessions of adaptive temporal training would have yielded faster reading in the post test.
Our current study focused only on the perceptual deficit in reading with peripheral vision. However, both perceptual and oculomotor factors may play an important role in peripheral reading and are relevant to rehabilitation. When studying oculomotor factors affecting reading, perceptual span instead of visual span may be considered. Perceptual span is a concept similar to visual span but incorporating the spatial area influential to eye movements in page reading (McConkie & Rayner, 1975). Recent studies have shown that speed of eye-movement based reading in patients with central-field loss is limited by the size of the perceptual span (Crossland & Rubin, 2006), which is fully mediated by the total number of fixations (Calabrèse, Bernard, Faure, Hoffart, & Castet, 2014). Although we did not evaluate whether the improvements following the current training transfers to eye-movement-mediated reading, a previous study (Nguyen et al., 2011) showed favorable results. Nguyen and collegues found that training patients with central-field loss using RSVP reading leads to improvements in page reading.
The present study shows that adaptive temporal training using a trigram letter recognition task can improve peripheral reading speed of normally-sighted young adults presumably by increasing both the amount and the speed of information transmitted through the visual span. In daily page reading, the improvement may be reflected as an increased number of letters recognized accurately per fixation and shorter fixation duration. Despite being no more effective for improving peripheral reading than the previous training, the adaptive training method could still be useful for people with central-field loss. This clinical group has a high degree of inter-individual variability in their ocular conditions and may benefit more from individualized training. Our finding that training benefits are greater for subjects with lower pre-training reading speeds may indicate that this type of training would be more useful for patients with lower reading speeds. In addition, it remains possible that with extended training and/or using shorter exposure duration(s), this version of training would prove more advantageous in older subjects or those with AMD. Methodologically, future studies may consider to adopt mediation analysis (Calabrèse et al., 2014) to help identify additional factors contributing to the effectiveness of training.
Acknowledgments
This research was supported by NIH grants EY002934, EY012810, and EY025658.
Appendix
Figure A1.
Block-by-block performance accuracy during training for the seven trained subjects. Each data point is derived from one training block (44 trigram trials per block). Boundaries between days are indicated by the vertical dashed lines. The red horizontal line represents the 80% accuracy criterion.
Figure A2.
Block-by-block trained exposure duration (ms) for the seven trained subjects. Each data point corresponds to one training block. Boundaries between days are indicated by the vertical dashed lines. The red horizontal dashed lines represent the two exposure durations tested in the pre- and post-tests (105ms and 39ms).
Footnotes
Publisher's Disclaimer: This is a PDF file of an unedited manuscript that has been accepted for publication. As a service to our customers we are providing this early version of the manuscript. The manuscript will undergo copyediting, typesetting, and review of the resulting proof before it is published in its final citable form. Please note that during the production process errors may be discovered which could affect the content, and all legal disclaimers that apply to the journal pertain.
References
- Ahissar M, Hochstein S. Task difficulty and the specificity of perceptual learning. Nature. 1997;387(6631):401–406. doi: 10.1038/387401a0. [DOI] [PubMed] [Google Scholar]
- Astle AT, Blighe AJ, Webb BS, McGraw PV. The effect of normal aging and age-related macular degeneration on perceptual learning. Journal of vision. 2015;15(10):16–16. doi: 10.1167/15.10.16. [DOI] [PMC free article] [PubMed] [Google Scholar]
- Astle AT, Li RW, Webb BS, Levi DM, McGraw PV. A Weber-like law for perceptual learning. Scientific reports. 2013:3. doi: 10.1038/srep01158. [DOI] [PMC free article] [PubMed] [Google Scholar]
- Baldassarre A, Lewis CM, Committeri G, Snyder AZ, Romani GL, Corbetta M. Individual variability in functional connectivity predicts performance of a perceptual task. Proceedings of the National Academy of Sciences. 2012;109(9):3516–3521. doi: 10.1073/pnas.1113148109. [DOI] [PMC free article] [PubMed] [Google Scholar]
- Ball KK, Beard BL, Roenker DL, Miller RL, Griggs DS. Age and visual search: Expanding the useful field of view. JOSA A. 1988;5(12):2210–2219. doi: 10.1364/josaa.5.002210. [DOI] [PubMed] [Google Scholar]
- Ball K, Berch DB, Helmers KF, Jobe JB, Leveck MD, Marsiske M, … Unverzagt FW. Effects of cognitive training interventions with older adults: a randomized controlled trial. Jama. 2002;288(18):2271–2281. doi: 10.1001/jama.288.18.2271. [DOI] [PMC free article] [PubMed] [Google Scholar]
- Beckmann PJ, Legge GE. Preneural limitations on letter identification in central and peripheral vision. JOSA A. 2002;19(12):2349–2362. doi: 10.1364/josaa.19.002349. [DOI] [PubMed] [Google Scholar]
- Brainard DH. The psychophysics toolbox. Spatial Vision. 1997;10:433–436. [PubMed] [Google Scholar]
- Calabrèse A, Bernard JB, Faure G, Hoffart L, Castet E. Eye movements and reading speed in macular disease: the shrinking perceptual span hypothesis requires and is supported by a mediation analysis. Investigative Ophthalmology & Visual Science. 2014;55(6):3638–3645. doi: 10.1167/iovs.13-13408. [DOI] [PubMed] [Google Scholar]
- Cheong AM, Legge GE, Lawrence MG, Cheung SH, Ruff MA. Relationship between slow visual processing and reading speed in people with macular degeneration. Vision Res. 2007;47(23):2943–2955. doi: 10.1016/j.visres.2007.07.010. [DOI] [PMC free article] [PubMed] [Google Scholar]
- Cheong AMY, Legge GE, Lawrence MG, Cheung SH, Ruff MA. Relationship between visual span and reading performance in age-related macular degeneration. Vision research. 2008;48(4):577–588. doi: 10.1016/j.visres.2007.11.022. [DOI] [PMC free article] [PubMed] [Google Scholar]
- Chermak GD, Musiek FE. Auditory training: principles and approaches for remediating and managing auditory processing disorders. Paper presented at the Seminars in Hearing.2002. [Google Scholar]
- Chung ST, Mansfield JS, Legge GE. Psychophysics of reading. XVIII. The effect of print size on reading speed in normal peripheral vision. Vision research. 1998;38(19):2949–2962. doi: 10.1016/s0042-6989(98)00072-8. [DOI] [PubMed] [Google Scholar]
- Chung STL, Legge GE, Cheung SH. Letter-recognition and reading speed in peripheral vision benefit from perceptual learning. Vision research. 2004;44(7):695–709. doi: 10.1016/j.visres.2003.09.028. [DOI] [PMC free article] [PubMed] [Google Scholar]
- Crossland MD, Rubin GS. Eye movements and reading in macular disease: Further support for the shrinking perceptual span hypothesis. Vision Research. 2006;46:590–597. doi: 10.1016/j.visres.2005.05.015. [DOI] [PubMed] [Google Scholar]
- Edwards JD, Wadley V, Vance D, Wood K, Roenker D, Ball K. The impact of speed of processing training on cognitive and everyday performance. Aging & mental health. 2005;9(3):262–271. doi: 10.1080/13607860412331336788. [DOI] [PubMed] [Google Scholar]
- Elliott DB, Trukolo-Ilic M, Strong JG, Pace R, Plotkin A, Bevers P. Demographic characteristics of the vision-disabled elderly. Investigative Ophthalmology and Visual Science. 1997;38(12):2566–2575. [PubMed] [Google Scholar]
- Fahle M, Henke-Fahle S. Interobserver variance in perceptual performance and learning. Investigative Ophthalmology & Visual Science. 1996;37(5):869–877. [PubMed] [Google Scholar]
- Faye EE. Clinical low vision. Little, Brown; Boston: 1984. [Google Scholar]
- Fine EM, Peli E. Scrolled and rapid serial visual presentation texts are read at similar rates by the visually impaired. JOSA A. 1995;12(10):2286–2292. doi: 10.1364/josaa.12.002286. [DOI] [PubMed] [Google Scholar]
- Fletcher DC, Schuchard RA, Watson G. Relative locations of macular scotomas near the PRL: effect on low vision reading. Journal of Rehabilitation Research and Development. 1999;36(4):356–364. [PubMed] [Google Scholar]
- Fogt N, Baughman BJ, Good G. The effect of experience on the detection of small eye movements. Optometry & Vision Science. 2000;77(12):670–674. doi: 10.1097/00006324-200012000-00014. [DOI] [PubMed] [Google Scholar]
- Friedman DS, O’Colmain BJ, Munoz B, Tomany SC, McCarty C, De Jong P, … Kempen J. Prevalence of age-related macular degeneration in the United States. Arch ophthalmol. 2004;122(4):564–572. doi: 10.1001/archopht.122.4.564. [DOI] [PubMed] [Google Scholar]
- Green CS, Bavelier D. The cognitive neuroscience of video games. Digital media: Transformations in human communication. 2006:211–223. [Google Scholar]
- Guest D, Howard CJ, Brown LA, Gleeson H. Aging and the rate of visual information processing. Journal of vision. 2015;15(14):10–10. doi: 10.1167/15.14.10. [DOI] [PubMed] [Google Scholar]
- He Y, Legge GE, Yu D. Sensory and cognitive influences on the training-related improvement of reading speed in peripheral vision. Journal of vision. 2013;13(7):14. doi: 10.1167/13.7.14. [DOI] [PMC free article] [PubMed] [Google Scholar]
- Hertzog CK, Williams MV, Walsh DA. The effect of practice on age differences in central perceptual processing. Journal of Gerontology. 1976;31(4):428–433. doi: 10.1093/geronj/31.4.428. [DOI] [PubMed] [Google Scholar]
- Lee HW, Kwon M, Legge GE, Gefroh JJ. Training improves reading speed in peripheral vision: Is it due to attention? Journal of vision. 2010;10(6):18–18. doi: 10.1167/10.6.18. [DOI] [PMC free article] [PubMed] [Google Scholar]
- Legge GE, Cheung SH, Yu D, Chung ST, Lee HW, Owens DP. The case for the visual span as a sensory bottleneck in reading. J Vis. 2007;7(2):9, 1–15. doi: 10.1167/7.2.9. [DOI] [PMC free article] [PubMed] [Google Scholar]
- Legge GE, Mansfield JS, Chung ST. Psychophysics of reading: XX. Linking letter recognition to reading speed in central and peripheral vision. Vision research. 2001;41(6):725–743. doi: 10.1016/s0042-6989(00)00295-9. [DOI] [PubMed] [Google Scholar]
- Legge GE, Rubin GS, Pelli DG, Schleske MM. Psychophysics of reading—II. Low vision. Vision research. 1985;25(2):253–265. doi: 10.1016/0042-6989(85)90118-x. [DOI] [PubMed] [Google Scholar]
- Lev M, Ludwig K, Gilaie-Dotan S, Voss S, Sterzer P, Hesselmann G, Polat U. Training improves visual processing speed and generalizes to untrained functions. Scientific reports. 2014:4. doi: 10.1038/srep07251. [DOI] [PMC free article] [PubMed] [Google Scholar]
- Mahncke HW, Bronstone A, Merzenich MM. Brain plasticity and functional losses in the aged: scientific bases for a novel intervention. Progress in brain research. 2006;157:81–109. doi: 10.1016/S0079-6123(06)57006-2. [DOI] [PubMed] [Google Scholar]
- McConkie GW, Rayner K. The span of the effective stimulus during a fixation in reading. Perception & Psychophysics. 1975;17:578–586. [Google Scholar]
- Nguyen NX, Stockum A, Hahn GA, Trauzettel-Klosinski S. Training to improve reading speed in patients with juvenile macular dystrophy: a randomized study comparing two training methods. Acta ophthalmologica. 2011;89(1):e82–e88. doi: 10.1111/j.1755-3768.2010.02081.x. [DOI] [PubMed] [Google Scholar]
- Pelli DG. The VideoToolbox software for visual psychophysics: Transforming numbers into movies. Spatial Vision. 1997;10(4):437–442. [PubMed] [Google Scholar]
- Pelli DG, Tillman KA, Freeman J, Su M, Berger TD, Majaj NJ. Crowding and eccentricity determine reading rate. Journal of vision. 2007;7(2):20–20. doi: 10.1167/7.2.20. [DOI] [PubMed] [Google Scholar]
- Polat U. Making perceptual learning practical to improve visual functions. Vision research. 2009;9(21):2566–2573. doi: 10.1016/j.visres.2009.06.005. [DOI] [PubMed] [Google Scholar]
- Polat U, Schor C, Tong JL, Zomet A, Lev M, Yehezkel O, … Levi DM. Training the brain to overcome the effect of aging on the human eye. Scientific reports. 2012:2. doi: 10.1038/srep00278. [DOI] [PMC free article] [PubMed] [Google Scholar]
- Salthouse TA. The processing-speed theory of adult age differences in cognition. Psychological review. 1996;103(3):403. doi: 10.1037/0033-295x.103.3.403. [DOI] [PubMed] [Google Scholar]
- Sterkin A, Yehezkel O, Polat U. Learning to be fast: gain accuracy with speed. Vision research. 2012;61:115–124. doi: 10.1016/j.visres.2011.09.015. [DOI] [PubMed] [Google Scholar]
- Tarita-Nistor L, Brent MH, Steinbach MJ, Markowitz SN, González EG. Reading training with threshold stimuli in people with central vision loss: a feasibility study. Optometry & Vision Science. 2014;91(1):86–96. doi: 10.1097/OPX.0000000000000108. [DOI] [PubMed] [Google Scholar]
- Yu D, Cheung SH, Legge GE, Chung ST. Reading speed in the peripheral visual field of older adults: Does it benefit from perceptual learning? Vision research. 2010;50(9):860–869. doi: 10.1016/j.visres.2010.02.006. [DOI] [PMC free article] [PubMed] [Google Scholar]
- Yu D, Cheung SH, Legge GE, Chung ST. Effect of letter spacing on visual span and reading speed. J Vis. 2007;7(2):2, 1–10. doi: 10.1167/7.2.2. [DOI] [PMC free article] [PubMed] [Google Scholar]
- Yu D, Jiang Y, Legge GE, He S. Locating the cortical bottleneck for slow reading in peripheral vision. Journal of vision. 2015;15(11):3–3. doi: 10.1167/15.11.3. [DOI] [PMC free article] [PubMed] [Google Scholar]
- Yu D, Legge GE, Park H, Gage E, Chung STL. Development of a training protocol to improve reading performance in peripheral vision. Vision research. 2010;50(1):36–45. doi: 10.1016/j.visres.2009.10.005. [DOI] [PMC free article] [PubMed] [Google Scholar]
- Yu D, Park H, Gerold D, Legge GE. Comparing reading speed for horizontal and vertical English text. J Vis. 2010;10(2):21, 21–17. doi: 10.1167/10.2.21. [DOI] [PMC free article] [PubMed] [Google Scholar]


