

Abstract
Lipopolysaccharide (LPS, endotoxin) is the major component of the outer leaflet of the outer membrane of Gram‐negative bacteria such as Escherichia coli and Salmonella typhimurium. LPS is a large lipid containing several acyl chains as its hydrophobic base and numerous sugars as its hydrophilic core and O‐antigen domains, and is an essential element of the organisms' natural defenses in adverse environmental conditions. LptC is one of seven members of the lipopolysaccharide transport (Lpt) protein family that functions to transport LPS from the inner membrane (IM) to the outer leaflet of the outer membrane of the bacterium. LptC is anchored to the IM and associated with the IM LptFGB2 complex. It is hypothesized that LPS binds to LptC at the IM, transfers to LptA to cross the periplasm, and is inserted by LptDE into the outer leaflet of the outer membrane. The studies described here comprehensively characterize and quantitate the binding of LPS to LptC. Site‐directed spin labeling electron paramagnetic resonance spectroscopy was utilized to characterize the LptC dimer in solution and monitor spin label mobility changes at 10 sites across the protein upon addition of exogenous LPS. The results indicate that soluble LptC forms concentration‐independent N‐terminal dimers in solution, LptA binding does not change the conformation of the LptC dimer nor appreciably disrupt the LptC dimer in vitro, and LPS binding affects the entire LptC protein, with the center and C‐terminal regions showing a greater affinity for LPS than the N‐terminal domain, which has similar dissociation constants to LptA.
Keywords: LptC, lipopolysaccharide, periplasmic protein, LPS binding protein, EPR spectroscopy, dimer, dissociation constant
Introduction
The outer membrane (OM) of Gram‐negative bacteria acts as a highly selective permeability barrier to protect the cell from environmental stresses.1 The OM is asymmetric in the lipid content of its inner and outer leaflets, with the outer leaflet largely composed of lipopolysaccharide (LPS; Fig. 1A). LPS contains several acyl chains as its hydrophobic lipid base and numerous sugars as its hydrophilic antigenic domain. The lipid A base of LPS is synthesized in the cytoplasm and inserted into the inner leaflet of the inner membrane (IM), at which point the core sugars are added.2 The ABC transporter MsbA then flips the lipid A with the core sugars from the inner leaflet to the outer leaflet of the IM,3, 4, 5 followed by the addition of the O‐antigen by the WaaL ligase to generate LPS,4 which is next transported through the periplasm to the outer leaflet of the OM by the Lpt (LPS transport) system. Seven proteins make up the LPS transport system:6, 7, 8, 9, 10, 11, 12, 13, 14 LptFGB2 is an inner membrane ABC transporter that extracts LPS from the IM, LptC is a membrane‐anchored periplasmic protein associated with LptFGB2 and expected to accept LPS from the IM complex and transfer it to the soluble periplasmic protein LptA, one or more LptA proteins form a bridge between LptC and LptD to protect the hydrophobic acyl chains of LPS during transport through the periplasm, and LptDE is an OM protein complex that accepts LPS from LptA and inserts it into the outer leaflet of the OM (Fig. 1B). Including the recent structure of the intact IM complex,15 the structures of all seven proteins involved in LPS transport in Gram‐negative bacteria have now been solved.5, 16, 17, 18, 19, 20 These structures provide valuable insights into the mechanism of the essential LPS transport process.
Figure 1.
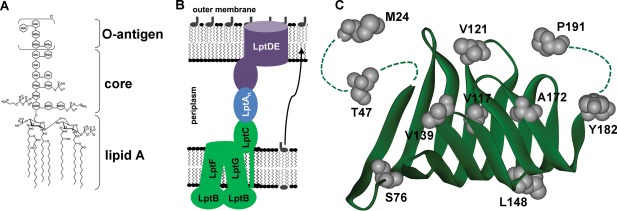
Cartoon representation of the LPS transport proteins and structures of LPS and LptC. (A) General structure of E. coli O111:B4 LPS.2, 43 (B) Cartoon illustrating the seven E. coli proteins involved in the transport of LPS (gray lipids) from the inner membrane (LptFGB2C; green), across the periplasm (LptA; blue), to the outer leaflet of the outer membrane (LptDE is shown as an OM complex containing the OM barrel protein LptD with an N‐terminal soluble domain and LptE folded inside the barrel as a plug; purple) in Gram‐negative bacteria. Multiple LptA proteins may span the periplasm. (C) Structure of the soluble domain of monomeric LptC (amino acids 24–191; pdb: 3MY218) with the sites studied here labeled and highlighted in gray. The N‐terminal residues and C‐terminal tail (represented by dotted lines) are unresolved in the crystal structure.
Further questions such as how and where LPS binds and how the proteins interact with each other and change conformation during function are also being resolved.21, 22, 23, 24, 25, 26, 27, 28 In vitro studies on the soluble domain of LptC (amino acids 24–191) show that LPS co‐elutes with 6xHis‐tagged LptC from affinity resin and suggest that the transfer of LPS from LptC to LptA is unidirectional.18 In addition, a dissociation constant was determined for LptC:LOS (lipo‐oligosaccharide, LPS lacking the O‐antigen).29 In vivo studies on 23 mutants of LptC substituted with the unnatural amino acid pPBA indicated that LPS could cross‐link with four of the sites tested, the N‐terminal site T47pPBA and interior‐facing sites F78pPBA, A172pPBA, and Y182pPBA upon irradiation with UV light, supporting the hypothesis that LPS binds to the interior fold of LptC.26 Also, the affinities of the LptC‐LptA25 and the LptA‐LPS30 interactions were determined and the effects of high pressure on LptA and LptC were characterized.31 In vitro studies to further characterize the effect of LPS binding on the LptC dimer, similar to the LptA‐LPS studies, and to quantitate the binding of intact LPS to LptC have yet to be carried out. Thus, we have examined the characteristics of the LptC dimer in solution, the affinity of the LptC–LPS interaction, and the effects of LPS binding on the LptC protein using site‐directed spin labeling electron paramagnetic resonance (EPR) spectroscopy techniques. The spin label side chain introduced at unique positions with the purified LptC protein is an excellent reporter of local packing, protein–ligand, and protein–protein interaction sites. A major strength of the EPR spectroscopy method is its ability to detect and follow changes in local structure due to conformational changes or dynamic interactions with other proteins or substrates based on spin label mobility changes or distance changes between two spin labels;32 therefore, it is ideally suited for the studies presented here on E. coli LptC.
Results
Soluble LptC is a dimer in solution
The soluble domain of LptC was first reported as a crystallographic monomer with a structure strikingly similar to that of LptA (Fig. 1C).18 The structure of the soluble domain of LptC containing the point mutation G153R was also solved. The protomer structure is similar to that of the unmutated protein but crystallizes as a terminal dimer with the N‐termini forming the dimer interface (Fig. 2A).20 To test the oligomerization state of LptC in solution, size‐exclusion chromatography laser light scattering (SEC‐LS) was carried out on the soluble domain of LptC to determine the weight‐average molecular weight (MW) of the protein in buffer. SEC‐LS data indicated that an elution peak containing 108 µM LptC has an average MW of 43.7 kDa ± 5%. This is twice the 21.3 kDa MW of the 6×‐His‐tagged soluble LptC protein monomer submitted for analysis, verifying that LptC forms dimers in solution. To test if dimerization of LptC is concentration‐dependent, as was found for LptA,25 a lower concentration sample was also analyzed. LS data indicated that an elution peak containing 1 µM LptC also has an average MW of 44.3 kDa ± 5%. Therefore, the soluble domain of LptC appears to be a dimer even at very low protein concentrations. In addition, the LS data indicated that oligomerization does not appear to be concentration dependent in the 1–108 µM range tested.
Figure 2.
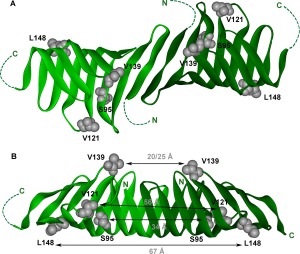
LptC N‐terminal dimer supported by the DEER data (pdb: 4B5420). (A) Sites spin labeled for DEER spectroscopy studies on the LptC dimer orientation viewed straight down onto the dimer interface. The unresolved N‐ and C‐terminal residues of the crystal structure are represented by dotted lines. N indicates the N‐terminus and C denotes the location of the C‐terminus. (B) The LptC dimer structure from A rotated to view the side of the dimer interface. Distances experimentally derived from the DEER data presented in Figure 3 are indicated for each site.
To verify the orientation of the LptC dimer in solution, double electron electron resonance (DEER) spectroscopy was carried out to measure the distances between spin labeled sites on each protomer. LptA forms end‐to‐end oligomers in solution, with the N‐ and C‐termini forming the interaction interfaces.19, 25 In contrast, the crystal structure of G153R LptC suggests the N‐termini form the interaction interface for the LptC terminal dimer.20 DEER data reporting on the distances between each spin labeled site on four different mutant LptC proteins (Fig. 3) support the N–N dimer structure observed in the dimeric crystal structure.20 As shown in Figure 3, the experimentally derived distances between LptC proteins, using S95R1, V121R1, V139R1, and L148R1 as probes (black lines), correspond to the predicted distance distributions (gray area plots) between these sites in the N‐N dimer structure. The N‐terminal dimer orientation and supporting experimentally derived DEER distances are shown in Figure 2B. In addition, Q65C LptC protein, which contains a cysteine on the putative dimer interface of LptC ∼7 Å apart from each other, readily forms disulfide‐bonded dimers upon addition of cross‐linkers with 8 and 13 Å spacers (Supporting Information, Fig. S1A). And, Y182R1, which is located on the C‐terminal edge strand and showed significant motional changes upon addition of LptA,33 exhibits no change in motion upon increase in LptC concentration (Supporting Information, Fig. S1B). Together, our data support an N–N terminal dimer configuration and do not support N–C or C–C dimer configurations or a monomeric form of the soluble domain of LptC in solution.
Figure 3.
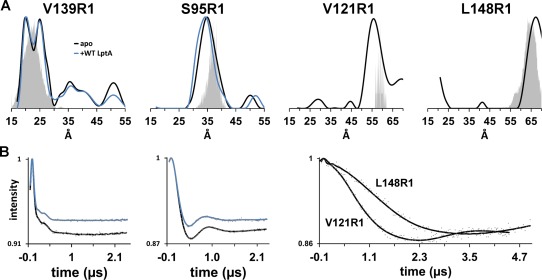
LptC dimer orientation. (A) Distance distribution plots for spin labeled LptC mutant proteins derived experimentally (black lines) and predicted using PRONOX analysis (gray area plots) based on the dimeric crystal structure (pdb:4B5420). The y‐axis represents the distance probability. The expected distance range between sites in an LptC N‐terminus to C‐terminus oligomer, similar to LptA (pdb:2R1919), is 39–41 Å. The distributions for S95R1 and V139R1 LptC in the presence of 150 μM WT LptA are also shown (blue lines). (B) The experimentally‐derived background‐corrected dipolar evolution data (gray dots) and fits for each 50 μM (S95, V139) or 100 μM (V121, L148) sample in the absence (black lines) or presence (blue lines) of 150 μM WT LptA as recorded on a Q‐band Bruker E580 pulse spectrometer.
The characterization of the LptC–LptC interaction in solution using SEC–LS, EPR spectroscopy and gel‐based experiments are important controls for the studies presented next on the stability of the LptC dimer and the LptC–LPS and LptC–LptA interactions.
Stability of the LptC dimer upon binding to LptA
To determine the effect of LptA binding on the stability of the LptC dimer, distances were measured between LptC S95R1 and LptC V139R1 in the presence of threefold excess WT LptA (Fig. 3). There is a small decrease in the modulation depth of the dipolar evolution data in the presence of LptA (Fig. 3B), yet in comparison with the data in the absence of LptA, overall there is little to no change in the distance between the protomers within the dimer. There is <1 Å decrease in the major distance population between the dimer as measured by S95R1 and no change as measured using V139R1 as the probe. The lack of changes at both the exterior β‐strand (S95) and loop (V139) sites indicates that the LptC dimer is not disrupted upon binding to LptA.
Our previous CW EPR spectroscopy data showed that the motion of Y182R1, which is on the C‐terminal edge strand that forms the protein–protein interaction interface with LptA, decreased significantly upon binding to LptA.33 The CW EPR spectra of S95R1, V121R1, and V139R1 LptC show only slight changes in R1 motion upon addition of 8.5‐fold excess WT LptA (Supporting Information, Fig. S2). These slight changes in motion are due to slight rearrangements within the protein structure and not due to a change in the tumbling rate of the LptC dimer upon binding to LptA, as indicated by the lack of changes associated with the addition of 30% Ficoll (Supporting Information, Fig. S2). Together, these data show that only slight conformational changes occur at these sites in LptC due to the binding of LptA and that the LptC protein as a whole likely undergoes minimal to no overall changes as a result of docking to LptA. Further, M24R1, located on the very N‐terminus of soluble LptC, shows no change in motion upon addition of WT LptA (Supporting Information, Fig. S2).
LptC sites affected by LPS binding
To study the location and effect of LPS binding on LptC, 10 single cysteine mutations were introduced, with six sites facing the hypothesized LPS binding pocket and loops and four sites facing the exterior surface or in unstructured regions of LptC (Fig. 1). Each single cysteine protein was purified and spin labeled at the unique cysteine to form the R1 side chain and monitored for R1 mobility changes due to the presence of exogenous LPS.
Samples studied by EPR spectroscopy contained 2 µM purified LptC protein to enable a high excess of LPS be included in the samples for the binding experiments. The mobility of each R1 at 2 µM (black) LptC in the absence of LPS is shown in Figure 4.
Figure 4.
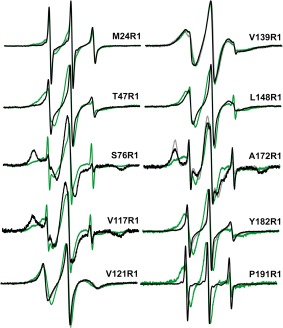
X‐band CW EPR spectra of 2 µM LptC in the absence and presence of 198 µM LPS (black and green, respectively), or 30% Ficoll (gray) for selected representative sites (M24R1, V121R1, V139R1, A172R1, Y182R1). Spectra are 100 G wide and normalized to the same center line height.
The spectra of the R1 side chain at positions S76, V117, and A172 on LptC show large populations of very slow motion in the apo state (Fig. 4). Spin label side‐chain motions are influenced by their tertiary and quaternary environment, and these sites show restricted movement of the R1 side chain likely due to tertiary interactions with neighboring side chains within the interior of LptC. In contrast, R1 at M24, T47, V121, L148, Y182, and P191 is moving rapidly, indicative of the relatively unhindered movement of the side chain. The motion is especially rapid at the terminal sites M24R1 and P191R1, consistent with their unresolved locations within the crystal structures (pdb:3MY2;12 pdb:4B5420). The spectrum of V139R1 shows intermediate motion of the label, suggesting this loop site is in a somewhat structured environment yet still relatively mobile.
To characterize the effect of LPS binding on LptC, 198 µM LPS was added to 2 µM singly labeled LptC protein samples. Obvious motional changes were observed at every site studied with the exception of loop site V139. For sites M24, T47, V121, L148, Y182, and P191, the motion of R1 became more restricted upon the addition of excess exogenous LPS (Fig. 4). Each of these sites is located outside of the expected LPS binding pocket (Supporting Information, Fig. S3). In contrast, and similar to the effect of LPS on LptA,30 the sites showing an increase in the mobility of R1 (S76, V117, A172) face the LPS binding pocket (Supporting Information, Fig. S3). This indicates that tertiary interactions are relieved and thus suggests that the protein may open to accommodate LPS binding to the interior pocket.
Next, spectral deconvolution was used to take advantage of the motional changes to quantify the population of LptC proteins affected by the addition of 198 µM LPS. Under conditions such as these, where there is an equilibrium between the ligand‐bound and unbound populations, a superposition of the two resulting spectra is observed. These two populations can be separated and quantified by spectral subtraction (e.g., 31, 33, 34, 35, 36). For the LptC sites studied, >50% of the protein population was affected for each mutant protein, with most of the proteins revealing >75% of the population affected by LPS. To further characterize the LptC–LPS interaction, six of the spin labeled LptC mutants were analyzed with various LPS concentrations to generate data for LPS binding curves (Fig. 5). The data points were generated through analysis of the deconvoluted spectra to obtain the percent of proteins affected by LPS and were fit to a single site ligand binding function. Dissociation constants and B max values were generated for the LptC–LPS interaction. The data for three of the sites further studied (LptC V121R1, Y182R, P191R1; Fig. 1) yield dissociation constants for LPS binding in the 11–28 µM range, and the B max values were in the 92–100% range (Fig. 5 and Table 1). The B max values are highly indicative of a 1:1 ratio for the LptC:LPS complex, suggesting each LptC within the dimer binds one LPS molecule. The K d value for M24R1, the first residue of the soluble protein, is weaker at 84 µM. The weakest values calculated (137–141 µM; Table 1) were for T47R1, located in the unstructured N‐terminal domain, and A172R1, which faces the interior fold of LptC; both sites directly cross‐linked with LPS in vivo.26
Figure 5.
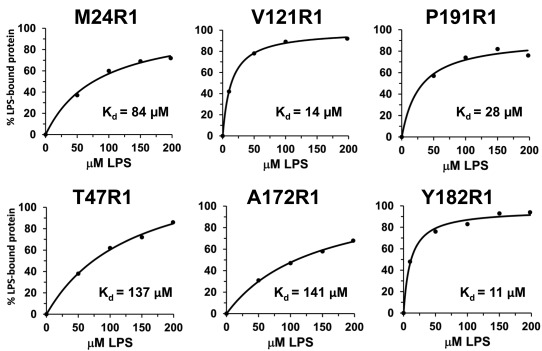
Plots of the data points generated by deconvolution of the EPR spectra in Figure 4 containing LptC and LPS with the resulting fits to a single‐site binding model. K d values are indicated and listed in Table 1 with standard errors and B max values.
Table 1.
LptC–LPS binding data summary from Figure 5 plots as determined by EPR spectroscopy
| LptC mutant | K d (µM) | B max (%) |
|---|---|---|
| M24R1 | 84 ± 17 | 106 ± 9 |
| T47R1 | 137 ± 21 | 143 ± 11 |
| V121R1 | 14 ± 1 | 100 ± 1 |
| A172R1 | 141 ± 15 | 115 ± 6 |
| Y182R1 | 11 ± 2 | 97 ± 3 |
| P191R1 | 28 ± 10 | 92 ± 7 |
Discussion
LptA forms end‐to‐end oligomers in solution, with the N‐ and C‐termini forming the interaction interfaces.25 In contrast, the crystal structure of G153R LptC suggests the N‐termini form the interaction interface for LptC.20 LS data presented here indicate that dimerization of LptC is concentration‐independent, indicating a terminal dimer is formed. Therefore, it is expected that LptC forms a stable dimer in solution. To test this, DEER spectroscopy experiments were performed to quantitate distances between LptC protomers. If LptC is a monomer in solution, no DEER distances would be observed. If LptC forms end‐to‐end oligomers, as seen for LptA, the distances between R1s are expected to be 39–41 Å for all sites. The DEER data presented here clearly show observable distances between proteins, indicating that LptC is not monomeric in solution, and support the LS data showing LptC is a dimer. Furthermore, the previous in vivo and in vitro data showing that the C‐terminal edge strand of LptC interacts with LptA suggest that this edge is unlikely to form the dimer interface and compete with LptA binding. Both the experimental DEER data presented here and the G153R LptC crystal structure support the N–N terminal dimer configuration. Therefore, despite having strikingly similar soluble domain structures, LptC and LptA do not have similar oligomerization properties.
DEER spectroscopy was also utilized to study the effects of LptA on the LptC dimer. Given the K d value of 15 µM for the LptA–LptC interaction,33 it is expected that 88% of the 50 µM LptC proteins have LptA bound in the presence of 150 µM WT LptA. This should be sufficient to disrupt the dimers and nearly eliminate the number of spins contributing to the distances observed in the dipolar evolution data if there is an LptA‐induced effect on the LptC dimers. Because there is a small (16–24%) reduction in the modulation depth of the dipolar evolution data for both S95R1 and V139R1 in the presence of WT LptA, it is possible that a small population of the LptC dimers separate into monomers. Because there was no change in the distance distributions, it is concluded that LptA binding does not change the conformation of the LptC dimer and the overall data indicate binding does not appreciably disrupt the LptC dimer in vitro. This is similar to our high pressure studies carried out on LptC using S95R1 showing that the application of pressure up to 2 kbar disrupts approximately half of the LptC dimer population yet the conformation of the remaining dimers is unchanged.31 It is possible that LptC dimerization is necessary for stability in solution when lacking the N‐terminal transmembrane helix and in the absence of the LptFGB2 complex. With the recent crystal structure of the LptFGB2 complex showing two small domains in the periplasm that mimic the structure of LptC, LptA, and the soluble N‐terminal domain of LptD,15 the N‐terminal edge of monomeric LptC may interact with these domains in vivo instead of with another LptC protomer.
The entire LptC protein is affected by LPS binding (Supporting Information, Fig. S3). The EPR spectra show that the N‐terminal, C‐terminal, interior pocket‐facing, and external‐facing R1 sites on LptC all show motional changes (Fig. 4), suggesting a significant rearrangement of the tertiary interactions within the overall protein fold. As observed for LptA,30 the mobility of R1 increases upon LPS binding at the sites facing the putative LPS binding pocket, supporting the hypothesis that both the LptA and LptC protein folds open upon binding to LPS. R1 contacts with the acyl chains are expected to be less restricting than tertiary contacts, which is consistent with both the hypotheses that the protein fold opens to relieve tertiary interactions and that the acyl chains of LPS bind within the hydrophobic interior pockets of LptC and LptA.
The addition of 30% Ficoll to the protein solution does not appreciably affect the motion of R1 (Fig. 4 and Supporting Information, Fig. S2); therefore, the changes observed by EPR spectroscopy are due to changes in the local side chain motion and not due to a shift in the tumbling of LptC upon binding of the large LPS moiety or LptA.
Even the external‐facing site L148R1 shows changes in motion upon LPS binding. This was also observed for LptA30 and is likely due to local rearrangements in packing in response to the opening of the protein fold, or possibly due to the O‐antigen wrapping around the protein, especially given that none of the exterior‐facing sites in the in vivo study2 cross‐linked with LPS.
Each of the LptC sites shown to cross‐link with LPS in vivo, T47, F78, A172, and Y182,26 were included in this study. A cysteine substitution at each of these sites was tolerated and the mutant proteins expressed. The CW EPR data for T47R1, A172R1, and Y182R1 (Fig. 4 and Table 1) support the in vivo findings that these sites are directly affected by LPS binding. The LptC protein containing F78C exhibited poor labeling efficiency at the introduced cysteine due to the formation of disulfide‐linked dimers in the purified protein, and exhibits an overall fold representative of an α‐helical structure based on circular dichroism (CD) spectroscopy (Supporting Information, Fig. S4). As expected, WT and Y182R1 LptC each exhibit a CD spectrum indicative of predominantly β‐sheet structure, similar to LptA33. Given the weaker Kd values obtained for T47R1 and A172R1 LptC proteins (Fig. 5, Table 1), these spin labeled sites are less responsive to LPS binding than other spin labeled sites studied on the protein. It is possible that the cysteine substitution and/or the spin label interferes with LPS binding at these sites. In contrast, nearby Y182R1 has proven to be an excellent reporter of LptA33 and LPS binding (this work) and appears to be largely unaffected by the substitution.
The B max values for all sites studied in LptC were close to 100%, suggesting a 1:1 ratio for the LptC:LPS complex. This is consistent with the ratio observed for LptA30 and with the expected 25 Å width of the acyl chains of one LPS molecule fitting within the approximately 34 Å wide interior pocket of an LptC protomer. Our data using EPR spectroscopy indicate the dissociation constant for the spin labeled LptC–LPS interaction is as low as 11 µM. Somewhat higher apparent dissociation constants of 28–71 µM for the LptC:LOS interaction were previously calculated using fluorescence techniques.29 It is possible the differences arise from the use of LOS vs LPS. The relatively weak dissociation constants now obtained by two independent methods for the LptC–LPS interaction likely have functional significance. The LPS–Lpt protein interaction is intended to be transient such that LPS can readily move from protein to protein along the protein bridge formed in vivo.
The strongest K ds for the LptC–LPS interaction using EPR spectroscopy were calculated to be in the 11–28 µM range, remarkably similar to the 7–35 µM range determined for spin labeled LptA.30 One predicted mechanism for LPS transfer between proteins is that different affinities for LPS promote the transfer of the lipid from LptC to LptA. Our combined results suggest an affinity differential is not likely the main driving factor in LPS transfer from LptC to LptA.
Conclusions
The soluble domain of LptC forms a stable, concentration‐independent N‐terminal dimer in solution that is not readily disrupted by LptA binding. Each LptC protomer can bind one LPS molecule, and the entire protein, not only the core of the folded β‐sheet but also the unstructured N‐terminal tail, the C‐terminal tail, and the exterior of the protein, are affected by LPS binding.
Materials and Methods
Protein expression and purification
Single cysteine mutations were introduced into the LptC soluble domain (amino acids 24–191) using High Fidelity PCR EcoDry Premix (Clontech, Mountain View, CA) and verified by sequencing (Retrogen, San Diego, CA) as described previously.25, 33 LptC protein was expressed in E. coli BL21(DE3) cells from a pET28b (Novagen, EMD Millipore, Billerica, MA) vector with an N‐terminal 6xHis tag. Purified protein was spin labeled at the introduced cysteine using a 50‐fold excess of the sulfhydryl‐specific spin probe, 2,2,5,5‐tetramethylpyrroline‐3‐yl‐methanethiosulfonate spin label (Toronto Research Chemicals, New York, ON) to generate the R1 side chain prior to eluting from the cobalt resin (Clontech, Mountain View, CA), as described previously.25, 33 Protein was concentrated using Microcon YM‐10 centrifugal concentrators, and concentrations were determined using the Thermo Scientific Pierce BCA Protein Assay Kit (Rockford, IL) with lysozyme (14 kDa) as the protein standard. LPS from E. coli O111:B4 was obtained from List Biological Laboratories, Inc. (Campbell, CA) and resuspended in 50 mM NaPO4, 300 mM NaCl, pH 7 buffer at its solubility limit of 200 µM.
Size exclusion chromatography multiangle laser light scattering (SEC‐LS)
Purified WT LptC protein was analyzed by size exclusion chromatography multi‐angle laser light scattering at the Keck Biotechnology Resource Laboratory at Yale University (http://medicine.yale.edu/keck/biophysics/index.aspx).37, 38 Two different volumes of a single stock solution of WT LptC were filtered and passed over a Pharmacia Superdex 200 HR10/30 (GE Healthcare Bio‐Sciences, Piscataway, NJ) size exclusion column equilibrated with 20 mM HEPES, pH7.4, 150 mM NaCl, 0.01% azide buffer immediately prior to detection by a DAWN‐EOS light detector (Wyatt Technologies, Santa Barbara, CA). The average molecular weight of LptC in the major peak of each injection was calculated using ASTRA.
Cross‐linking analysis
Purified LptC Q65C protein was incubated with a 50‐fold molar excess of BMOE (bis‐maleimidoethane; 8 Å spacer) or DTME (dithiobismaleimidoethane; 13 Å spacer) (Pierce Thermo Scientific [now ThermoFisher Scientific Life Technologies Corporation, Grand Island, NY]) at room temperature for 3 h. The protein samples containing the cross‐linker, along with apo protein and protein in the presence of 2.5 mM β‐mercaptoethanol (β‐ME), were separated by 12% SDS‐PAGE (Bio‐Rad, Hercules, CA) and visualized using a Coomassie blue stain.
EPR spectroscopy
Continuous wave EPR spectroscopy was carried out at room temperature on a Bruker E500 using a Bruker ER4122 SHQE‐W1 cavity, a 42 s scan time, and a 1.5 G modulation amplitude under non‐saturating power. Spin‐labeled protein samples (2 µM) were contained in AquaStar tubing developed at the National Biomedical EPR Center.39
DEER data were collected using a Q‐band Bruker E580 EPR spectrometer equipped with an overcoupled Bruker EN5107D2 resonator at 80K. Samples were flash frozen in a dry ice and acetone mixture and contained 20% deuterated glycerol as a cryoprotectant. The dipolar evolution data were phase and 3D background corrected using the LongDistances software program40 written by C. Altenbach (University of California‐Los Angeles, CA) and freely available at http://www.biochemistry.ucla.edu/biochem/Faculty/Hubbell/. The experimental distance distributions were determined by fitting the corrected dipolar evolution data using the model‐free algorithms included in the LongDistances program. The x axes of the distance distribution plots reflect the reliable distance limits for each dataset; the upper limit (d) was determined according to the maximum data collection time (t) for each experiment using the equation d ≈ 5(t/2)1/3.41
The predicted distance distributions were determined using the PRONOX program (http://rockscluster.hsc.usc.edu/research/software/pronox/pronox.html),42 which provides all possible distances between the two spin labels attached to the studied cysteine sites in the LptC crystal structure (pdb:4B5420) based on an experimentally derived library of allowed rotameric configurations of R1.
The multiple component spectra recorded in the presence of LPS were deconvoluted to obtain the respective LPS‐bound spectra through spectral subtraction of the corresponding apo spectrum. The percent of protein affected by LPS binding for the CW spectral data was determined using spectral subtraction methods. The corresponding apo spectrum was manually subtracted from each composite spectrum to obtain the LPS‐bound spectrum. The double integration values of the resulting spectra (which equate the number of spins affected by the presence of LPS) were compared to the double integration value of each composite spectrum (i.e., the number of total spins in the sample) to obtain the percentage of proteins affected by LPS binding.
Circular dichroism spectroscopy
CD spectra were recorded on a Jasco J‐710 spectropolarimeter at room temperature in a standard 0.1 cm pathlength cuvette using a 0.2 nm resolution and a 0.5 s time constant. Spectra were signal averaged 10 times. Purified LptC proteins were at a concentration of 5 μM in 50 mM NaPO4, pH 7.0 buffer containing up to 3 mM NaCl.
Supporting information
Supporting Information
Acknowledgment
The authors thank Tanner Lundquist, Matthew Fischer, and Jacqueline Merten for laboratory assistance, and Jimmy Feix for critically reading the manuscript.
Statement of importance The studies described here use site‐directed spin labeling EPR spectroscopy to calculate dissociation constants for the LptC–LPS interaction in vitro and to characterize the dimer conformation in solution. This work contributes to the understanding of LPS transport in Gram‐negative bacteria, an essential process with high potential for antibiotic intervention.
This work was supported by National Institutes of Health grants GM108817 (to CSK), RR022422 and OD011937 (DEER instrumentation), EB001980 (National Biomedical EPR Center at MCW), and RR023748 (Keck Biotechnology Resource Laboratory SEC‐LS/UV/RI instrumentation at Yale University).
REFERENCES
- 1. Nikaido H (2003) Molecular basis of bacterial outer membrane permeability revisited. Microbiol Mol Biol Rev 67:593–656. [DOI] [PMC free article] [PubMed] [Google Scholar]
- 2. Raetz CR (1990) Biochemistry of endotoxins. Annu Rev Biochem 59:129–170. [DOI] [PubMed] [Google Scholar]
- 3. Karow M, Georgopoulos C (1993) The essential Escherichia coli msbA gene, a multicopy suppressor of null mutations in the htrB gene, is related to the universally conserved family of ATP‐dependent translocators. Mol Microbiol 7:69–79. [DOI] [PubMed] [Google Scholar]
- 4. Raetz CR, Whitfield C (2002) Lipopolysaccharide endotoxins. Annu Rev Biochem 71:635–700. [DOI] [PMC free article] [PubMed] [Google Scholar]
- 5. Zhou Z, White KA, Polissi A, Georgopoulos C, Raetz CR (1998) Function of Escherichia coli MsbA, an essential ABC family transporter, in lipid A and phospholipid biosynthesis. J Biol Chem 273:12466–12475. [DOI] [PubMed] [Google Scholar]
- 6. Bos MP, Tefsen B, Geurtsen J, Tommassen J (2004) Identification of an outer membrane protein required for the transport of lipopolysaccharide to the bacterial cell surface. Proc Natl Acad Sci USA 101:9417–9422. [DOI] [PMC free article] [PubMed] [Google Scholar]
- 7. Chng SS, Ruiz N, Chimalakonda G, Silhavy TJ, Kahne D (2010) Characterization of the two‐protein complex in Escherichia coli responsible for lipopolysaccharide assembly at the outer membrane. Proc Natl Acad Sci USA 107:5363–5368. [DOI] [PMC free article] [PubMed] [Google Scholar]
- 8. Freinkman E, Chng SS, Kahne D (2011) The complex that inserts lipopolysaccharide into the bacterial outer membrane forms a two‐protein plug‐and‐barrel. Proc Natl Acad Sci USA 108:2486–2491. [DOI] [PMC free article] [PubMed] [Google Scholar]
- 9. Narita S, Tokuda H (2009) Biochemical characterization of an ABC transporter LptBFGC complex required for the outer membrane sorting of lipopolysaccharides. FEBS Lett 583:2160–2164. [DOI] [PubMed] [Google Scholar]
- 10. Ruiz N, Gronenberg LS, Kahne D, Silhavy TJ (2008) Identification of two inner‐membrane proteins required for the transport of lipopolysaccharide to the outer membrane of Escherichia coli . Proc Natl Acad Sci USA 105:5537–5542. [DOI] [PMC free article] [PubMed] [Google Scholar]
- 11. Ruiz N, Kahne D, Silhavy TJ (2009) Transport of lipopolysaccharide across the cell envelope: the long road of discovery. Nat Rev Microbiol 7:677–683. [DOI] [PMC free article] [PubMed] [Google Scholar]
- 12. Sperandeo P, Cescutti R, Villa R, Di Benedetto C, Candia D, Deho G, Polissi A (2007) Characterization of lptA and lptB, two essential genes implicated in lipopolysaccharide transport to the outer membrane of Escherichia coli . J Bacteriol 189:244–253. [DOI] [PMC free article] [PubMed] [Google Scholar]
- 13. Sperandeo P, Lau FK, Carpentieri A, De Castro C, Molinaro A, Deho G, Silhavy TJ, Polissi A (2008) Functional analysis of the protein machinery required for transport of lipopolysaccharide to the outer membrane of Escherichia coli . J Bacteriol 190:4460–4469. [DOI] [PMC free article] [PubMed] [Google Scholar]
- 14. Wu T, McCandlish AC, Gronenberg LS, Chng SS, Silhavy TJ, Kahne D (2006) Identification of a protein complex that assembles lipopolysaccharide in the outer membrane of Escherichia coli . Proc Natl Acad Sci USA 103:11754–11759. [DOI] [PMC free article] [PubMed] [Google Scholar]
- 15. Luo Q, Yang X, Yu S, Shi H, Wang K, Xiao L, Zhu G, Sun C, Li T, Li D, Zhang X, Zhou M, Huang Y (2017) Structural basis for lipopolysaccharide extraction by ABC transporter LptB2FG. Nat Struct Mol Biol 24:469–474. [DOI] [PubMed] [Google Scholar]
- 16. Dong H, Xiang Q, Gu Y, Wang Z, Paterson NG, Stansfeld PJ, He C, Zhang Y, Wang W, Dong C (2014) Structural basis for outer membrane lipopolysaccharide insertion. Nature 511:52–56. [DOI] [PubMed] [Google Scholar]
- 17. Qiao S, Luo Q, Zhao Y, Zhang XC, Huang Y (2014) Structural basis for lipopolysaccharide insertion in the bacterial outer membrane. Nature 511:108–111. [DOI] [PubMed] [Google Scholar]
- 18. Tran AX, Dong C, Whitfield C (2010) Structure and functional analysis of LptC, a conserved membrane protein involved in the lipopolysaccharide export pathway in Escherichia coli . J Biol Chem 285:33529–33539. [DOI] [PMC free article] [PubMed] [Google Scholar]
- 19. Suits MD, Sperandeo P, Deho G, Polissi A, Jia Z (2008) Novel structure of the conserved gram‐negative lipopolysaccharide transport protein A and mutagenesis analysis. J Mol Biol 380:476–488. [DOI] [PubMed] [Google Scholar]
- 20. Villa R, Martorana AM, Okuda S, Gourlay LJ, Nardini M, Sperandeo P, Deho G, Bolognesi M, Kahne D, Polissi A (2013) The Escherichia coli Lpt transenvelope protein complex for lipopolysaccharide export is assembled via conserved structurally homologous domains. J Bacteriol 195:1100–1108. [DOI] [PMC free article] [PubMed] [Google Scholar]
- 21. Freinkman E, Okuda S, Ruiz N, Kahne D (2012) Regulated assembly of the transenvelope protein complex required for lipopolysaccharide export. Biochemistry 51:4800–4806. [DOI] [PMC free article] [PubMed] [Google Scholar]
- 22. Gu Y, Stansfeld PJ, Zeng Y, Dong H, Wang W, Dong C (2015) Lipopolysaccharide is inserted into the outer membrane through an intramembrane hole, a lumen gate, and the lateral opening of LptD. Structure 23:496–504. [DOI] [PMC free article] [PubMed] [Google Scholar]
- 23. Li X, Gu Y, Dong H, Wang W, Dong C (2015) Trapped lipopolysaccharide and LptD intermediates reveal lipopolysaccharide translocation steps across the Escherichia coli outer membrane. Sci Rep 5:11883. [DOI] [PMC free article] [PubMed] [Google Scholar]
- 24. Martorana AM, Benedet M, Maccagni EA, Sperandeo P, Villa R, Deho G, Polissi A (2016) Functional interaction between the cytoplasmic ABC protein LptB and the inner membrane LptC protein, components of the lipopolysaccharide transport machinery in Escherichia coli . J Bacteriol 198:2192–2203. [DOI] [PMC free article] [PubMed] [Google Scholar]
- 25. Merten JA, Schultz KM, Klug CS (2012) Concentration‐dependent oligomerization and oligomeric arrangement of LptA. Protein Sci 21:211–218. [DOI] [PMC free article] [PubMed] [Google Scholar]
- 26. Okuda S, Freinkman E, Kahne D (2012) Cytoplasmic ATP hydrolysis powers transport of lipopolysaccharide across the periplasm in E. coli . Science 338:1214–1217. [DOI] [PMC free article] [PubMed] [Google Scholar]
- 27. Benedet M, Falchi FA, Puccio S, Di Benedetto C, Peano C, Polissi A, Deho G (2016) The lack of the essential LptC protein in the trans‐envelope lipopolysaccharide transport machine is circumvented by suppressor mutations in LptF, an inner membrane component of the Escherichia coli transporter. PLoS One 11:e0161354. [DOI] [PMC free article] [PubMed] [Google Scholar]
- 28. Sperandeo P, Villa R, Martorana AM, Samalikova M, Grandori R, Deho G, Polissi A (2011) New insights into the Lpt machinery for lipopolysaccharide transport to the cell surface: LptA‐LptC interaction and LptA stability as sensors of a properly assembled transenvelope complex. J Bacteriol 193:1042–1053. [DOI] [PMC free article] [PubMed] [Google Scholar]
- 29. Sestito SE, Sperandeo P, Santambrogio C, Ciaramelli C, Calabrese V, Rovati GE, Zambelloni L, Grandori R, Polissi A, Peri F (2014) Functional characterization of E. coli LptC: interaction with LPS and a synthetic ligand. ChemBioChem 15:734–742. [DOI] [PubMed] [Google Scholar]
- 30. Schultz KM, Lundquist TJ, Klug CS (2017) Lipopolysaccharide binding to the periplasmic protein LptA. Protein Sci 26:1517–1523. [DOI] [PMC free article] [PubMed] [Google Scholar]
- 31. Schultz KM, Klug CS (2017) High‐pressure EPR spectroscopy studies of the E. coli lipopolysaccharide transport proteins LptA and LptC. Appl Magn Reson DOI: 10.1007/s00723-017-0948-z [DOI] [PMC free article] [PubMed] [Google Scholar]
- 32. Klug CS, Feix JB. Methods and applications of site‐directed spin labeling EPR spectroscopy In: Correia JJ, Detrich HW, Eds. (2008) Biophysical tools for biologists, volume one: in vitro techniques. Oxford, UK: Academic Press, pp. 617–658. [DOI] [PubMed] [Google Scholar]
- 33. Schultz KM, Feix JB, Klug CS (2013) Disruption of LptA oligomerization and affinity of the LptA‐LptC interaction. Protein Sci 22:1639–1645. [DOI] [PMC free article] [PubMed] [Google Scholar]
- 34. McCoy J, Hubbell WL (2011) High‐pressure EPR reveals conformational equilibria and volumetric properties of spin‐labeled proteins. Proc Natl Acad Sci 108:1331–1336. [DOI] [PMC free article] [PubMed] [Google Scholar]
- 35. Fanucci GE, Cadieux N, Kadner RJ, Cafiso DS (2003) Competing ligands stabilize alternate conformations of the energy coupling motif of a TonB‐dependent outer membrane transporter. Proc Natl Acad Sci USA 100:11382–11387. [DOI] [PMC free article] [PubMed] [Google Scholar]
- 36. Klug CS, Su W, Liu J, Klebba PE, Feix JB (1995) Denaturant unfolding of the ferric enterobactin receptor and ligand‐induced stabilization studied by site‐directed spin labeling. Biochemistry 34:14230–14236. [DOI] [PubMed] [Google Scholar]
- 37. Folta‐Stogniew E (2006) Oligomeric states of proteins determined by size‐exclusion chromatography coupled with light scattering, absorbance, and refractive index detectors. Methods Mol Biol 328:97–112. [DOI] [PubMed] [Google Scholar]
- 38. Folta‐Stogniew E, Williams KR (1999) Determination of molecular masses of proteins in solution: implementation of an HPLC size exclusion chromatography and laser light scattering service in a core laboratory. J Biomol Tech 10:51–63. [PMC free article] [PubMed] [Google Scholar]
- 39. Sidabras JW, Mett RR, Hyde JS (2017) Extruded dielectric sample tubes of complex cross section for EPR signal enhancement of aqueous samples. J Magn Reson 277:45–51. [DOI] [PMC free article] [PubMed] [Google Scholar]
- 40. Toledo Warshaviak D, Khramtsov VV, Cascio D, Altenbach C, Hubbell WL (2013) Structure and dynamics of an imidazoline nitroxide side chain with strongly hindered internal motion in proteins. J Magn Reson 232:53–61. [DOI] [PMC free article] [PubMed] [Google Scholar]
- 41. Jeschke G (2012) DEER distance measurements on proteins. Annu Rev Phys Chem 63:419–446. [DOI] [PubMed] [Google Scholar]
- 42. Hatmal MM, Li Y, Hegde BG, Hegde PB, Jao CC, Langen R, Haworth IS (2012) Computer modeling of nitroxide spin labels on proteins. Biopolymers 97:35–44. [DOI] [PMC free article] [PubMed] [Google Scholar]
- 43. Magalhaes PO, Lopes AM, Mazzola PG, Rangel‐Yagui C, Penna TC, Pessoa A Jr. (2007) Methods of endotoxin removal from biological preparations: a review. J Pharm Pharm Sci 10:388–404. [PubMed] [Google Scholar]
Associated Data
This section collects any data citations, data availability statements, or supplementary materials included in this article.
Supplementary Materials
Supporting Information