Abstract
Detection of multiple relaxation pools using MRI is useful in a number of neuro-pathologies including multiple sclerosis (MS), Alzheimer’s, and stroke. In this study we evaluate the feasibility of using T1ρ imaging for the detection of bi-exponential decays in the human brain. A prospective T1ρ imaging study was performed on model relaxation phantoms (eggs) and 7 healthy volunteers. The data was fitted using a single pool and a 2-pool model to estimate mono- and bi-exponential T1ρ maps, respectively. Bi-exponential decays were identified in the gray matter (GM) and white matter (WM) of the brain with 40.5% of GM, and 65.1% of WM pixels showing two T1ρ relaxation pools (significance level P < 0.05). Detection of T1ρ based bi-exponential decays in the brain provides complimentary information to T2 based contrast regarding the in vivo micro-environment in the brain.
Introduction
Detection and characterization of multiple components of relaxation (MCR) in the brain is useful, particularly in the assessment of myelin content, in understanding normal brain development1 and in neuro-pathologies. A number of MCR based studies using T2 relaxation have demonstrated its utility in assessing white matter pathology including multiple sclerosis (MS)2, Alzheimer’s3, and stroke4. MRI techniques such as multi-echo T22, 3D gradient and spin echo (GRASE)5, and multi-component driven equilibrium single pulse observation of T1 and T2 (mcDESPOT)6 have been developed to use T2 to assess myelin.
T1ρ refers to the spin lattice relaxation time constant in the rotating magnetic field, and measures the transverse magnetization decay in the presence of a spin-lock radiofrequency (RF) field7. While the processes that give rise to T1 and T2 contrast related to molecular rotation are in the Larmor time-scale, with frequencies on the order of megahertz, the T1ρ contrast mechanism is sensitive to a lower frequency (kilohertz) range, and picks up signal from lower energy interactions related to chemical exchange between extracellular water and complex macromolecules8. T1ρ imaging has been extensively used to quantify proteoglycan content in articular cartilage9–11, and is a promising approach to characterize cartilage degradation. In the brain, most studies have used mono-exponential T1ρ imaging to evaluate a number of neuro-pathologies12,13. While bi-exponential decays using T1ρ have been detected in cartilage14,15 and muscle16, we did not find published reports of T1ρ bi-exponential decay in the brain.
In this paper, we demonstrate the feasibility of T1ρ imaging to estimate bi-exponential relaxation mapping of whole brain. By using phantom experiments using avian eggs, and healthy volunteers we show that bi-exponential decays can be detected in the human brain in vivo.
Results
Model Phantoms
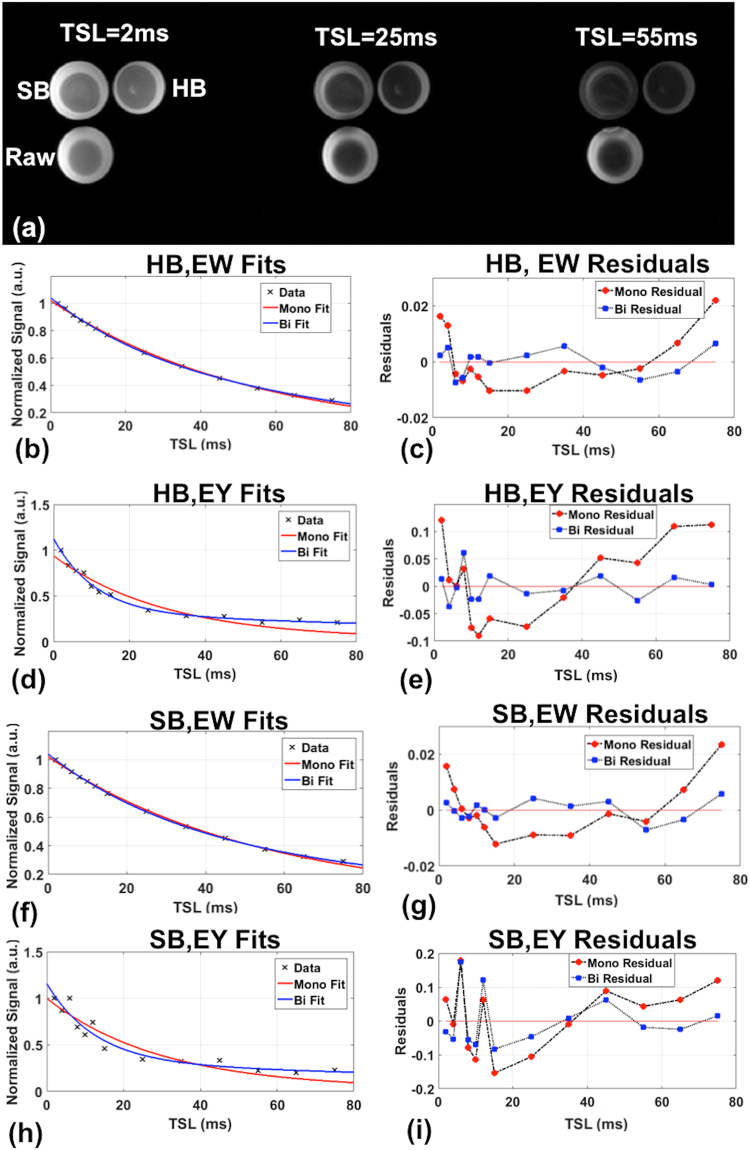
Figure 1 and Table 1 show results from the egg experiments. Figure 1(a) shows representative images at selected TSL values of the hard boiled (HB), soft-boiled (SB) and raw eggs. Bi-exponential decays (short relaxation time, T1ρs and long relaxation time, T1ρl) were detected in both the egg white and yolk of the HB, SB and raw eggs. For the hard-boiled egg whites, although the mono-exponential and bi-exponential fits seem good fits to the data (Fig. 1(b)), the residuals (Fig. 1(c)) clearly demonstrate that the bi-exponential is a better fit. For the hard-boiled egg yolk, bi-exponential decays are clearly better fits to the data (Fig. 1(d)) and with lower residuals (Fig. 1(e)). Results in soft-boiled egg-white and egg yolks follow a similar trend as the hard-boiled counterparts (Fig. 1 (f–i)). In the raw egg, the mono-exponential T1ρ relaxation time for the yolk had similar values to HB, and SB cases, but the egg white showed significantly longer mono-exponential T1ρ relaxation times compared to SB or HB egg-white (Table 1). The egg-white T1ρs and T1ρl reduced 40.6% and 21.2% from soft-boiled to hard-boiled respectively, while the yolk underwent a reduction of 15.2% and 11.6% for the state change from soft-boiled to hard-boiled. Relaxation times, fractions and goodness of fits (adjusted R2) for the egg-white and yolk for the HB, SB and raw eggs are reported in Table 1.
Figure 1.
Sample egg images of HB, SB and raw egg at three representative TSL values (a). Signal decays with mono- and bi-exponential fits in the hard-boiled egg white (b), yolk (d), their residuals (c,e) and soft-boiled egg white (f), yolk (h) and their residuals (g,i).
Table 1.
Egg experiments fitting results (N = 2) and volunteer human brain fitting results (N = 7). EW-eggwhite, EY- eggyolk, HB-hard-boiled, SB-soft-boiled, GM-Gray Matter, WM-white matter, GM+WM- gray and white matter.
| ROI | Mono-Exponential | Bi-exponential | ||||
|---|---|---|---|---|---|---|
| T1ρm (ms) | T1ρs (ms) | T1ρl(ms) | As(%) | Al(%) | ||
| EGGS | ||||||
| EW HB | Mean ± SD | 50.66 ± 9.93 | 14.87 ± 11.68 | 82.80 ± 41.50 | 39.47 ± 20.96 | 60.53 ± 20.96 |
| R2 | 0.99069 | 0.99187 | 0.99187 | — | — | |
| EW SB | Mean ± SD | 61.29 ± 15.23 | 25.05 ± 15.73 | 105.17 ± 46.47 | 39.84 ± 26.26 | 60.16 ± 26.26 |
| R2 | 0.91661 | 0.97811 | 0.97811 | — | — | |
| EWRaw | Mean ± SD | 140.11±14.68 | 6.14 ± 5.08 | 230.72 ± 55.94 | 21.34 ± 16.88 | 78.62 ± 16.88 |
| R2 | 0.8883 | 0.8925 | 0.8925 | — | — | |
| EY HB | Mean ± SD | 31.22 ± 3.32 | 13.46 ± 2.52 | 140.53 ± 30.75 | 71.88 ± 5.43 | 28.12 ± 5.43 |
| R2 | 0.94932 | 0.97745 | 0.97745 | — | — | |
| EY SB | Mean ± SD | 36.00 ± 8.06 | 15.88 ± 4.74 | 158.96 ± 10.93 | 70.75 ± 9.19 | 29.25 ± 9.19 |
| R2 | 0.77214 | 0.97847 | 0.97847 | — | — | |
| EY Raw | Mean ± SD | 31.14 ± 8.86 | 8.3 ± 0.54 | 299.86 ± 11.49 | 69.38 ± 6.65 | 30.62 ± 6.65 |
| R2 | 0.8994 | 0.9008 | 0.9008 | — | — | |
| IN- VIVO | ||||||
| GM | Mean ± SD | 72.25 ± 3.39 | 10.41 ± 6.89 | 82.87 ± 17.60 | 14.74 ± 4.96 | 85.26 ± 4.96 |
| 95% CI | 69.61–75.88 | 9.62–15.46 | 66.59–99.14 | 10.12–19.32 | 80.68–89.88 | |
| R2 | 0.9799 | 0.9907 | 0.9907 | — | — | |
| WM | Mean ± SD | 67.43 ± 2.33 | 10.09 ± 6.06 | 78.26 ± 13.69 | 14.39 ± 4.91 | 85.61 ± 4.91 |
| 95% CI | 65.26–69.57 | 9.00–14.98 | 65.59–90.92 | 9.85–18.94 | 81.06–90.15 | |
| R2 | 0.9918 | 0.9972 | 0.9972 | — | — | |
| GM + WM | Mean ± SD | 69.80 ± 2.62 | 10.11 ± 6.40 | 79.96 ± 15.52 | 14.55 ± 4.83 | 85.45 ± 4.83 |
| 95% CI | 67.38–72.22 | 9.43–15.04 | 65.61–94.31 | 10.08–19.02 | 80.98–89.92 | |
| R2 | 0.9857 | 0.9939 | 0.9939 | — | — | |
In Vivo Results
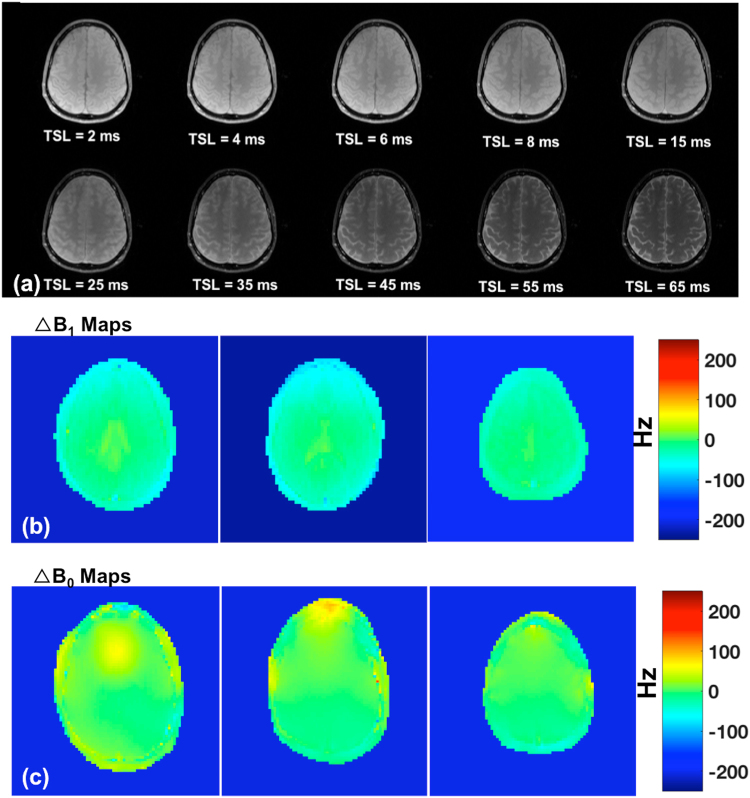
Figure 2(a) shows T1ρ images at different TSL intervals varying from 2 to 65 ms. Figure 2(b) shows the B1 field map changes (ΔB1) and Fig. 2(c) shows B0 field map changes (ΔB0) respectively. The minimum-maximum variation in B1 across the imaging sample was between −234.44 to 18.33 Hz, and the minimum to maximum variation in B0 was between −206.9 Hz to 182.8 Hz. In our T1ρ experiment we used spin-lock frequency of 500 Hz (higher than ΔB0 and ΔB1) with 180° refocusing pulse and paired self-compensated spin-lock pulses for T1ρ preparation to minimize imperfections in RF pulses.
Figure 2.
(a) Representative T1ρ weighted images of the brain acquired at ten TSL intervals (b) ΔB1 field map and (c) ΔB0 field maps.
Figure 3 shows computed T1ρ maps for GM, WM and GM+WM using mono-exponential decay (Fig. 3 (a–c)), the short relaxation component, T1ρs (Fig. 3(d–f)), and the long relaxation component, T1ρl (Fig. 3(g–h)). Table 1 summarizes the mean calculated values across the 7 volunteers. The bi-exponential fit shows that in the GM, there is a fast relaxing (T1ρs = 10.41 ± 6.89 ms) minor component (As = 14.74 ± 4.96%), while in the WM too, there is a fast relaxing (T1ρs = 10.09 ± 6.06 ms) minor component (As = 14.39 ± 4.91%). The dominant component in the GM (T1ρl = 82.87 ± 17.60 ms, Al = 85.26 ± 4.96%) and WM (T1ρl = 78.26 ± 13.69 ms, Al = 85.61 ± 4.91%) is the slow relaxing component. The results for the GM+WM fall between the individual GM and WM results. The goodness of fit measure for all cases is above 0.97, indicating an excellent fit to the data (Table 1). The results from the mono-exponential (T1ρm) fitting fall between the short and long component values of the bi-exponential fits for the GM (72.25 ± 3.39 ms) and the WM (67.43 ± 2.33 ms). The 95% confidence intervals (CI) of the T1ρ estimates are shown in Table 1. Bi-exponential decays were identified in 40.5% of GM, and 65.1% of WM pixels (with a significance level P < 0.05).
Figure 3.
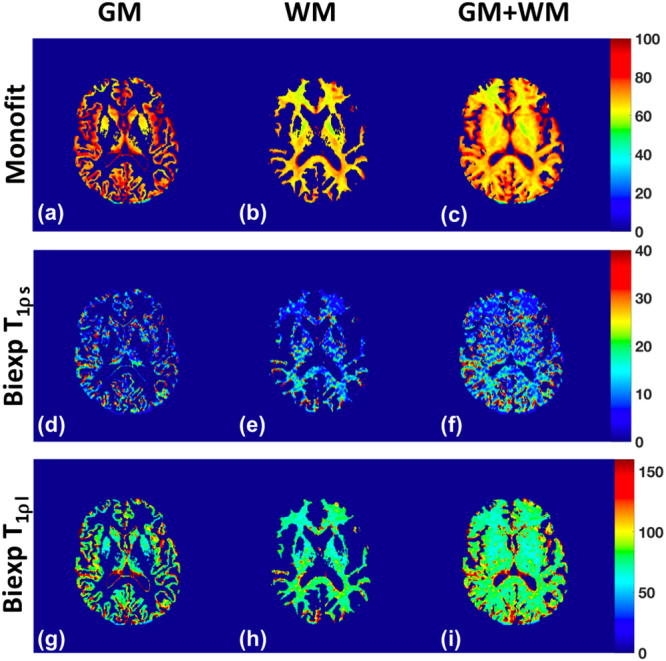
T1ρ maps of a representative brain slice using mono-exponential fit (row 1) and bi-exponential fits (T1ρs component (row 2), T1ρl component (row 3)). The T1ρ map of the gray matter is shown in figures (a), (d), and (g), the white matter in (b), (e), and (h), and gray and white matter shown together in figures (c), (f), and (h).
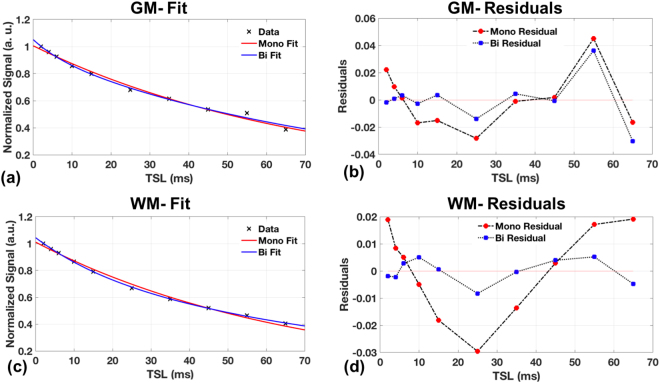
Figure 4 shows the comparison of the mono- and the bi-exponential decays from representative areas of the GM and WM. In the GM the fits seem similar, but the residuals indicate that the bi-exponential fit may be a better fit. In the WM, it is clear from the residuals that the bi-exponential are a better fit to the data. This suggests the delineation of two water pools in the WM, one possibility being the myelin bound water, and the other intra- and extra-cellular water.
Figure 4.
Signal decays from representative voxels with mono- and bi-exponential fits in the gray-matter of the brain (a), and the white matter of the brain (c) with the corresponding residuals (b,d). The WM fits and residuals clearly indicate bi-exponentials as a better fit to the data, compared to the GM.
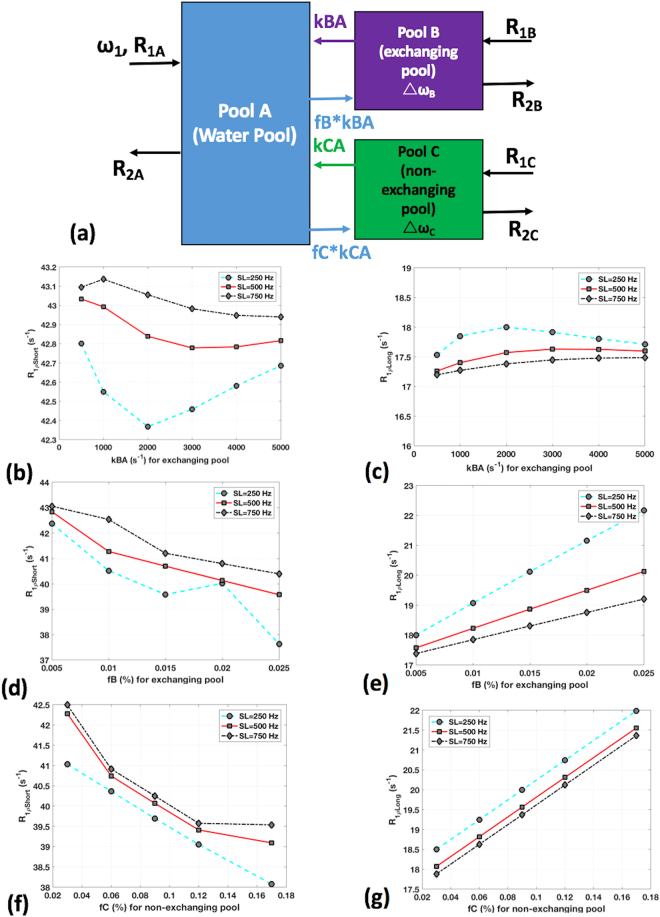
Figure 5(b–g) shows the results of Bloch-McConnell simulation. The variation of exchange rate, kBA with the rate of T1ρs relaxation (R1ρs = 1/T1ρs) and rate of T1ρl relaxation (R1ρl = 1/T1ρl) are shown in Fig. 5(b) and Fig. 5(c), respectively. Figure 5(d) and (e) shows the short and long R1ρ and its variation with the concentration of the exchanging pool. Figure 5(f) and (g) shows the short and long R1ρ estimates with the variation in concentration of non-exchanging pool. All cases shows the fitted numerical data for spin-lock frequencies of 250, 500 and 750 Hz. The behavior of kBA, fB and fC varies with the short and long R1ρ components. In the fast exchanging pool, kBA, the R1ρs varies significantly based on spin-lock power, while for the long component, R1ρl, there is little effect of exchange rates or spin lock power. Increase in the concentration of the exchanging pool, fB and the concentration of the non-exchanging pool, fC causes a linear reduction in the R1ρs component, and a linear increase in the R1ρl component.
Figure 5.
(a) shows the Bloch-McConnell simulation with a 3 pool model (water pool, exchanging pool, non-exchanging pool). R1ρs (b) and R1ρl (c) variation at different spin-lock powers with exchange rate variation in the exchanging pool, kBA, R1ρs (d) and R1ρl (e) with solute concentration variation in the exchanging pool, fB and, R1ρs (f) and R1ρl (g) with solute concentration variation in the non-exchanging pool, fC.
Discussion
In this study, we demonstrate the feasibility of measuring bi-exponential decays in the whole brain using T1ρ imaging. We tested the T1ρ MCR technique on chicken eggs, recently shown to consist of at least two relaxation components17. Additionally, the 3D T1ρ sequence allows for whole brain imaging near isotropic resolution in ~19 minutes and may be potentially useful in a clinical setting. This is the first study to our knowledge that utilizes T1ρ imaging to identify bi-exponential decays in the human brain.
In our study, T1ρs in the brain was in the range of 3.52 to 17.30 ms with a minor fast relaxing component, and a T1ρl component ranging from 65.27 to 100.47 ms with a dominant slow relaxing component. The range of TSL values used in our study was from 2–65ms for in vivo studies. Appreciable improvements in T1ρ quantification with longer TSL values in egg experiments were not noted. For in vivo studies, additional SAR limitations come into play for longer spin lock durations.
The results from the brain T1ρ bi-exponential fitting reveal a minor fast relaxing component and dominant slow relaxing water compartment, with similar relaxation fractions in the GM and WM of the brain. A previously reported study involving rats did not observe bi-exponential decays in the rat brains18, which may likely be attributed to experimental limitations. Mono-exponential T1ρ studies by Gonyea et al.19 reported a 2% difference between GM and WM in controls, while T1ρ studies by Borthakur et al.12 at 1.5 T reported a 5% difference between GM and WM. Mangia et al.20 showed a much wider difference of 20% between GM and WM in their adiabatic T1ρ studies. In our studies the T1ρl component showed a difference of 5.5% between GM and WM, T1ρs components for GM and WM were similar. It may be possible that the difference between the GM and WM estimates is reduced due magic angle effects owing to fiber orientation21.
As demonstrated by Redfield22, in the presence of a spin lock RF field, the spins will interact with different internal Hamiltonians such as chemical shift, J-coupling, chemical exchange, and dipole-dipole interactions. In general, these interactions may be classified into three main categories (a) scalar coupling (b) dipole-dipole interaction and (c) chemical exchange processes. Depending upon the tissue environment, several mechanisms may contribute in different proportions to the T1ρ relaxation. This contribution, R1ρ (=1/ T1ρ) at a spin-lock frequency f1 can be expressed as:
| 1 |
where is the dipolar relaxation due to molecular rotational processes (fluctuating dipolar fields), is the diffusion contribution, is related to the exchange processes associated with water protons and other exchangeable protons on macromolecules, and is the contribution due to residual static dipolar coupling. In the presence of a spin lock field the contributions from the fluctuating dipolar fields and diffusion become negligible and the main contributions are predominantly from processes that occur with correlation times in the range of the applied spin lock frequency i.e. from the exchange and the residual dipolar interactions. At intermediate to high exchange rates, the R1ρ may be dominated by increasing contribution from chemical exchange23,24. Moreover, the variation of R1ρ with spin-locking power (R1ρ dispersion) can be used to estimate the exchange rate of exchanging species23,24. From our simulations we note that the R1ρs component contribution increases with chemical exchange and decreases with increasing concentrations at different spin-lock powers. In the brain, chemical exchange mediated by hydroxyl (−OH), amine (−NH2), and amide (−NH) groups with bulk water may contribute to the observed short component (T1ρs). In our study, we attribute the short T1ρ component to the weighted average of different chemical exchange sites, residual dipolar interactions, restricted water protons within myelin sheets and axons, with bulk water. From numerical simulations, the long R1ρ component is unaffected by fast exchange, and R1ρl linearly increases with concentrations of exchanging and non-exchanging pools but with different slopes. The long T1ρ component is attributed to free or loosely bound intra and extra-cellular axonal water. Depending on the dominant exchanging rates and their concentration fractions, the observed MRI signal would result in multi-exponential decays.
The chief constituent of egg whites is water (90%) with smaller components consisting of a variety of proteins25. The predominant relaxation fraction of egg white is a slow relaxing component, most likely from the water component, while the smaller fraction originating from the protein content. Egg yolk on the other hand consists of water (50%), lipids (34%) and proteins (16%)25. In our study, a major fast relaxing component and a minor slow relaxing component were identified. Cooking the egg from raw to soft-boiled to hard-boiled did not significantly change relaxation fractions, but they significant reduced the relaxation times for the short and long components for the egg white and egg yolk. Mitsouras et al. performed MCR T2 studies on the egg and identified non-monoexponential decays in different parts of the egg17. In the egg white they identified similar relaxation fractions but the relaxation times varied from our estimates. In the egg yolk they identified tri-exponential decays including a short and a long component. To isolate a third intermediate lipid component they used a fat-saturation pulse. In our study, we used binomial RF pulses to excite water protons only without touching the signal from fat. The results reported closely matched our study with the short component, but with much slower relaxation times and fractions as compared to our estimates. This may be attributed to sensitivity differences between T1ρ and T2 relaxation mechanisms.
We acknowledge that this study has the following limitations: The number of human subjects used was low and homogenous in age group with a range of 23 to 33 years. Although this study with healthy human volunteers did not have motion related image artifacts that may affect T1ρ quantification, the longer acquisition time can result in bulk subject motion in patient populations which can be a potential source of error in T1ρ estimates. One possible source of error in the T1ρl values is that the longest TSL (65ms in vivo/75ms for eggs) does not reach the longest estimated T1ρl values (upto 82ms in vivo/300ms for eggs). One approach to reduce the acquisition time could be to reduce the number of TSLs to the minimum required for accurate T1ρ quantification. But the redundancy in our study offers an advantage of affording the luxury of discarding a particular TSL acquisition where data corruption from movement occurred. Another approach to reduce data acquisition time would be implementing a fast parameter mapping sequence26. Using adiabatic T1ρ preparation, it has been demonstrated that it results in increased sensitivity to chemical exchange, and insensitivity to RF field inhomogeneities27,28. This would result in increased accuracy of T1ρ estimates, with increased SAR penalties and reduced specificity resulting from a broad frequency range.
In conclusion, in this study we demonstrated, using T1ρ imaging, the identification of bi-exponential decays in the brain. The short and long T1ρ values and their fractions for the whole brain can be characterized by bi-component T1ρ analysis, which is superior to single-component analysis with reduced SSE during fitting and greater information on both macromolecular bound and free water components.
Methods
In Vivo Brain Experiments
This prospective study was approved by New York University Langone Medical Center’s institutional review board (IRB) and was HIPAA (Health Insurance Portability and Accountability Act) compliant. Seven healthy volunteers (2 male, 5 female, mean age = 27 ± 4 years) with no history of neurological disease, psychiatric disease and prior head trauma were recruited following informed consent. Whole brain 3D T1ρ images were acquired with the following parameters: spatial resolution = 0.9 × 0.9 × 2 mm3, TR = 1500ms, TE = 4 ms, flip angle = 8°, matrix size = 256 × 256, 64 slices, field of view (FOV) = 240 mm2, slice thickness = 2 mm, spin lock frequency = 500 Hz, 10 TSL values = [2, 4, 6, 10, 15, 25, 35, 45, 55, 65 ms], receiver bandwidth = 515 Hz/pixel. Acceleration factor using GRAPPA = 2 was used to reduce total imaging time to ~19 min.
In vivo B0 maps were obtained for multiple slices for 1 volunteer using gradient echo phase images at two different echo times29. Imaging parameters were: FOV = 240 × 240 mm2, matrix size = 80 × 80, TR=582 ms, TEs = 4.92 ms, 7.38 ms, FA = 60°. The phase was corrected for phase wraps, and frequency offset (ΔB0) was calculated on a pixel by pixel basis as the accumulated phase between the two echoes. In-vivo B1 maps were obtained for multiple slices with a vendor provided rapid B1 mapping technique30. Imaging parameters included: FOV = 256 × 256 mm2, matrix size = 64 × 64, TR = 2000 ms, TE = 1.83ms, FA = 90°. The ΔB1 maps were calculated as the variation from the nominal flip angle.
Avian Egg Experiments
As a phantom that mimics multi-component decays in living tissue, we took inspiration from a recent report17 and used unfertilized avian eggs to test the ability of T1ρ imaging to detect bi-exponential decays. Similar to the procedure detailed previously17, HB, SB and raw uncooked (n = 2) chicken eggs were used. HB and SB eggs were boiled in water for 15 and 5 minutes respectively. The eggs were then kept at room temperature for 24 hours before scanning.
T1ρ weighted images were acquired with 13 TSL intervals at 2, 4, 6, 8, 10, 12, 15, 25, 35, 45, 55, 65, 75 ms. The acquisition parameters were as follows: TR = 1500 ms, TE = 4 ms, flip angle = 8°, matrix size = 256 × 256, 32 slices, field of view (FOV) = 200 mm2, and slice thickness = 2 mm, spin lock frequency = 500 Hz. The images were fully sampled, and took a total acquisition time of ~50 minutes. Regions of interest (ROIs) were drawn around the egg whites and yolks.
MRI sequence and hardware
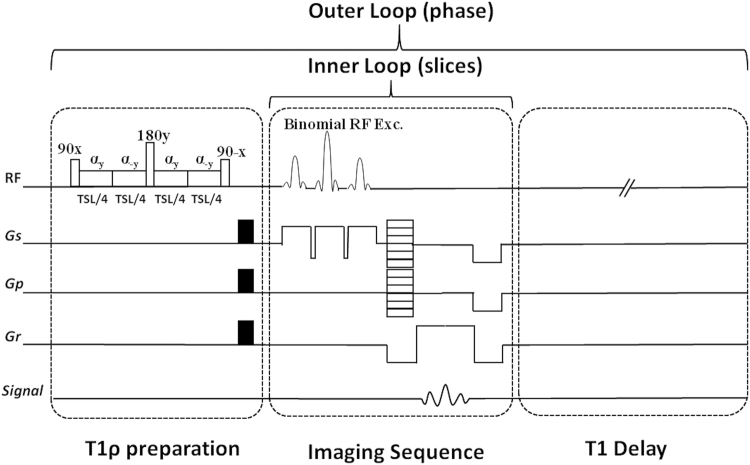
All imaging experiments were performed on a 3 T clinical scanner (Prisma, Siemens AG Healthcare, Erlangen, Germany). The imaging pulse sequence is shown in Fig. 6A 3D Cartesian turbo fast low-angle shot (turboFLASH) sequence with a customized T1ρ preparation module was used to enable T1ρ imaging with varying spin-lock durations. The T1ρ preparation used a paired self-compensated spin-lock pulse to minimize B0 and B1 inhomogeneities. A binomial RF pulse was employed that uses a series of composite pulses that excites the water peak only (the fat peak remains untouched). To minimize the effects of B0 variations, a 180° refocusing pulse is inserted midway between the 90° pulses. To achieve B1 insensitivity, two self-compensated pulses of opposite phase (+y/−y), each of duration TSL/4 is applied along the y-axis. This ensures that the magnetization returns to the starting point before the 180° refocusing pulse is applied. This technique was reported earlier31 by another research group. For all experiments a constant spin lock frequency of 500 Hz was used. Following data acquisition, a T1 restoration delay is added for each TR. For the egg experiments a 15 channel Tx/Rx knee coil (Quality Electrodynamics Inc., Mayfield, OH, USA) was used and for the in vivo brain experiments a vendor provided 16 channel receive only birdcage head coil (Siemens AG Healthcare, Erlangen, Germany) was used.
Figure 6.
The imaging sequence timing diagram consists of T1ρ preparation, 3D turbo-Flash readout, and T1 recovery delay. To compensate the effect of B1 inhomogeneities, the spin-lock pulse (SL) was divided into four segments with alternative phase. A 180° refocusing pulse was applied between two pairs for B0 inhomogeneity compensation. One phase line from all slices was acquired after applying the preparation module (inner loop). After T1 restoration delay the preparation module was applied again to acquire another phase line (outer loop).
Data Analysis and Statistics
The mono-exponential T1ρ decay obtained by fitting the signal at different spin lock times for each pixel may be calculated as:
| 2 |
where S is signal intensity, A is the amplitude, T1ρm is the mono-exponential T1ρ decay, and TSL are the spin lock times, A0 is the average noise level. The bi-exponential signal decay for each pixel may be calculated by fitting the data by modeling as components of two separate relaxation components as follows
| 3 |
where S is the signal generated, As and Al are the fractions of the signal that is contributed by the short and long components respectively, and expressed as a percentage given by as = As/(As + Al)x100, and al = Al/(As + Al)x100. T1ρs and T1ρl are the relaxation times of the short and long T1ρ components and TSL is the duration of the spin lock.
For the egg experiments, signal decays in each ROI were fitted on a pixel-by-pixel basis with mono- and bi-exponential decays using custom scripts written in MATLAB (The MathWorks Inc., Natick, MA, USA). Hand-drawn ROI’s for the HB, SB and raw egg whites, and egg yolks were made and images from TSL = 2 ms were used to create masks for the relaxation calculations. For the human brain experiments, FMRIB software library (FSL) software was used to de-skull the images, and for segmentation into GM and WM. Binary 3D masks were made for GM, WM, GM+WM, and were used for relaxation calculations. T1ρ mapping was done by fitting the data for each pixel to the mono-exponential signal model (equation 2), and the bi-exponential signal model (equation 3). For the bi-exponential fitting, if the condition 4 × Ts <Tl is not satisfied they were excluded from the bi-exponential maps32.
During the fitting process, the adjusted R2 was computed. For both mono- and bi-exponential fits, the sum of squared errors (SSE) was used as a measure for the goodness of fit. A significant P value suggested that bi-exponential fit is better than the mono-exponential fit, with the level of significance, P <0.05, considered to be statistically significant.
Bloch McConnell Simulations
To evaluate the effect of chemical exchange using a multi-pool model, and understand possible sources of the short and long T1ρ components, Bloch-McConnell (BM) simulations33,34 were employed using a 3 pool model as shown in Fig. 5(a). The model consists of a water pool (pool A), an exchanging pool (pool B) and a non-exchanging pool (pool C). There is chemical exchange between pool A and B, but minimal exchange between pools A and C, and negligible exchange between pools B and C. Data obtained from the numerical BM simulation was used to fit for the short and long T1ρ components. The spin lock frequency was varied (SL = 250, 500, 750 Hz) with an assumed spin lock duration of 55ms, exchange rates between pools B and A was varied (kBA = 0.5, 1, 2, 3, 4, 5 KHz), the fractional population was varied (fB = 0.005, 0.01, 0.015, 0.02, 0.025). The fractional population in non-exchanging pool varied as fC = 0.03, 0.06, 0.09, 0.12, 0.17. The default values for the simulations used for pool B: exchange rate, kBA = 2000 Hz, concentration, fB = 0.015%, chemical shift of 1.0 ppm, longitudinal and transverse relaxation time = 1.5 s and 15 ms, and for pool C: kCA = 25 Hz, fC = 0.09%, chemical shift of 0 ppm, longitudinal and transverse relaxation times = 1.5 s and 15 μs, respectively.
Data Availability
The datasets generated during and/or analysed during the current study are available from the corresponding author on reasonable request.
Acknowledgements
This study was supported by NIH grants R01-AR060238, R01 AR067156, and R01 AR068966, and was performed under the rubric of the Center of Advanced Imaging Innovation and Research (CAI2R), a NIBIB Biomedical Technology Resource Center (NIH P41 EB017183).
Author Contributions
R.G.M. designed, conducted the study, analyzed the data and wrote the manuscript. A.S. helped with the design and data analysis. J.W. helped with the design of the Bloch McConnell simulations. R.R.R. conceived and designed the study. All authors reviewed and contributed to the manuscript.
Competing Interests
The authors declare that they have no competing interests.
Footnotes
Publisher's note: Springer Nature remains neutral with regard to jurisdictional claims in published maps and institutional affiliations.
References
- 1.Kinney HC, Brody BA, Kloman AS, Gilles FH. Sequence of central nervous system myelination in human infancy. II. Patterns of myelination in autopsied infants. J Neuropathol Exp Neurol. 1988;47:217–234. doi: 10.1097/00005072-198805000-00003. [DOI] [PubMed] [Google Scholar]
- 2.MacKay A, et al. In vivo visualization of myelin water in brain by magnetic resonance. Magn Reson Med. 1994;31:673–677. doi: 10.1002/mrm.1910310614. [DOI] [PubMed] [Google Scholar]
- 3.Bartzokis G, et al. White matter structural integrity in healthy aging adults and patients with Alzheimer disease: a magnetic resonance imaging study. Arch Neurol. 2003;60:393–398. doi: 10.1001/archneur.60.3.393. [DOI] [PubMed] [Google Scholar]
- 4.Kuhn MJ, et al. Wallerian degeneration after cerebral infarction: evaluation with sequential MR imaging. Radiology. 1989;172:179–182. doi: 10.1148/radiology.172.1.2740501. [DOI] [PubMed] [Google Scholar]
- 5.Does MD, Gore JC. Rapid acquisition transverse relaxometric imaging. J Magn Reson. 2000;147:116–120. doi: 10.1006/jmre.2000.2168. [DOI] [PubMed] [Google Scholar]
- 6.Deoni SC, Rutt BK, Peters TM. Rapid combined T1 and T2 mapping using gradient recalled acquisition in the steady state. Magn Reson Med. 2003;49:515–526. doi: 10.1002/mrm.10407. [DOI] [PubMed] [Google Scholar]
- 7.Sepponen RE, Pohjonen JA, Sipponen JT, Tanttu JI. A method for T1 rho imaging. J Comput Assist Tomogr. 1985;9:1007–1011. doi: 10.1097/00004728-198511000-00002. [DOI] [PubMed] [Google Scholar]
- 8.Gilani IA, Sepponen R. Quantitative rotating frame relaxometry methods in MRI. NMR Biomed. 2016;29:841–861. doi: 10.1002/nbm.3518. [DOI] [PubMed] [Google Scholar]
- 9.Wang L, et al. T1rho MRI of menisci and cartilage in patients with osteoarthritis at 3T. Eur J Radiol. 2012;81:2329–2336. doi: 10.1016/j.ejrad.2011.07.017. [DOI] [PMC free article] [PubMed] [Google Scholar]
- 10.Nishioka H, et al. T1rho and T2 mapping reveal the in vivo extracellular matrix of articular cartilage. J Magn Reson Imaging. 2012;35:147–155. doi: 10.1002/jmri.22811. [DOI] [PubMed] [Google Scholar]
- 11.Keenan KE, et al. Prediction of glycosaminoglycan content in human cartilage by age, T1rho and T2 MRI. Osteoarthritis Cartilage. 2011;19:171–179. doi: 10.1016/j.joca.2010.11.009. [DOI] [PMC free article] [PubMed] [Google Scholar]
- 12.Borthakur A, Sochor M, Davatzikos C, Trojanowski JQ, Clark CM. T1rho MRI of Alzheimer’s disease. Neuroimage. 2008;41:1199–1205. doi: 10.1016/j.neuroimage.2008.03.030. [DOI] [PMC free article] [PubMed] [Google Scholar]
- 13.Nestrasil I, et al. T1rho and T2rho MRI in the evaluation of Parkinson’s disease. J Neurol. 2010;257:964–968. doi: 10.1007/s00415-009-5446-2. [DOI] [PMC free article] [PubMed] [Google Scholar]
- 14.Mlynarik V, Szomolanyi P, Toffanin R, Vittur F, Trattnig S. Transverse relaxation mechanisms in articular cartilage. J Magn Reson. 2004;169:300–307. doi: 10.1016/j.jmr.2004.05.003. [DOI] [PubMed] [Google Scholar]
- 15.Sharafi, A., Xia, D., Chang, G. & Regatte, R. R. Biexponential T1rho relaxation mapping of human knee cartilage in vivo at 3 T. NMR Biomed, 10.1002/nbm.3760 (2017). [DOI] [PMC free article] [PubMed]
- 16.Sharafi A, Chang G. & Regatte, R. R. Bi-component T1rho and T2 Relaxation Mapping of Skeletal Muscle In-Vivo. Sci Rep. 2017;7:14115. doi: 10.1038/s41598-017-14581-9. [DOI] [PMC free article] [PubMed] [Google Scholar]
- 17.Mitsouras D, Mulkern RV, Maier SE. Multicomponent T2 relaxation studies of the avian egg. Magn Reson Med. 2016;75:2156–2164. doi: 10.1002/mrm.25762. [DOI] [PMC free article] [PubMed] [Google Scholar]
- 18.Yuan J, Zhao F, Chan Q, Wang YX. Observation of bi-exponential T(1rho) relaxation of in-vivo rat muscles at 3T. Acta Radiol. 2012;53:675–681. doi: 10.1258/ar.2012.120108. [DOI] [PubMed] [Google Scholar]
- 19.Gonyea JV, et al. In vivo quantitative whole-brain T1 rho MRI of multiple sclerosis. J Magn Reson Imaging. 2015;42:1623–1630. doi: 10.1002/jmri.24954. [DOI] [PubMed] [Google Scholar]
- 20.Mangia S, et al. Magnetization transfer and adiabatic T1rho MRI reveal abnormalities in normal-appearing white matter of subjects with multiple sclerosis. Mult Scler. 2014;20:1066–1073. doi: 10.1177/1352458513515084. [DOI] [PMC free article] [PubMed] [Google Scholar]
- 21.Chappell KE, et al. Magic angle effects in MR neurography. AJNR Am J Neuroradiol. 2004;25:431–440. [PMC free article] [PubMed] [Google Scholar]
- 22.Redfield AG. Nuclear Magnetic Resonance Saturation and Rotary Saturation in Solids. Phys Rev. 1955;98:1787–1809. doi: 10.1103/PhysRev.98.1787. [DOI] [Google Scholar]
- 23.Cobb JG, Xie J, Gore JC. Contributions of chemical exchange to T1rho dispersion in a tissue model. Magn Reson Med. 2011;66:1563–1571. doi: 10.1002/mrm.22947. [DOI] [PMC free article] [PubMed] [Google Scholar]
- 24.Cobb JG, Li K, Xie J, Gochberg DF, Gore JC. Exchange-mediated contrast in CEST and spin-lock imaging. Magn Reson Imaging. 2014;32:28–40. doi: 10.1016/j.mri.2013.08.002. [DOI] [PMC free article] [PubMed] [Google Scholar]
- 25.Stadelman, W. J. & Cotterill, O. J. Egg science and technology. 4th edn, (Haworth Press, 1995).
- 26.Lee D, Jin KH, Kim EY, Park SH, Ye JC. Acceleration of MR parameter mapping using annihilating filter-based low rank hankel matrix (ALOHA) Magn Reson Med. 2016;76:1848–1864. doi: 10.1002/mrm.26081. [DOI] [PubMed] [Google Scholar]
- 27.Schuenke, P. et al. Adiabatically prepared spin-lock approach for T1rho-based dynamic glucose enhanced MRI at ultrahigh fields. Magn Reson Med, 10.1002/mrm.26370 (2016). [DOI] [PubMed]
- 28.Andronesi OC, et al. Whole brain mapping of water pools and molecular dynamics with rotating frame MR relaxation using gradient modulated low-power adiabatic pulses. Neuroimage. 2014;89:92–109. doi: 10.1016/j.neuroimage.2013.12.007. [DOI] [PMC free article] [PubMed] [Google Scholar]
- 29.Schneider E, Glover G. Rapid in vivo proton shimming. Magn Reson Med. 1991;18:335–347. doi: 10.1002/mrm.1910180208. [DOI] [PubMed] [Google Scholar]
- 30.Chung S, Kim D, Breton E, Axel L. Rapid B1+ mapping using a preconditioning RF pulse with TurboFLASH readout. Magn Reson Med. 2010;64:439–446. doi: 10.1002/mrm.22423. [DOI] [PMC free article] [PubMed] [Google Scholar]
- 31.Mitrea BG, Krafft AJ, Song R, Loeffler RB, Hillenbrand CM. Paired self-compensated spin-lock preparation for improved T1rho quantification. J Magn Reson. 2016;268:49–57. doi: 10.1016/j.jmr.2016.04.017. [DOI] [PubMed] [Google Scholar]
- 32.Juras V, et al. Quantitative MRI analysis of menisci using biexponential T2* fitting with a variable echo time sequence. Magn Reson Med. 2014;71:1015–1023. doi: 10.1002/mrm.24760. [DOI] [PMC free article] [PubMed] [Google Scholar]
- 33.Zu, Z., Li, H., Jiang, X. & Gore, J. C. Spin-lock imaging of exogenous exchange-based contrast agents to assess tissue pH. Magn Reson Med, 10.1002/mrm.26681 (2017). [DOI] [PMC free article] [PubMed]
- 34.Zu Z, Spear J, Li H, Xu J, Gore JC. Measurement of regional cerebral glucose uptake by magnetic resonance spin-lock imaging. Magn Reson Imaging. 2014;32:1078–1084. doi: 10.1016/j.mri.2014.06.002. [DOI] [PMC free article] [PubMed] [Google Scholar]
Associated Data
This section collects any data citations, data availability statements, or supplementary materials included in this article.
Data Availability Statement
The datasets generated during and/or analysed during the current study are available from the corresponding author on reasonable request.


