Abstract
Tight junctions are required for the formation of tissue barriers and function as suppressors of signalling mechanisms that control gene expression and cell behaviour; however, little is known about the physiological and developmental importance of such signalling functions. Here, we demonstrate that depletion of MarvelD3, a transmembrane protein of tight junctions, disrupts neural crest formation and, consequently, development of neural crest-derived tissues during Xenopus embryogenesis. Using embryos and explant cultures combined with a small molecule inhibitor or mutant mRNAs, we show that MarvelD3 is required to attenuate JNK signalling during neural crest induction and that inhibition of JNK pathway activation is sufficient to rescue the phenotype induced by MarvelD3 depletion. Direct JNK stimulation disrupts neural crest development, supporting the importance of negative regulation of JNK. Our data identify the junctional protein MarvelD3 as an essential regulator of early vertebrate development and neural crest induction and, thereby, link tight junctions to the control and timing of JNK signalling during early development.
Introduction
Tight junctions are multi-protein assemblies essential for epithelia and endothelia to separate compartments of different composition, as they constitute semipermeable paracellular barriers1. Tight junctions also serve as bidirectional hubs that receive signals from the cell interior to regulate junctional functions and transmit signals to the cell to guide various cellular processes including gene expression, cell proliferation, migration and survival1,2. Junctional signalling mechanisms that regulate cell behaviour are generally inhibitory: They suppress the activity of signalling pathways that promote proliferation and/or migration, such as the JNK (c-Jun N-terminal Kinase) pathway or proliferation-promoting transcriptional pathways involving AP1, ZONAB or YAP/TAZ3,4. While loss-of-function in vivo studies have led to considerable insights into the roles of junctional barriers in tissue and organ function, the relevance of junctional signalling mechanisms in physiological and developmental processes and the inhibitory role of tight junctions in the regulation of intracellular signalling pathways in vivo are poorly understood.
Tight junctions are composed of a large number of transmembrane and cytoplasmic plaque proteins. The cytoplasmic plaque contains a variety of molecules that function as multivalent adaptors and cytoskeletal linkers, and/or as components of signalling mechanisms. Among the transmembrane proteins, occludin, tricellulin and MarvelD3 share a common MARVEL (MAL and related proteins for vesicle traffic and membrane link) domain that differentiates them from the other junctional tetraspan transmembrane proteins of the claudin family2,5,6. Claudins are thought to form the junctional barrier and to mediate selective paracellular permeability, which is supported by in vitro and in vivo studies7,8. While the junctional MARVEL domain proteins may modulate junctional permeability properties, they are thought to function mostly as regulators of tight junctions or components of signalling mechanisms by which tight junctions signal to the cell interior6,9,10. Nevertheless, the importance of the MARVEL domain proteins as well as other tight junction transmembrane components for the regulation of signalling mechanisms in vivo and the physiological relevance of such processes is unclear.
MarvelD3 is the most recently identified junctional tetraspan protein, and loss-of-function experiments demonstrated that it is not required for the formation of functional paracellular barriers6,11. Further in vitro experiments demonstrated that MarvelD3 is a junctional signalling inhibitor that regulates the epithelial stress response by attenuating JNK activity and, thereby, guides gene expression, cell migration, survival, and proliferation10. Similar to other tight junction proteins, MarvelD3 is widely expressed and, typical for MARVEL domain proteins, restricted to vertebrates6,11. Despite their wide tissue expression profile, tight junction proteins often serve functions that are important for specific tissues and organs. Tricellulin, for example, is essential for hearing but of limited importance in other tissues12. We hence asked whether MarvelD3 is important for specific physiological processes in vivo. In a recent study, we found that MarvelD3 regulates eye morphogenesis in Xenopus laevis13. Intriguingly, while this activity involves JNK, it does not require an inhibitory but an as yet ill-defined stimulatory function of MarvelD3 in JNK signalling.
Here, we asked if MarvelD3 and its suppressive function in JNK signalling are required for dynamic processes during development. Early development relies on interplay between gene expression, cell proliferation and cell migration, processes that can be regulated by JNK signalling and require precisely timed regulation of critical signalling mechanisms. Therefore, we focused on the role of MarvelD3 in early developmental processes. Our results show that MarvelD3 is indeed essential for early development and, specifically, for neural crest induction. We further demonstrate that the underlying mechanism is attenuation of JNK signalling, identifying an unexpected importance of suppression of JNK to enable normal neural crest induction and demonstrating the physiological relevance of tight junction proteins as suppressors of intracellular signalling.
Results
Temporal expression of MarvelD3
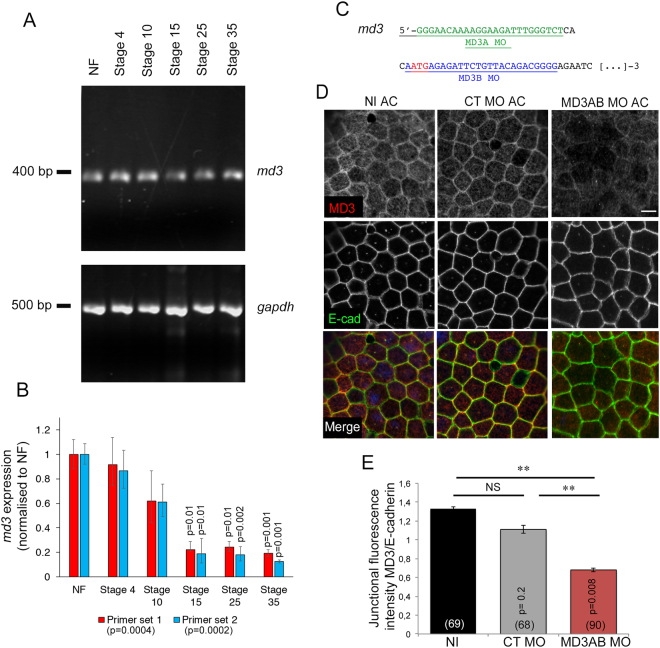
Tight junction components of maternal origin are assembled into adhesive complexes as early as the first embryonic cleavage and are gradually replaced by their zygotic counterpart during mid-blastula transition14,15. Thus, we asked whether and when marveld3 transcript is expressed during early Xenopus embryogenesis. The temporal distribution of marveld3 expression was determined by RT-PCR in non-fertilized eggs (NF) and blastula (stage 3) to identify the maternal RNA and in gastrula (stage 10, gastrulation), neurula (stage 15, neurulation), tailbud (stage 25, convergent extension) and tadpole (stage 35, organogenesis) for expression of zygotic RNA. We found maternal and zygotic marveld3 expression compatible with an early developmental function (Fig. 1A). Relative abundance was highest in non-fertilized eggs, suggesting a significant maternal contribution to the mRNA pools during early development (Fig. 1B).
Figure 1.
Marveld3 expression during Xenopus embryogenesis and morpholinos efficiency. (A) Analysis of marveld3 transcript expression by semi-quantitative RT-PCR in non-fertilized eggs (NF) and whole embryos from stage (St) 4 to 35; gapdh expression was used as a positive control; bp: base pairs. (B) Quantification of marvelD3 expression levels. Quantitative PCR was performed with two different sets of primers for marvelD3 and a pair of primers amplifying odc as a normaliser. Shown are means ± 1 SD of measurements with three independent mRNA isolations per developmental stage. ANOVA values are provided in the graph legend. The indicated p-values in the graph were calculated with t-tests comparing to the corresponding NF values. (C) MD3A (green) and MD3B (blue) morpholino sequences are indicated in the 5′-end of the Xenopus marveld3 sequence; the start codon is indicated in red. (D) Analysis of MarvelD3 depletion by immunofluorescence was performed in animal caps derived from stage 8 embryos that had been injected with control or MD3AB morpholinos into both blastomeres at the 2-cell stage. MarvelD3 (red) and E-cadherin (adherens junction marker; green) expression was analyzed by immunofluorescence in animal caps explants. Scale bar, 100 μm; NI, non-injected embryos. (E) Ratio of fluorescence intensity at junctions for MarvelD3 and E-cadherin. Mann Whitney test p values are on the graph; the number of cells counted is indicated in brackets on the graph bars; black bar, NI animal caps; grey bar, control morpholino- and red bar, MD3AB morpholino-injected animal caps; red bar, MD3AB morpholino-injected animal caps.
To probe for a function of MarvelD3, we designed two distinct translation blocking morpholino antisense oligonucleotides targeting either, the 5′-untranslated region (MD3A morpholino), or, the beginning of the coding region (MD3B morpholino) of the marveld3 mRNA (Fig. 1C). Additionally, we used a standard negative control morpholino. First, we tested the efficiency of the morpholinos in downregulating MarvelD3 expression by analysing MarvelD3 protein level in animal cap explants by immunofluorescence. Animal cap explants, corresponding to the ectodermal epithelium were generated by dissecting embryos injected into both blastomeres with morpholinos. MarvelD3 was detected at cell-cell contacts in non-injected and control morpholino animal caps, confirming its association with the epithelial junctional complex as in mammalian cells (Fig. 1D)6,11. Animal caps presented a reduced junctional staining of MarvelD3 upon injection of MarvelD3 morpholinos compared to animal caps derived from non-injected and control morpholino-injected embryos (Fig. 1D-E). Thus, expression of junctional MarvelD3 can be effectively reduced. The junctional localization of E-cadherin was not affected by MarvelD3 depletion, and no gross morphological defects were observed in depleted ectodermal epithelium (Fig. 1D). These data indicate that morpholinos designed to target MarvelD3 efficiently reduce the expression of MarvelD3 protein.
MarvelD3 depletion disrupts neural crest derivative differentiation
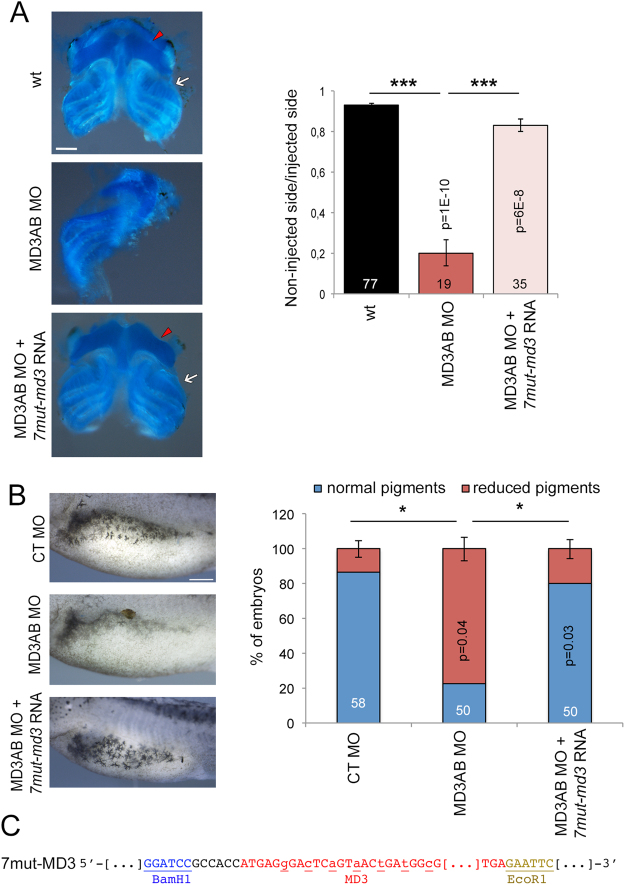
In our previous study, MarvelD3 depleted embryos showed no visible morphological alteration until the neurula stage; however, tailbud embryos presented defective head morphology in addition to abnormal eye development13. This prompted us to ask whether craniofacial cartilage morphogenesis was affected. Indeed, the structure and size of the craniofacial cartilage were severely disrupted in MarvelD3 morphants (Fig. 2A). The craniofacial cartilage is a neural crest derivative and its abnormal development may reflect a deregulation of processes controlling neural crest formation and/or subsequent neural crest cell migration16. Hence, we asked next whether the morphogenesis of a different neural crest derivative was also affected. Figure 2B shows that development of the normal pattern of lateral line pigmentation, formed by neural crest-derived melanocytes, was indeed disturbed upon MarvelD3 morpholino injection, supporting a possible effect of MarvelD3 depletion on neural crest development. We further tested specificity by generating a MarvelD3 encoding mRNA that is not targeted by the two morpholinos. As MD3A morpholino targets the 5′-non-coding region, only the coding region was expressed and seven silent substitutions were introduced into the sequence targeted by MD3B morpholino (7mut-marveld3 mRNA; Fig. 2C13). Craniofacial cartilage morphology and size, as well as lateral line pigmentation were restored by co-injection of 7mut-marveld3 mRNA with MarvelD3 morpholinos, confirming the specificity of the morphant phenotype (Fig. 2B and C). MarvelD3 is thus required for normal development of two distinct neural crest derivatives.
Figure 2.
MarvelD3 depletion disrupts neural crest derivatives development. (A) Craniofacial cartilage morphology was analysed and its size measured in control, MD3AB morpholino-injected embryos and embryos co-injected with 7mut-marveld3 mRNA. Note, ceratohyal (red arrowhead) and ceratobranchial (white arrow) cartilage was reduced in MarvelD3 morphants. (B) The lateral line pigmentation (stage 42) pattern was analysed and quantified in control morpholino, MD3AB morpholino-injected embryos and embryos co-injected with 7mut-marveld3 mRNA. Scale bars, 500 μm; Student t-test p values and the number of embryos analysed are indicated on the graph; blue bar, normal pigments; red bar, reduced pigments; the number craniofacial cartilage samples analysed is indicated on the graph; black bar, wt; red bar, MD3AB morpholinos; light red bar, MD3AB morpholinos + 7mut-marveld3 RNA. (C) 7mut-marveld3 was subcloned in pCS2+ vector (BamH1/ EcoR1). Restriction sites: underlined; mutated bases of marveld3: underlined lower cases.
Ectodermal expression of marveld3 overlaps with prospective neural crest domain
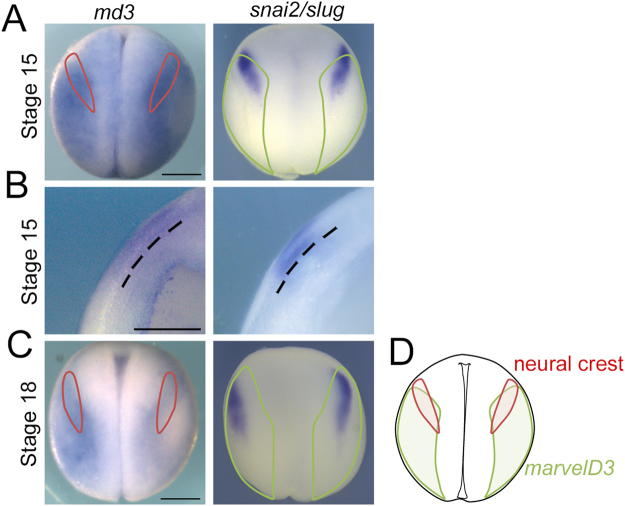
As MarvelD3 knockdown disrupts differentiation of two neural crest derivatives, we asked whether marveld3 is expressed in the ectoderm or mesoderm, both tissues are known to produce signals required for neural crest induction, or whether marveld3 is expressed in the prospective neural crest domain at the neural plate border, the region between the neural and non-neural ectoderm16. To determine the spatial distribution of the marveld3 transcript, we analysed its expression pattern by whole-mount in situ hybridization in whole and bisected embryos. This revealed that marveld3 is expressed in the dorso-lateral region of the embryo but excluded from the most dorsal area corresponding to the neural plate (Fig. 3A,C). Interestingly, marveld3 expression extends towards the neural plate border where the neural crest arises, as suggested by the overlap of marveld3 with the snai2/slug territory, an early neural crest marker (Fig. 3A,C,D). Nevertheless, marveld3 expression is not exclusive to the prospective neural crest domain but has a wider distribution. Cross sections showed that marveld3 expression is enriched in the superficial ectodermal layer expressing snai2/slug (Fig. 3B)17. The marveld3 expression pattern thus supports a potential role in neural crest formation.
Figure 3.
marveld3 transcript expression domain at neurula stage. Dorsal view of stage 15 (A) and 18 (C) whole embryos analysed for marveld3 and snai2/slug expression by Whole-mount in situ hybridization (WISH). (B) WISH analysis of marveld3 and snai2/slug expression on transversal sections of bisected embryos at stage 15. (D) Scheme representing the expression domains of marveld3 (green) and neural crest (red).
MarvelD3 depletion disrupts the expression pattern of early neural crest markers
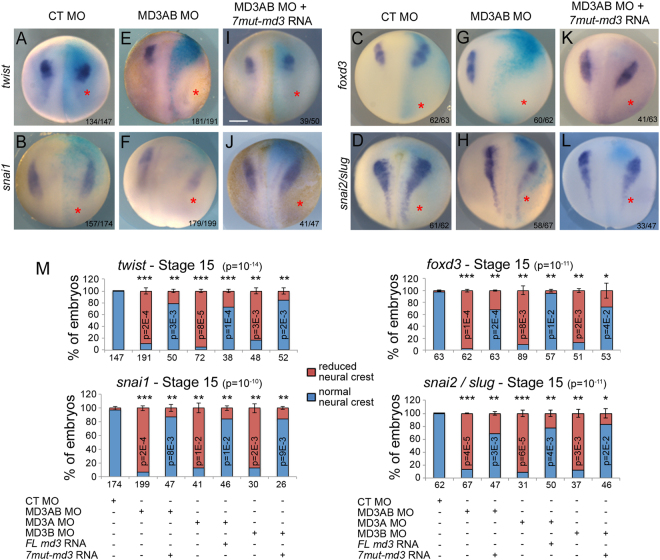
Given that marveld3 expression overlaps with the prospective neural crest domain at the neurula stage, we asked whether MarvelD3 regulates early neural crest formation. We therefore analyzed the impact of MarvelD3 depletion on the expression pattern of the early neural crest markers twist, snai1, foxd3 and snai2/slug18. The expression of these neural crest specifiers was indeed reduced on the MD3AB morpholino-injected side while their expression was unaffected in control morpholino-injected embryos (Fig. 4). A similar reduction of the expression domain of early neural crest markers was obtained by the injection of either MD3A or MD3B morpholino alone (Fig. 4 and Supplemental Fig. S1). As morpholinos targeting different sequences of marveld3 mRNA reduced expression of neural crest markers, this phenotype is unlikely to have resulted from an off-target effect of the morpholinos. Moreover, co-injection of morpholino-resistant marveld3 mRNA with both morpholinos together or separately (7mut-marveld3 mRNA resistant to both morpholinos was used when both or only MD3B morpholino were injected, and fl marveld3 mRNA corresponding to the coding sequence of marveld3, when MD3A morpholino was injected; Supplemental Fig. S1A) efficiently rescued the disrupted expression of neural crest markers (Fig. 4 and Supplemental Fig. S1). Thus, defective neural crest development observed upon MarvelD3 depletion was induced by morpholinos targeting two different, non-overlapping marveld3 mRNA sequences and was effectively rescued by non-targeted mRNAs encoding marveld3, supporting the specificity of the observed phenotype in neural crest induction.
Figure 4.
MarvelD3 is required for neural crest formation. Neural crest induction was analysed at stage 15 by WISH using probes against the neural crest markers twist, snai1, foxd3 and snai2/slug, respectively, in control morpholino (A–D), MD3AB morpholinos (E–H) and embryos co-injected with MD3AB morpholino + 7mut-marveld3 RNA (I–L). The number of embryos analysed is indicated at the bottom right of each panel; red asterisk, injected side of the embryo with the light blue β-galactosidase staining; purple corresponds to the WISH staining; scale bar, 500 µm. (M) Quantification of neural crest induction was performed for twist, snai1, foxd3 and snai2/slug. ANOVA values are provided in parenthesis in the title of each graph. Student t-test p values and the number of embryos analysed are indicated under the graph. See Supplemental Fig. S1 for images of embryos injected with individual MD3A or MD3B morpholinos and corresponding rescue experiments.
MarvelD3 depletion causes displacement of the neural plate border
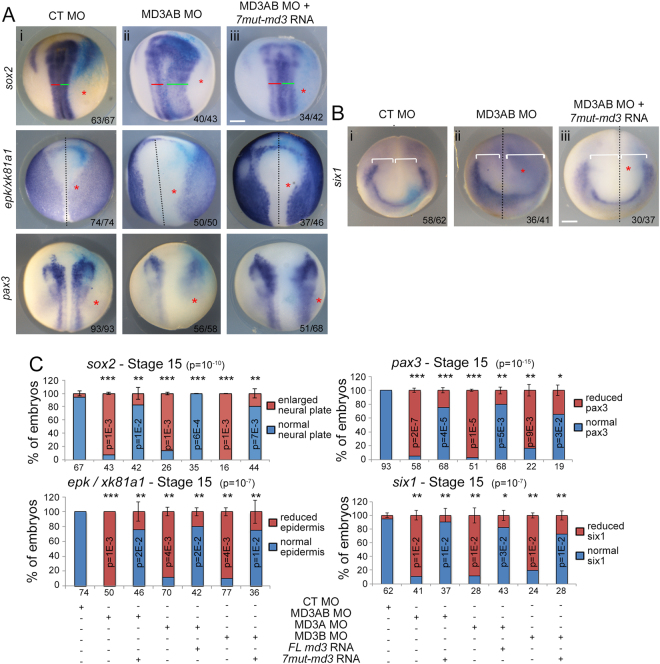
The neural crest is formed at the neural plate border; hence, MarvelD3-depleted embryos may not only have defects in early neural crest formation but also in positioning of the neural plate border. This hypothesis is supported by the observation that residual expression of neural crest markers tended to be laterally displaced in MarvelD3 morpholino-injected embryos (Fig. 4). We hence asked whether MarvelD3 knockdown affects expression of sox2, a marker for the neural plate; epidermal keratin (epk/xk81a1), a gene expressed in non-neural ectoderm; and pax3, a specifier of the neural plate border. The sox2 domain was mildly enlarged in the anterior neural plate and thicker posteriorly, while epk/xk81a1 was reduced in the anterior and dorso-lateral region of MarvelD3 morpholino-injected embryos (Fig. 5A,C and Supplemental Fig. S2A). These results suggest that the neural plate domain is increased at the expense of the non-neural and the neural crest domain. Consistently, pax3 expression was reduced and posteriorised in MarvelD3 knockdown embryos (Fig. 5A,C and Supplemental Fig. S2). Placodes, which also form at the neural plate border, were mildly enlarged laterally as indicated by the expression of the pan-placodal marker six1 (Fig. 5B,C and Supplemental Fig. S2). Co-injection of morpholino-resistant marveld3 mRNA rescued the border positioning phenotype induced by both MarvelD3 morpholinos (Fig. 5 and Supplemental Fig. S2). Depletion of MarvelD3 thus led to a specific deregulation of neural plate border positioning.
Figure 5.
MarvelD3 is required for neural plate border positioning. (A) Neural plate border positioning was analysed at stage 15 by WISH with probes against the neural/non-neural ectoderm markers (sox2; epk/xk81a1) and neural plate border marker pax3, while placode formation was analysed with (B) a pan-placodal marker, six1, in control morpholino- (A, i; B, i), MD3AB morpholino-injected embryos (A, ii; B, ii) and embryos co-injected with MD3AB morpholino + 7mut-MarvelD3 mRNA (A, iii; B, iii). (A) Red and green lines demarcate medio-lateral expansion of sox2; (A,B) black doted lines identify the midline; (B) white brackets indicate the distance from the midline; the number of embryos analysed is indicated at the bottom right of each panel; red asterisk, injected side of the embryo with the light blue β-galactosidase staining; scale bars, 500 µm. (C) Quantification of neural crest induction was performed for twist, snai1, foxd3 and snai2/slug. ANOVA values are provided in parenthesis in the title of each graph. Student t-test p values and the number of embryos analysed are indicated; blue bar, normal neural plate (NP; sox2) or epidermis (epk/xk81a1) or neural plate border (pax3, six1); red bar, enlarged neural plate (sox2) or reduced epidermis (epk/xk81a1) or reduced neural plate border (pax3, six1). See Fig. S2 for images of embryos injected with individual MD3A or MD3B morpholinos and corresponding rescue experiments.
MarvelD3 knockdown disrupts neural crest precursor formation
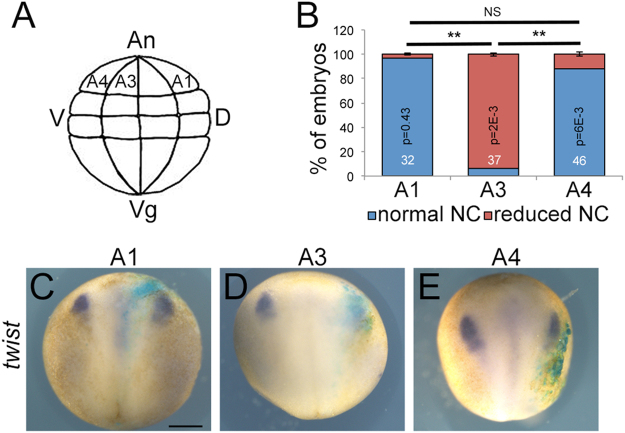
As the expression of marveld3 is not exclusive to the neural crest territory, we asked whether MarvelD3 is directly or indirectly affecting development of neural crest precursors formation by injecting individual blastomeres in 32-cells stage embryos to target neural plate, neural crest, or epidermis17,19. The A3 blastomere develops into neural crest and contributes to the epidermis, whereas the A1 and A4 blastomeres are mainly fated to become neural plate and epidermis, respectively19. Our result revealed that A1- and A4-injected embryos did not reveal a clear phenotype, indicating that targeting precursors of the neural plate and epidermis is not sufficient to induce the neural crest phenotype. In contrast, a strong reduction of the expression of the neural crest marker in embryos derived from the A3-injected embryos was observed, indicating that the induction of the phenotype required targeting of neural crest precursors (Fig. 6). These data thus suggest that the disruption of neural crest is a direct consequence of MarvelD3 depletion in cells that give raise to the neural crest.
Figure 6.
MarvelD3 depletion targeting a neural crest progenitor inhibits twist expression. (A) Scheme of the lateral view of a 32-cell stage embryo (adapted from Xenbase). The blastomeres are identified with from dorsal (D) to ventral (V) as A1 (mainly neural plate), A3 (mainly neural crest and epidermis) and A4 (mainly epidermis); An, animal; Vg, vegetal. (B) Neural crest induction (stage 15) was quantified by analysing twist expression by WISH in embryos injected at 32-cell stage either in the A1, A3 or A4 blastomere; Student t-test p values and the number of embryos analysed is indicated on the graph; blue bar, normal neural crest; red bar, reduced neural crest. Expression of the neural crest marker, twist by WISH in embryos injected in A1 (C), A3 (D) or A4 (E) blastomere, respectively at 32-cell stage. β-galactosidase (light blue staining) is expressed in the cells derived from the targeted blastomere. Note the reduction of twist expression only in A3 injected embryos. Scale bar, 500 μm.
MarvelD3 is required for neural crest induction
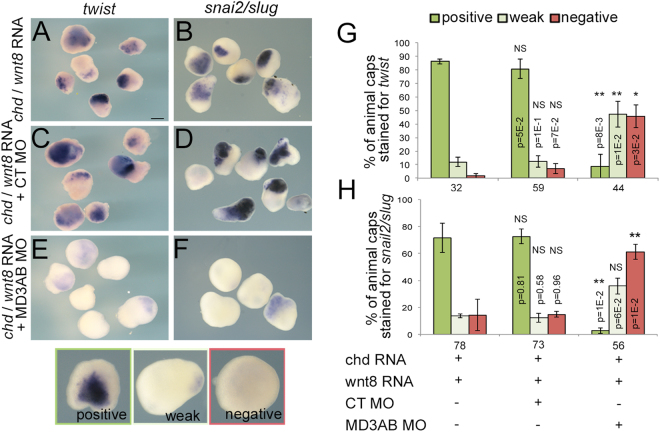
MarvelD3 depletion in neural crest precursor cells reduces the expression of neural crest marker as early as stage 15, suggesting MarvelD3 might be required during neural crest induction. The neural crest is induced by a combination of signals secreted by the ectoderm as well as the mesoderm, such as wnt8 and chordin, an antagonist of bone morphogenetic protein (BMP)16. To test whether MarvelD3 might modulate such signals, we stimulated neural crest induction in animal cap explants by co-injecting wnt8 and chd mRNA; these mRNAs induce neural crest fate as monitored by twist and snai2/slug expression (Fig. 7A,B,G,H)20. To determine the role of MarvelD3, neural crest inducers were co-injected with control or MarvelD3 morpholinos (Fig. 7C–H). Figure 7 shows that injection with MarvelD3 morpholinos, but not control morpholino, led to a strong attenuation of neural crest induction in animal caps as only weak signals for twist and for snai2/slug expression were observed. MarvelD3 thus plays an essential role in enabling signals inducing neural crest.
Figure 7.
MarvelD3 is required for neural crest induction. Expression of the neural crest markers twist and snai2/slug during neural crest induction (stage 15) was detected by WISH in animal caps explants injected with chd mRNA + wnt8 mRNA alone (A,B) and co-injected with control (C,D) or MD3AB morpholinos (E,F); scale bar, 500 μm. Neural crest induction phenotype was quantified in animal caps and classified as positive (dark green), weak (light green) and negative (red) for twist (G) and snai2/slug (H) expression. Student t-test p values and the number of animal caps analysed are indicated.
Mesodermal defects can affect neural crest induction21. Therefore, we asked whether MarvelD3 also regulates mesoderm formation. We analysed the expression of two mesodermal markers, xbrachyury (xbra) and goosecoid (gsc) at mid-gastrula stage. Expression of neither of the two mesodermal markers was altered in MarvelD3 morphants (Supplemental Fig. S3), excluding the possibility of a mesodermal contribution to the neural crest phenotype.
MarvelD3 depletion enhances JNK signalling during neural crest induction
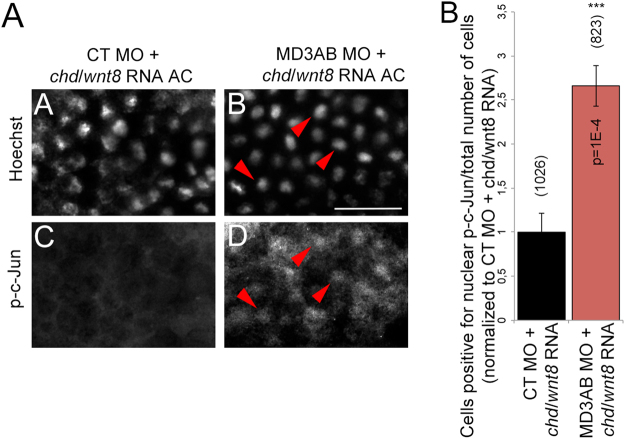
Neural crest induction requires the coordination of distinct signalling mechanisms that need to be activated in a controlled manner as they can negatively regulate each other. JNK is a crucial component of such signalling pathways and its activity is known to be required after initial induction of neural crest cell differentiation for neural crest cells to migrate to specific sites in the developing embryo. As we previously found that reduced expression of MarvelD3 in vitro stimulates JNK signalling and cell migration10, we asked whether MarvelD3 depletion leads to precocious activation of JNK during neural crest induction. Thus, we tested whether MarvelD3 knockdown stimulates JNK signalling in the animal cap model by assessing the induction and translocation of phosphorylated c-Jun (p-c-Jun) to the nucleus as a measure for activation of JNK. Figure 8 shows that animal caps derived from MarvelD3 morpholinos-injected embryos exhibited an increased number of cells with a positive nuclear phosphorylated c-Jun staining compared to control morpholino-animal caps. Thus, reduced MarvelD3 expression indeed leads to increased JNK signalling, suggesting that attenuation of JNK activation may be important during neural crest induction.
Figure 8.
MarvelD3 depletion activates JNK signalling. Analysis of JNK signalling by immunofluorescence using an antibody against phosphorylated form of c-Jun (p-c-Jun) in animal caps injected with chd mRNA + wnt8 mRNA + control morpholino (A,C) or chd mRNA + wnt8 mRNA + MD3AB morpholinos (B,D). Nuclei were stained with Hoechst; red arrowheads: examples of nuclear co-localization between Hoechst and p-c-Jun staining; scale bar, 50 μm. (E) Quantification of the number of cells with a positive nuclear p-c-Jun staining / total number of cells. Mann-Whitney test p values and the total of cells counted (number in brackets) are indicated on the graph; the values are normalized to control morpholino + chd mRNA + wnt8 mRNA; black bar, chd mRNA + wnt8 mRNA + control morpholino; red bar, chd mRNA + wnt8 mRNA + MD3AB morpholinos.
Chemical inhibition of JNK rescues neural crest induction in MarvelD3 knockdown
If increased JNK activity is indeed the underlying reason for the observed neural crest induction defect, inhibiting JNK should rescue the phenotype. To test this, we first assessed the effectiveness of the JNK inhibitor SP600125 (0.5 μg.ml−1) in animal caps using a constitutively active form of JNK to stimulate the nuclear translocation of the phosphorylated form of c-Jun. Constitutively active-jnk-injected animal caps showed an increase in the number of cells positive for nuclear phosphorylated c-Jun, which was attenuated by incubation with SP600125 (Supplemental Fig. S4). SP600125 thus inhibits JNK signalling in Xenopus.
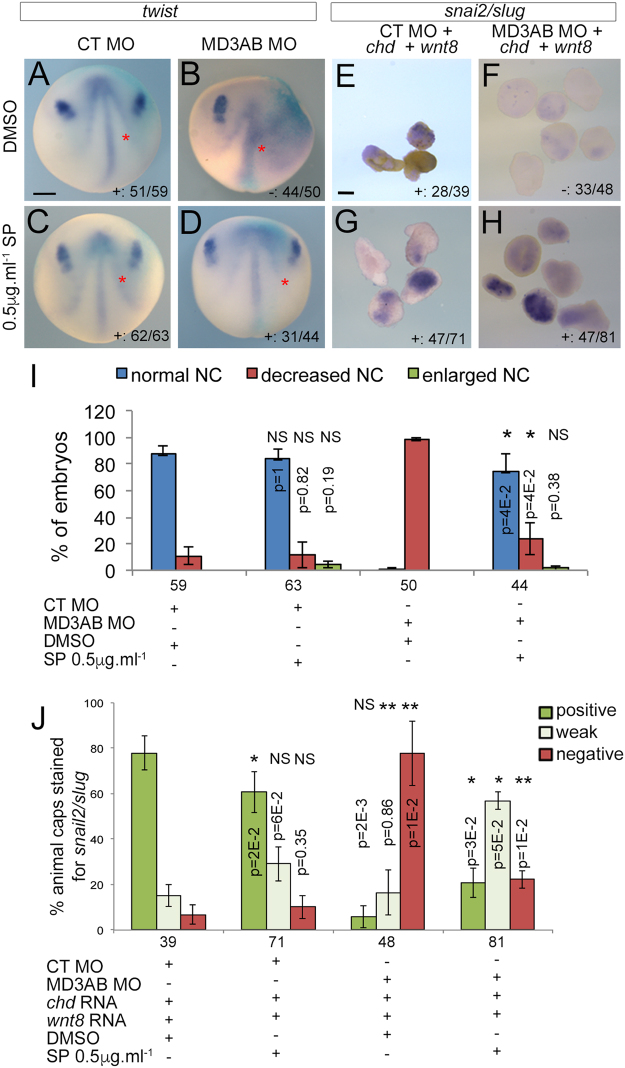
As MarvelD3 knockdown induces increased nuclear phosphorylated c-Jun (Fig. 8), we next asked whether inhibition of JNK by SP600125 is sufficient to rescue neural crest induction by incubating control and MarvelD3 morpholino-injected embryos with 0.5 μg.ml−1 of JNK inhibitor from early gastrula onwards. twist expression was unaffected in control morpholino embryos (Fig. 9A,C,I) at stage 15, suggesting the inhibition of JNK itself did not alter neural crest induction. Strikingly, SP600125 was sufficient to rescue neural crest induction in MarvelD3 morphants as monitored by twist expression (Fig. 9B,D,I). To corroborate these results, we performed the same experiment with the ectopic neural crest induction assay in animal caps. Similarly, to whole embryos, SP600125 rescued neural crest induction, as monitored by snai2/slug expression to a significant extent in MarvelD3 morpholino-injected animal caps (Fig. 9E–H,J). Hence, attenuation of the JNK pathway by a small molecule inhibitor is sufficient to rescue neural crest induction in MarvelD3 morphants.
Figure 9.
Rescue of neural crest formation by small molecule inhibitor for JNK in MarvelD3 depleted embryos. Neural crest induction (stage 15) was analysed by WISH against twist in control and MD3AB morpholino-injected embryos (A–D; red asterisk, injected side of the embryo with β-galactosidase staining) and against snai2/slug in animal caps explants co-injected with chd mRNA + wnt8 mRNA + control morpholino or chd mRNA + wnt8 mRNA + MD3AB morpholinos. Both embryos and animal caps were treated from stage 11 to 15 with DMSO or 0,5 μg.ml−1 SP600125, a JNK inhibitor (E–H). Neural crest induction was quantified according to twist or snai2/slug expression in embryos (I) and animal caps (J), respectively. Mann-Whitney test p values and the number of embryos or animal caps analysed are indicated; red asterisk, injected side of the embryo with light blue β-galactosidase staining. (I) blue bar, normal neural crest; red bar, reduced neural crest; (J) dark green bar, positive; light green bar, weak; red bar, negative snai2/slug staining. + , embryos or animal caps positive or weak for twist or snai2/slug expression; -, embryos or animal caps negative for twist or snai2/slug expression. Scale bars, 500 μm.
Attenuation of JNK signalling is required for neural crest induction
To confirm that increased JNK activity suppresses neural crest induction, we co-injected mRNAs encoding either a constitutively active form of JNK or a dominant negative JNK mutant with control or MarvelD3 morpholinos into a dorsal blastomere of 8-cell stage embryos and subsequently analysed neural crest induction by whole-mount in situ hybridization. twist expression was indeed reduced in control and MarvelD3 morpholinos embryos co-injected with constitutively active-jnk mRNA, reflecting an inhibition of neural crest induction; a partial rescue of neural crest induction was observed in MarvelD3 morphants co-injected with dominant negative-jnk mRNA similarly to the small molecule inhibitor (Fig. 10A–D and I, and Supplemental Fig. S5). Regulation of JNK activity with constitutively active-jnk and dominant negative-jnk mRNAs also modulated neural crest induction (snail2/slug expression) in the animal cap assay (Fig. 10E–H, J and Supplemental Fig. S5). Thus, increased JNK signalling suppresses neural crest induction, and inhibition of JNK signalling using two different approaches, dominant negative-jnk mRNA and the small molecule inhibitor SP600125, was sufficient to rescue neural crest induction in MarvelD3 morphants, indicating that attenuation of JNK activity by MarvelD3 is important during neural crest induction.
Figure 10.
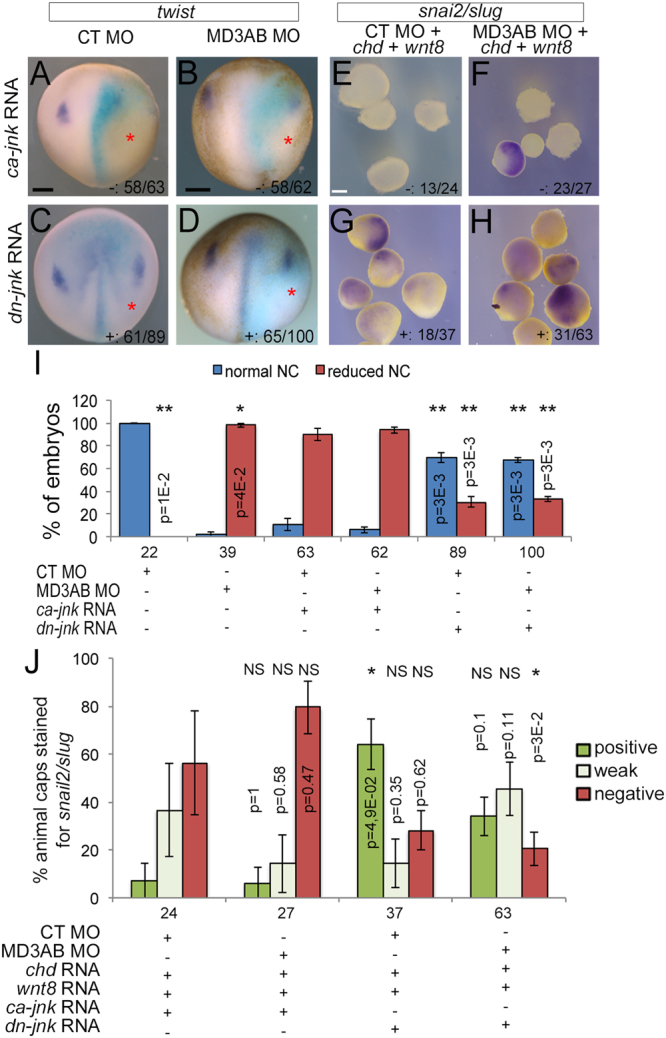
JNK pathway inhibition is required for neural crest formation in MarvelD3 knockdown embryos. Neural crest induction (stage 15) was analysed and quantified by WISH against twist in control and MD3AB morpholino embryos co-injected with constitutively active-jnk (ca-jnk) or dominant negative-jnk mRNA (dn-jnk) (A–D and I) and against snai2/slug in animal caps co-injected with chd mRNA + wnt8 mRNA + control morpholino or chd mRNA + wnt8 mRNA + MD3AB morpholinos and with constitutively active-jnk or dominant negative-jnk mRNA (E–H and J). Mann-Whitney test p values and the number of embryos or animal caps analysed are indicated; red asterisk, injected side of the embryo with light blue β-galactosidase staining. (I) blue bar, normal neural crest; red bar, reduced neural crest; (J) dark green bar, positive; light green bar, weak; red bar, negative snai2/slug staining. + , embryos or animal caps positive or weak for twist or snai2/slug expression; -, embryos or animal caps negative for twist or snai2/slug expression. Scale bars, 500 μm.
Discussion
Here, we identify the tight junction transmembrane protein MarvelD3 as a regulator of early embryogenesis required for neural crest induction. MarvelD3 guides neural crest formation by attenuating JNK pathway activation, a signalling mechanism important for steps following neural crest cell induction such as migration and development of neural crest-derived tissues16. MarvelD3 is downregulated during snail1-induced epithelial-mesenchymal transition, a process that also occurs at the onset of neural crest cell migration22. Our data hence support a model in which MarvelD3 is part of a mechanism that prevents precocious JNK signalling before dissolution of tight junctions, a pathway that disrupts neural crest induction if activated prematurely by expression of constitutively active-jnk mRNA or MarvelD3 depletion. The physiological importance of tight junctions during development is thus not restricted to the formation of tissue barriers and control of paracellular permeability but extends to guiding the activity of at least one central signalling process, the JNK pathway that drives cell migration and dynamics.
The temporal and spatial expression pattern of marveld3 is compatible with a functional role during early embryogenesis. marveld3 expression was detected from the non-fertilized egg to the tadpole stage. The junctional complex assembles during the first embryonic cleavage and MarvelD3 is associated with the junctional complex in the Xenopus ectoderm as previously shown for mammalian epithelia11,15,23–25. Interestingly, marveld3 distribution also presents similarities with the c-jun expression domain at the tadpole stage26,27. These data are in agreement with the involvement of MarvelD3 in neural crest development as a regulator of JNK signalling. Although marveld3 is more widely expressed and not restricted to the neural crest territory, the spatial distribution of the marveld3 transcript during embryogenesis substantiates its function in neural crest formation. The marveld3 transcript is strongly expressed in the dorso-lateral ectoderm of early neurulas; hence, it overlaps with the prospective neural crest territory, consistent with a role of MarvelD3 in the early steps of neural crest morphogenesis. A direct role of MarvelD3 in neural crest induction is indeed supported by targeted injections of blastomeres that recapitulated the neural crest induction phenotype only if the targeted blastomere gives rise to neural crest, and also through the requirement of MarvelD3 for neural crest induction in animal caps. Similarly to tadpoles, marveld3 expression also partially overlaps with c-jun expression at the lateral and posterior neural plate border regions27, supporting a model in which MarvelD3 participates in the coordination of c-Jun activity at the neural plate border during neural crest formation. We have previously reported that MarvelD3 can inhibit c-Jun activity in vitro10. This is compatible with our finding in animal cap explants-induced for neural crest formation demonstrating that depletion of MarvelD3 promotes nuclear translocation of phosphorylated c-Jun, reflecting JNK pathway activation. Although JNK signalling can regulate different transcription factors, suppression of c-Jun activation may thus be an important component of MarvelD3 signalling during neural crest induction.
Since marveld3 expression overlaps with the neural plate border territory where the neural crest arises, we analysed neural plate border positioning in MarvelD3 knockdown embryos and observed a lateral expansion of the neural plate and a complementarily reduction of the non-neural ectoderm. The defective neural plate border positioning observed in MarvelD3 morphants was paralleled by a lateral displacement of the remaining neural crest markers and a corresponding diffuse appearance of the neural plate border specifier pax3. Disruption of pax3 expression is known to affect both neural plate border formation and subsequently neural crest induction in Xenopus and mouse21,28–30. Although the reduced pax3 domain in MarvelD3 morphants might contribute to the neural plate border positioning defect, the targeted injections in blastomeres at the 32-cells stage revealed that defective neural crest induction in MarvelD3-depleted embryos was due to a direct effect on neural crest precursors. Indeed, reduced expression of genes, such as, the neural crest-inducing genes foxd3 and snai2/slug not only reduces the neural crest but, similar to what we observed in MarvelD3-depleted embryos, also leads to an expansion of the neural plate31. Hence, the displacement of the neural plate border is likely to be a consequence of early defects in neural crest induction.
Neural crest induction involves the tight regulation of synergizing signals21,32. Steventon et al. described neural crest induction as the result of variations of Wnt and BMP activity levels between early gastrula and early neurula stages33. The MarvelD3 requirement for neural crest induction in animal caps-induced for ectopic neural crest formation with wnt8 and chd mRNAs suggests that MarvelD3 impacts on this signalling network that centres on canonical Wnt and BMP signalling. For instance, in zebrafish, the inhibition of canonical Wnt signalling promotes the differentiation of neurons instead of pigments34, consistent with the observed expansion of the neural plate, reduced neural crest, and, consequently, reduced pigments in MarvelD3 knockdown embryos.
We previously reported that MarvelD3 suppresses JNK signalling in vitro10,13. Attenuation of JNK signalling by MarvelD3 is essential during neural crest induction: inhibition of JNK activity rescued neural crest development in MarvelD3 morphants while an increase in JNK activity was detrimental for neural crest development. However, JNK may also contribute to neural crest induction as recent studies suggest an involvement of the non-canonical Wnt/ROR2 pathway in neural crest specification in Xenopus35,36. It is thus conceivable that MarvelD3 might be involved in the regulation JNK to balance non-canonical Wnt and canonical Wnt signaling; hence, neural crest induction is disrupted due to overstimulation of JNK in MarvelD3 morphants or when JNK is hyperactivated by expression of constitutively active-jnk mRNA. Deregulation of the non-canonical Wnt/ROR2 pathway leads to a phenotype with a number of similarities with the one of MarvelD3 knockdown but there are clear differences in expression of neural plate border specifiers; thus, it seems unlikely that MarvelD3 is an integral part of ROR2 signalling. The non-canonical Wnt/planar cell polarity pathway, which also involves JNK signalling, is known to control the convergent extension process37 and neural crest migration; however, we did not observe defects on the anterior-posterior axis length as would be expected if that pathway was affected13. Moreover, we did also not observe an involvement of the mesoderm, further arguing against an involvement of the non-canonical Wnt/planar cell polarity pathway downstream of MarvelD3.
Our data suggest that modulation of JNK activity during the early phase of neural crest induction is required and mediated by a mechanism linked to epithelial integrity via tight junctions. In cancer cells, snai1 initiates epithelial-mesenchymal transition and downregulates MarvelD3 expression22. Hence, induction of neural crest specifiers such as snai1 leads to downregulation of MarvelD3 and release of the break on JNK signalling. We thus propose that MarvelD3 is part of a regulatory feedback loop that coordinates JNK activity with neural crest formation during early embryogenesis. Future studies will require tissue-specific knockout approaches to determine which cell type(s) are at the origin of the developmental defects and to analyse crosstalk with other signalling pathways to identify why some cell types are affected by downregulation of MarvelD3 and others are not. Experiments will also need to focus on the regulation of MarvelD3 itself as subcellular trafficking of the protein appears an important part of the associated regulatory mechanism in vitro10. During eye morphogenesis, MarvelD3 does not function as a suppressor of the JNK pathway as during neural crest development but is required for JNK activation13; hence, the molecular, cellular and developmental mechanisms will have to be determined that underlie the regulatory switch from JNK repressor to activator.
Methods
Xenopus laevis manipulation
Animals were used according to the UK Home Office regulations and the experimental protocols had been approved by the UCL Institute of Ophthalmology Animal Welfare and Ethical Review Body (PPL 70/6750). The embryos were staged according to38. Animal caps, dissected at stage 9, were cultured in Steinberg solution (4.6 mM Tris-HCl, pH7.4; 58 mM NaCl; 0.67 mM KCl; 0.34 mM Ca (NO3)2; 0.83 mM MgSO4) complemented with bovine serum albumin (BSA) and harvested at stage 15. DMSO (dimethyl sulfoxide; Sigma) or SP600125 (Tocris), a JNK inhibitor, was added to the culture medium, from stage 11 to 15 at 0.5 μg.ml−1.
RT-PCR
To determine marveld3 expression, total RNA from 10 embryos was extracted for each developmental stage following the manufacturer instructions (RNeasy mini kit, Qiagen). Semi-quantitative PCR was performed for Xenopus laevis marveld3 (Fw: ACAATGAGAGATTCTGTTACAGACGGGG and Rv: AAGCTCCCAACAGTTACAGCATCCATGGCT) and gapdh (Fw: ACTGCCACCCAGAAGAC and Rv: AAGTGCTTATTCCTTAGATG). Quantitative PCR was then performed with two pairs of primers for marveld3 (Pair 1, Fw: GAGAGACCAAACCCATGAAG and Rv: GGTCTCCCTTTCTCTGTAGTA; Pair 2, Fw: CAAAGATCGTCACCAGTATCC and Rv: CAAGATTCCACCATCTGTCTC). odc (ornithine decarboxylase) was amplified as a normaliser (Fw: GGATGGATTTGTTACATCCGTC and Rv CACTCTCCGAGCTCACTTCCC).
Whole-mount in situ hybridization (WISH), morpholinos, DNA
Embryos were processed for WISH as described in39. Control morpholino 5′-CCTCTTACCTCAgTTACAATTTATA-3′, a negative control targeting human a β-globin intron mutation responsible of β-thalassemia, and Xenopus MarvelD3 morpholinos (MD3A morpholino: AGACCCAAATCTTCCTTTTGTTCCC; MD3B morpholino: CCCGTCTGTAACAGAATCTCTCATT; Gene Tools; Fig. 1B) were used for the loss-of-function approach. 30 ng of MD3A or MD3B morpholino were injected for single morpholino experiments and 15ng of each when the two morpholinos were injected together. For the rescue experiments, either 2 ng of GFP tagged-full-length (fl) marveld3 (BamH1/EcoR1; Fw: GTTCGCGGATCCGCCACCATGGTGAGCAAGGGCGAG; Rv: CTTCCGGAATTCTCAAACATAGTTGTTGGGTTTCTTTTTTAAC) or 750 pg of a mutated marveld3 subcloned in pCS2+ (7mut-marveld3; BamH1/EcoR1; Fw: GTTCGCGGATCCGCCACCATGAGgGAcTCaGTaACtGAtGGcGAGAATCGGGCACCTAG; Rv: CTTCCGGAATTCTCAAACATAGTTGTTGGGTTTCTTTTTTAAC; mutated bases are in lower cases) were injected (Supplemental Fig. S1). Both marveld3 constructs were based on Xenopus laevis sequences. The dominant negative-jnk1 from Xenopus was a gift from Dr. Hidehiko Inomata previously described in40 and the constitutively active-jnk from Dr. Ira O. Daar was previously described in41. 200 pg of nuclear β-galactosidase, 500 pg of dominant negative-jnk, constitutively active-jnk, chd or wnt8 mRNAs were injected. Following WISH and imaging, embryos were embedded in 1% agarose and transversal sections were generated with a blade.
Cartilage staining and immunocytochemistry
Analysis of the cartilage morphology was performed on embryos (stage 45) fixed in MEMFA39, dehydrated, stained with 0.1 mg/ml Alcian blue 8GX (Sigma) (1 part acetic acid: 4 parts ethanol), cleared (70% ethanol + 1% HCl), prior to re-fixation and macerated in 2% KOH before dissection. To test morpholino efficiency, animal caps were harvested in Dent’s fixative (4 parts methanol: 1 part dimethyl sulfoxide), blocked in 2 mg/ml bovine serum albumin, 0.1% Triton X100 in phosphate buffered saline with 10% goat serum and incubated with polyclonal anti-xMarvelD3 (epitope amino-terminal amino acids: CTDGENRAPRKHRDHLENDT; Genosphere biotechnologies) and monoclonal anti-E-cadherin (610181; BD) antibodies. To analyse the activity of the JNK pathway, animal cap were fixed overnight in 4% paraformaldehyde (PFA) at 4 °C, permeabilised 15 minutes in PBT [2 mg/ml BSA, 0.1% Triton X100 in PBS], blocked 1 hour in PBT with 10% goat serum and incubated with polyclonal anti-p-c-Jun (S63; 9261 L, Cell Signaling) antibody followed by donkey anti-Cy3 labelled secondary antibody (Jackson Immunoresearch Inc.) combined to a Hoechst staining to visualize nuclei.
Imaging
Embryos were imaged with a SMZ 1500 Nikon microscope (Apochromat HR Plan 0.5×/WD 136 mm objective; camera Digital Sight DS-Fi2; Nikon), and immunofluorescence images were obtained with a LSM710 confocal microscope (C-Apochromat 40×/1.2 N. A. objective; Zeiss) (Fig. 1D) or a Nikon Eclipse Ti microscope (20× S Plan fluor/0.45 N. A. objective; Nikon) (Fig. 8A–D; Supplemental Fig. S4A–D). All images were analysed with ImageJ.
Image analysis, statistics and reproducibility
The intensity of the fluorescence for junctional MarvelD3 and E-cadherin (Fig. 1D) was measured with ImageJ. We quantify the number of cell with positive nuclear p-c-Jun by overlapping the nuclei and the phospho-antibody images and manually counted the phospho-antibody staining positive nuclei and calibrate it to the total number of nuclei. Values were then normalized to the control as indicated in the legends. Error bars indicate standard errors of the mean; ANOVA was used to analyse experiments with more than 2 groups; exact p values obtained from two tailed tests (Mann Whitney or t-tests as indicated in the legends) are indicated in the graphs; quantifications are based on at least three independent experiments. The numbers at the bottom right of the pictures correspond to the number of embryos or animal caps presenting the main observed phenotype. The numbers on/under the graphs correspond to the number of embryos, animal caps or cells counted as specified in the legends and are derived from at least three repeats. Morpholino experiments and corresponding recues were performed in parallel for each type of analysis.
Data availability
All data supporting the conclusions here are available from the authors on reasonable request.
Electronic supplementary material
Acknowledgements
The authors thank Dr. Hidehiko Inomata (Riken, Japan) for dn-jnk, Dr. Ira O. Daar (Center for Cancer Research, U.S.A) for ca-jnk and Prof. Sally A. Moody (George Washington University Medical Center, U.S.A.) for six1. The project was supported by the Biotechnology and Biological Science Research Council [BB/J015032/1 and BB/N014855/1; KM, MSB and SIO], Moorfields Eye Charity [R170006A; BV and KM], Fight for Sight [1740/1741] and by a Welcome Trust multiuser equipment grant [099173/Z/12/Z].
Author Contributions
B.V. performed the experiments designed by B.V., N.S., and R.M. with technical help from S.L.B. and E.S.H.; E.S. performed pilot experiments; K.M., M.S.B. and S.I.O. conceived the project; B.V., K.M., R.M., N.S., wrote the manuscript; all authors commented on and approved the manuscript.
Competing Interests
The authors declare that they have no competing interests.
Footnotes
Electronic supplementary material
Supplementary information accompanies this paper at 10.1038/s41598-018-19579-5.
Publisher's note: Springer Nature remains neutral with regard to jurisdictional claims in published maps and institutional affiliations.
References
- 1.Balda MS, Matter K. Tight junctions as regulators of tissue remodelling. Curr Opin Cell Biol. 2016;42:94–101. doi: 10.1016/j.ceb.2016.05.006. [DOI] [PubMed] [Google Scholar]
- 2.Matter K, Balda MS. Signalling to and from tight junctions. Nat Rev Mol Cell Biol. 2003;4:225–236. doi: 10.1038/nrm1055. [DOI] [PubMed] [Google Scholar]
- 3.Matter, K. & Balda, M. S. SnapShot: Epithelial tight junctions. Cell157, 992–992 e991, 10.1016/j.cell.2014.04.027 (2014). [DOI] [PubMed]
- 4.Zihni C, Mills C, Matter K, Balda MS. Tight junctions: from simple barriers to multifunctional molecular gates. Nat Rev Mol Cell Biol. 2016;17:564–580. doi: 10.1038/nrm.2016.80. [DOI] [PubMed] [Google Scholar]
- 5.Steed E, Balda MS, Matter K. Dynamics and functions of tight junctions. Trends Cell Biol. 2010;20:142–149. doi: 10.1016/j.tcb.2009.12.002. [DOI] [PubMed] [Google Scholar]
- 6.Raleigh DR, et al. Tight junction-associated MARVEL proteinsmarveld3, tricellulin, and occludin have distinct but overlapping functions. Mol Biol Cell. 2010;21:1200–1213. doi: 10.1091/mbc.E09-08-0734. [DOI] [PMC free article] [PubMed] [Google Scholar]
- 7.Furuse M. Knockout animals and natural mutations as experimental and diagnostic tool for studying tight junction functions in vivo. Biochim Biophys Acta. 2009;1788:813–819. doi: 10.1016/j.bbamem.2008.07.017. [DOI] [PubMed] [Google Scholar]
- 8.Gonzalez-Mariscal L, Tapia R, Chamorro D. Crosstalk of tight junction components with signaling pathways. Biochim Biophys Acta. 2008;1778:729–756. doi: 10.1016/j.bbamem.2007.08.018. [DOI] [PubMed] [Google Scholar]
- 9.Kojima T, Sawada N. Regulation of tight junctions in human normal pancreatic duct epithelial cells and cancer cells. Ann N Y Acad Sci. 2012;1257:85–92. doi: 10.1111/j.1749-6632.2012.06579.x. [DOI] [PubMed] [Google Scholar]
- 10.Steed E, et al. MarvelD3 couples tight junctions to the MEKK1-JNK pathway to regulate cell behavior and survival. J Cell Biol. 2014;204:821–838. doi: 10.1083/jcb.201304115. [DOI] [PMC free article] [PubMed] [Google Scholar]
- 11.Steed E, Rodrigues NT, Balda MS, Matter K. Identification of MarvelD3 as a tight junction-associated transmembrane protein of the occludin family. BMC Cell Biol. 2009;10:95. doi: 10.1186/1471-2121-10-95. [DOI] [PMC free article] [PubMed] [Google Scholar]
- 12.Nayak G, et al. Tricellulin deficiency affects tight junction architecture and cochlear hair cells. J Clin Invest. 2013;123:4036–4049. doi: 10.1172/JCI69031. [DOI] [PMC free article] [PubMed] [Google Scholar]
- 13.Vacca B, et al. MarvelD3 regulates the c-Jun N-terminal kinase pathway during eye development in Xenopus. Biol Open. 2016;5:1631–1641. doi: 10.1242/bio.018945. [DOI] [PMC free article] [PubMed] [Google Scholar]
- 14.Newport J, Kirschner M. A major developmental transition in early Xenopus embryos: I. characterization and timing of cellular changes at the midblastula stage. Cell. 1982;30:675–686. doi: 10.1016/0092-8674(82)90272-0. [DOI] [PubMed] [Google Scholar]
- 15.Cardellini P, Davanzo G, Citi S. Tight junctions in early amphibian development: detection of junctional cingulin from the 2-cell stage and its localization at the boundary of distinct membrane domains in dividing blastomeres in low calcium. Dev Dyn. 1996;207:104–113. doi: 10.1002/(SICI)1097-0177(199609)207:1<104::AID-AJA10>3.0.CO;2-0. [DOI] [PubMed] [Google Scholar]
- 16.Mayor R, Theveneau E. The neural crest. Development. 2013;140:2247–2251. doi: 10.1242/dev.091751. [DOI] [PubMed] [Google Scholar]
- 17.Li B, Kuriyama S, Moreno M, Mayor R. The posteriorizing gene Gbx2 is a direct target of Wnt signalling and the earliest factor in neural crest induction. Development. 2009;136:3267–3278. doi: 10.1242/dev.036954. [DOI] [PMC free article] [PubMed] [Google Scholar]
- 18.Stuhlmiller TJ, Garcia-Castro MI. Current perspectives of the signaling pathways directing neural crest induction. Cell Mol Life Sci. 2012;69:3715–3737. doi: 10.1007/s00018-012-0991-8. [DOI] [PMC free article] [PubMed] [Google Scholar]
- 19.Moody SA. Fates of the blastomeres of the 32-cell-stage Xenopus embryo. Dev Biol. 1987;122:300–319. doi: 10.1016/0012-1606(87)90296-X. [DOI] [PubMed] [Google Scholar]
- 20.Saint-Jeannet JP, He X, Varmus HE, Dawid IB. Regulation of dorsal fate in the neuraxis by Wnt-1 and Wnt-3a. Proc Natl Acad Sci USA. 1997;94:13713–13718. doi: 10.1073/pnas.94.25.13713. [DOI] [PMC free article] [PubMed] [Google Scholar]
- 21.Milet C, Monsoro-Burq AH. Neural crest induction at the neural plate border in vertebrates. Dev Biol. 2012;366:22–33. doi: 10.1016/j.ydbio.2012.01.013. [DOI] [PubMed] [Google Scholar]
- 22.Kojima T, et al. Downregulation of tight junction-associated MARVEL protein marvelD3 during epithelial-mesenchymal transition in human pancreatic cancer cells. Exp Cell Res. 2011;317:2288–2298. doi: 10.1016/j.yexcr.2011.06.020. [DOI] [PubMed] [Google Scholar]
- 23.Cardellini P, Cirelli A, Citi S. Tight junction formation in early Xenopus laevis embryos: identification and ultrastructural characterization of junctional crests and junctional vesicles. Cell Tissue Res. 2007;330:247–256. doi: 10.1007/s00441-007-0472-9. [DOI] [PubMed] [Google Scholar]
- 24.Eckert JJ, Fleming TP. Tight junction biogenesis during early development. Biochim Biophys Acta. 2008;1778:717–728. doi: 10.1016/j.bbamem.2007.09.031. [DOI] [PubMed] [Google Scholar]
- 25.Kalt MR. The relationship between cleavage and blastocoel formation in Xenopus laevis. I. Light microscopic observations. J Embryol Exp Morphol. 1971;26:37–49. [PubMed] [Google Scholar]
- 26.Garriock RJ, D’Agostino SL, Pilcher KC, Krieg PA. Wnt11-R, a protein closely related to mammalian Wnt11, is required for heart morphogenesis in Xenopus. Dev Biol. 2005;279:179–192. doi: 10.1016/j.ydbio.2004.12.013. [DOI] [PubMed] [Google Scholar]
- 27.Knochel S, Schuler-Metz A, Knochel W. c-Jun (AP-1) activates BMP-4 transcription in Xenopus embryos. Mech Dev. 2000;98:29–36. doi: 10.1016/S0925-4773(00)00448-2. [DOI] [PubMed] [Google Scholar]
- 28.Basch ML, Bronner-Fraser M, Garcia-Castro MI. Specification of the neural crest occurs during gastrulation and requires Pax7. Nature. 2006;441:218–222. doi: 10.1038/nature04684. [DOI] [PubMed] [Google Scholar]
- 29.Monsoro-Burq AH, Wang E, Harland R. Msx1 and Pax3 cooperate to mediate FGF8 and WNT signals during Xenopus neural crest induction. Dev Cell. 2005;8:167–178. doi: 10.1016/j.devcel.2004.12.017. [DOI] [PubMed] [Google Scholar]
- 30.Steventon B, Carmona-Fontaine C, Mayor R. Genetic network during neural crest induction: from cell specification to cell survival. Semin Cell Dev Biol. 2005;16:647–654. doi: 10.1016/j.semcdb.2005.06.001. [DOI] [PubMed] [Google Scholar]
- 31.Sasai N, Mizuseki K, Sasai Y. Requirement of FoxD3-class signaling for neural crest determination in Xenopus. Development. 2001;128:2525–2536. doi: 10.1242/dev.128.13.2525. [DOI] [PubMed] [Google Scholar]
- 32.Woda JM, Pastagia J, Mercola M, Artinger KB. Dlx proteins position the neural plate border and determine adjacent cell fates. Development. 2003;130:331–342. doi: 10.1242/dev.00212. [DOI] [PMC free article] [PubMed] [Google Scholar]
- 33.Steventon B, Araya C, Linker C, Kuriyama S, Mayor R. Differential requirements of BMP and Wnt signalling during gastrulation and neurulation define two steps in neural crest induction. Development. 2009;136:771–779. doi: 10.1242/dev.029017. [DOI] [PMC free article] [PubMed] [Google Scholar]
- 34.Dorsky RI, Moon RT, Raible DW. Control of neural crest cell fate by the Wnt signalling pathway. Nature. 1998;396:370–373. doi: 10.1038/24620. [DOI] [PubMed] [Google Scholar]
- 35.Ossipova O, Sokol SY. Neural crest specification by noncanonical Wnt signaling and PAR-1. Development. 2011;138:5441–5450. doi: 10.1242/dev.067280. [DOI] [PMC free article] [PubMed] [Google Scholar]
- 36.Schille C, Bayerlova M, Bleckmann A, Schambony A. Ror2 signaling is required for local upregulation of GDF6 and activation of BMP signaling at the neural plate border. Development. 2016;143:3182–3194. doi: 10.1242/dev.135426. [DOI] [PubMed] [Google Scholar]
- 37.Kim GH, Park EC, Han JK. Wnt/planar cell polarity signaling in the regulation of convergent extension movements during Xenopus gastrulation. Methods Mol Biol. 2012;839:79–89. doi: 10.1007/978-1-61779-510-7_7. [DOI] [PubMed] [Google Scholar]
- 38.Nieuwkoop, P. D. & Faber, J. Normal table of Xenopus laevis (Daudin): a systematical and chronological survey of the development from the fertilized egg till the end of metamorphosis. (Garland Pub., 1994).
- 39.Luehders K, et al. The small leucine-rich repeat secreted protein Asporin induces eyes in Xenopus embryos through the IGF signalling pathway. Development. 2015;142:3351–3361. doi: 10.1242/dev.124438. [DOI] [PubMed] [Google Scholar]
- 40.Yamanaka H, et al. JNK functions in the non-canonical Wnt pathway to regulate convergent extension movements in vertebrates. EMBO Rep. 2002;3:69–75. doi: 10.1093/embo-reports/kvf008. [DOI] [PMC free article] [PubMed] [Google Scholar]
- 41.Han SY, Kim SH, Heasley LE. Differential gene regulation by specific gain-of-function JNK1 proteins expressed in Swiss 3T3 fibroblasts. J Biol Chem. 2002;277:47167–47174. doi: 10.1074/jbc.M204270200. [DOI] [PubMed] [Google Scholar]
Associated Data
This section collects any data citations, data availability statements, or supplementary materials included in this article.
Supplementary Materials
Data Availability Statement
All data supporting the conclusions here are available from the authors on reasonable request.


