Abstract
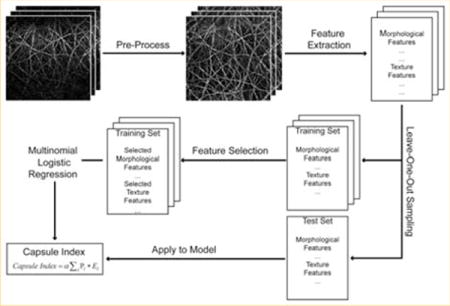
Liver surface is covered by a collagenous layer called the Glisson’s capsule. The structure of the Glisson’s capsule is barely seen in the biopsy samples for histology assessment, thus the changes of the collagen network from the Glisson’s capsule during the liver disease progression are not well studied. In this report, we investigated whether non-linear optical imaging of the Glisson’s capsule at liver surface would yield sufficient information to allow quantitative staging of liver fibrosis. In contrast to conventional tissue sections whereby tissues are cut perpendicular to the liver surface and interior information from the liver biopsy samples were used, we have established a capsule index based on significant parameters extracted from the second harmonic generation (SHG) microscopy images of capsule collagen from anterior surface of rat livers. Thioacetamide (TAA) induced liver fibrosis animal models was used in this study. The capsule index is capable of differentiating different fibrosis stages, with area under receiver operating characteristics curve (AUC) up to 0.91, making it possible to quantitatively stage liver fibrosis via liver surface imaging potentially with endomicroscopy.
Keywords: Liver fibrosis, second harmonic generation, bioimaging, diagnosis, Glisson’s capsule, endomicroscopy, image analysis, classification
Graphical abstract
1. Introduction
Liver fibrosis is associated with the excessive accumulation of collagen in the extra-cellular matrices of the liver, which occurs in chronic liver diseases that affect millions of people worldwide causing high morbidity and mortality rates [1]. Hence, much effort has been placed in developing markers for staging and grading fibrosis, evaluating anti-fibrotic drug efficacy, and predicting fibrosis progression, regression and liver de-compensation [2]. Liver biopsy is the gold standard for staging liver fibrosis in patients with chronic liver diseases [3]. However, it has several disadvantages such as being invasive, providing poor sampling volume, and inter-/intra-pathologist staging variations [4]. Most importantly, repeated biopsies for monitoring disease status and efficacy of treatment are painful for patients, and risk other complications [5].
To overcome these problems, various non-invasive diagnostic tools are proposed ranging from advanced medical imaging modalities to serum biomarker assays [6]. Nevertheless, ultrasound and magnetic resonance imaging (MRI) [7] cannot identify early and mild fibrosis stages due to their limitations in image resolution [8]. Liver stiffness measurement using transient ultrasound elastography (Fibroscan) [9, 10] or magnetic resonance elastography (MRE) [11, 12] provide no cellular and tissue level information; and their performance in fibrosis evaluation are still under validation [13, 14]. The accuracy of serum biomarkers to predict fibrosis progression is also reported to be unsatisfactory since these biomarkers are indirect expression of liver fibrosis process and are easily affected by other factors such as systemic inflammation [15, 16]. We have previously found that surrogate histological markers such as collagen proportionate area (CPA) in liver sub-capsule region are consistent with those measured in liver interior and are well-correlated with fibrosis [17]. Hence, we envision the possibility of liver surface scanning to complement the conventional liver biopsy based assessment, with the advance in endomicroscopy and laparoscopic surgical techniques [18], in most of the scenarios in routine clinical practice where liver biopsy is needed for fibrosis assessment, such as the prognostic of fibrosis progression and regression for treatment planning and evaluation of treatment efficacy.
Liver surface is covered by a collagenous layer called the Glisson’s capsule [19]. The thickness of the Glisson’s capsule has been reported to increase during fibrosis progression [17, 20] as imaged from the biopsied liver tissue sections perpendicular to the liver surfaces, which does not reflect the overall structural changes of the collagen in the Glisson’s capsule. The histo-pathological features that are used in routine semi-quantitative scoring systems [21–23] by pathologists to stage liver fibrosis are also derived from the cellular and tissue structures in the liver interior that cannot be observed on the liver surface. To investigate the feasibility of liver surface scanning for scoring fibrosis, we would need to extract all relevant liver surface features, especially on the Glisson’s capsule which is essentially bundles of collagen fibers [24]. Second harmonic imaging (SHG) is a powerful tool for visualization and quantification of collagen fibers in various tissue states including liver fibrosis [25–28]. As the capsule collagen is the outer-most layer wrapping the entire liver; and it generates appreciable backward second harmonic signals, SHG imaging in reflective mode can be employed for stain-free quantitative imaging of the liver surface. It would also be possible to image larger areas of the liver surface as the limited sampling volume often causes errors in fibrosis scoring [29, 30].
In this study, we have imaged the liver surfaces from 40 rats of thioacetamide (TAA) induced fibrosis model, which represents parenchymal fibrosis [31,32], using reflective second harmonic (R-SHG) imaging. Image analysis was performed to extract 125 features that characterize the morphology and texture of the collagen network of the Glisson’s capsule. These features, together with the capsule thickness, were combined to build one single index – capsule index by multinomial logistic regression (MNL) after feature selection. Good performance is found for the detection of fibrosis at different stages by capsule index, enabling liver surface scanning as a viable tool for liver fibrosis assessment.
2. Materials and methods
2.1 Animal and tissue sample preparations
Male Wistar rats at an average weight of 220 g were housed two per cage in the Biological Resource Centre (BRC) of Biopolis, A*STAR with free access to laboratory chow and water in a 12:12 h light/dark schedule. The Institutional Animal Care and Use Committee (IACUC), Biological Resource Centre, Agency for Science, Technology and Research, Singapore approved all animals-related experiments.
Thirty-five rats were randomly separated into seven groups, and a group of five as control rats. These were treated with thioacetamide (TAA) 200 mg/kg by intraperitoneal injection three times a week for 14 weeks to induce liver fibrosis. The 35 rats in the TAA-treated group were sacrificed at time-points of 2, 4, 6, 8, 10, 12, and 14 weeks (n = 5 per week). 5 rats of the control group were also sacrificed at week 0, without treatment. Cardiac perfusion with 4% paraformaldehyde was performed to flush out blood cells and the liver was fixed before harvesting.
The left lobe of each liver was used for imaging, as there were no differences of the features extracted from the capsule and sub-capsule regions between the left and right lobe of the same liver [17]. The volume of left lobe of liver decreased in the course of fibrosis progression in the TAA model (stage 0: 4.1 ± 0.2 cm3, stage 1: 3.6 ± 0.6 cm3, stage 2: 3.1 ± 0.6 cm3, stage 3: 2.7 ± 0.5 cm3, stage 4: 1.9 ± 0.4 cm3).
2.2 Image acquisition
The non-linear optical microscope was developed based on a multiphoton and confocal imaging system (LSM510Meta, Carl Zeiss, Heidelberg, Germany) using an external tunable mode-locked Ti : Sapphire laser (Mai-Tai broadband, Spectra-Physics, USA). A schematic of the set-up is shown in Figure 1, where the laser was passed through a pulse compressor (Femtocontrol, APE GmbH, Berlin, Germany) and an acousto-optic modulator (AOM) for group velocity dispersion compensation and power attenuation, respectively. Laser was then routed by a dichroic mirror (reflect >700 nm, transmit <543 nm), through an objective lens (plan-neofluar, 20×, NA = 0.5, Carl Zeiss, Heidelberg, Germany), to the tissue specimen. The average power after the objective lens is ~80 mW. The excitation wavelength that was used in the study is 900 nm. Two-photon excitation fluorescence microscopy (TPEF) signals in the epi-direction was collected by the same objective lens and recorded by a photo-multiplier tube (PMT, Hamamatsu R6357, Tokyo, Japan), after passing through the dichroic mirror (reflect <490 nm, transmit >490 nm) and a 500–550 nm band-pass (BP) filter. SHG signals were collected similarly but with a 390–465 nm band-pass filter before reaching the PMT.
Figure 1.
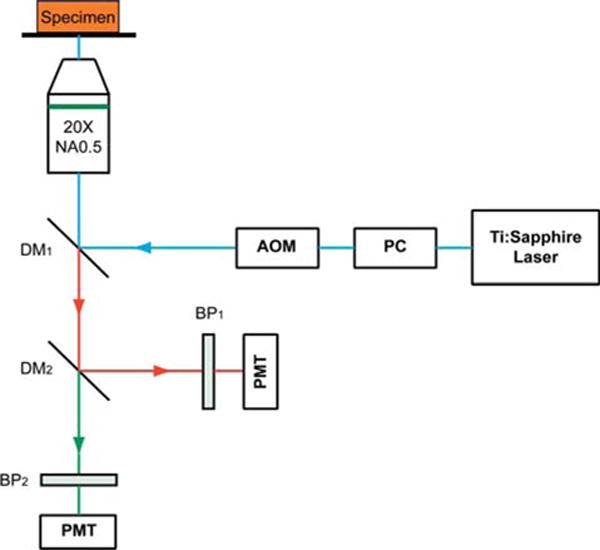
Schematic illustration of the optical set-up. Excitation laser was a tunable mode-locked Ti : Sapphire laser (710 nm to 990 nm set at 900 nm) with a pulse compressor (PC) for dispersion compensation and an acousto-optic modulator (AOM) for power control. The laser passed through a dichroic mirror, DM1, an objective lens (20×, NA = 0.5), before reaching the tissue specimen. Two-photon excited fluorescence (TPEF) was collected by the objective lens in the epi-mode, filtered by a 500–550 nm band-pass filter, BP1, before being recorded by a photomultiplier tube (PMT). Reflective second harmonic generation (SHG) signal was similarly collected as TPEF, through a 390–465 nm band-pass filter, BP2, with another PMT.
The detector gain and amplifier gain and offset settings of the photomultiplier tube of our system were optimized to eliminate under- or over-saturation. Noise floor was typically around 200 intensity counts. The number of pixels per image plane was fixed at 1024 by 1024 for varying depths into the tissue with a 12-bit data depth. A z-stack of TPEF and SHG images were taken at 10 randomly selected sites on the anterior surface of the left lobe of each liver sample with a field of view of 450 μm by 450 μm and 20 optical sections with 1 μm depth between each section. Time taken to image a typical 450 μm by 450 μm by 20 μm z-stack is about 100 seconds (1024 by 1024 pixels per plane with a spot dwell time of 3.2 × 10⁻⁶ seconds). Hence, imaging 10 random sites would need 1000 seconds (about 17 minutes) per sample without considering the time taken in between stage movement and re-focusing. Images were acquired 3 days after formalin fixation of the harvested livers so as to allow stable cross-links to form and the morphology be preserved.
For comparison with conventional histopathology scoring, 5 μm thick tissue slices were sectioned from each liver sample, the biopsy spot being within 0.5 cm radius of the imaged sites, stained with Masson Trichrome (MT) stain kit (ChromaView advanced testing, #87019, Richard-Allan Scientific) and imaged with bright-field microscopy (Aperio Digital Pathology Environment).
2.3 Histo-pathological scoring
Each sample was scored by a pathologist based on blind reading of the MT image to reduce any bias using Metavir score (21). In the Metavir scoring system, liver fibrosis was classified into five stages from F0 to F4 according to the severity of fibrosis: no fibrosis, fibrous portal expansion, few bridges or septa, numerous bridges or septa, and cirrhosis (33). The number of samples belonging to each stage is: 5 F0, 4 F1, 8 F2, 9 F3 and 14 F4.
2.4 Image analysis and feature extraction
An image analysis system (Figure 2) was developed to quantify capsule index, a continuous measurement of the Glisson’s capsule, to stage liver fibrosis. Each image stack of a site on the anterior surface of the sample was first rotated and the maximum intensity projection (MIP) [34] was performed along the z-direction to generate a two-dimensional (2D) image which is a good representation of the Glisson’s capsule in the original image stack, in order to save computation time and cost in further processing. The 2D capsule image was then segmented and 125 features were extracted, followed by feature selection to identify the most significant measurements for monitoring fibrosis progression. A multinomial logistic regression model [35] was trained using the selected features, and the capsule index was calculated by applying the measurements from the image to the trained regression model. The details of each step are described as follows.
Figure 2.
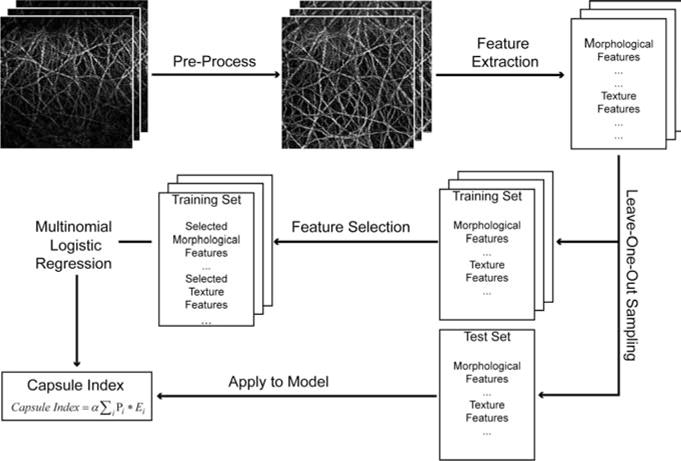
Schematic illustration of the procedures to create capsule index. Most significant parameters were selected from all the morphological and texture features extracted from the pre-processed capsule image to build a multinomial logistic regression model, which was used to create capsule index.
2.4.1 Image pre-processing
To reduce computation time and cost for image segmentation and feature extraction, the original three-dimensional (3D) image z-stack was rendered by a 2D representative image. Since the liver surface was not always perpendicular to the z-direction of the image stack, the 3D stack was rotated first. To identify the rotation angle, MIP was first performed along the y-direction (Figure 3A) and the centerline of the capsule was recognized by extracting the maximum intensity pixels along the z-direction in x-z images, after which the stack was rotated around the y-axis by the degree θ calculated from the angle between the centerline and the z-axis (Figure 3D). Similar procedure was performed to rotate the stack around the x-axis; where MIP was applied along x-direction and the rotation angle was identified from the angle between the centerline and the y-axis (Figure 3B, E). MIP was finally applied to the rotated image stack along z-direction to generate the representative 2D image (Figure 3C, F). As the Glisson’s capsule was generally less than 20 μm thick in z-direction only, the projected image contained most of the structure and architectural information of the 3D image stack and hence, it is a good representation of the Glisson’s capsule.
Figure 3.
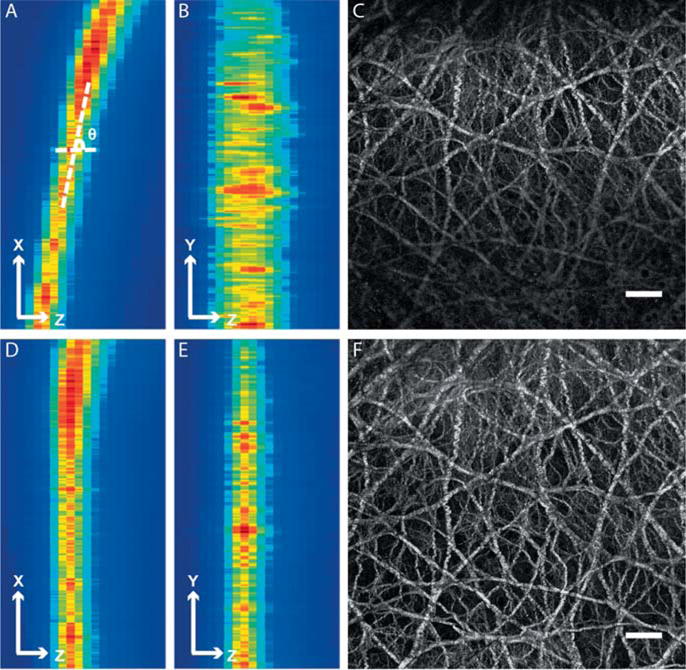
Comparison between the Glisson’s capsule images before and after pre-processing. (A) Maximum intensity projection (MIP) of the image stack along y-direction before pre-processing. The rotation angle was defined as the angle between x-axis and the centerline of the band with high pixel intensities. (B) MIP of the image stack along x-direction before pre-processing. (C) The 2D representative image of the image stack before pre-processing. The scale bar represents 50 μm. (D) MIP of the image stack along y-direction after pre-processing. (E) MIP of the image stack along x-direction after pre-processing. (F) The 2D representative image of the image stack after pre-processing. The scale bar is 50 μm. The pixel intensity distribution is more uniform in the representative 2D image after pre-processing.
2.4.2 Capsule feature extraction
2.4.2.1 Morphological features
To trace each collagen fiber from the network and extract morphological features, we use the existing skeletonization based method to extract the centerlines of the collagen fibers, and adopt a gap filling method to connect broken fiber ends.
The 2D SHG image (Figure 4A) was first filtered by the Frangi filter [36] to enhance the collagen structures from the noisy background. Although the Frangi filter is originally designed for vessel enhancement, it could be extended to the applications of any tubular/linear structures such as neuron [37]. Thus, it is also appropriated to be used for collagen structure enhancement. Different scales of the Gaussian kernel with σ from 1 to 8 were used in the Frangi filter and the intensity of each pixel in the filtered image was assigned the maximum output value of the Frangi filter among all the scales assessed. The filtered image was shown in Figure 4B.
Figure 4.
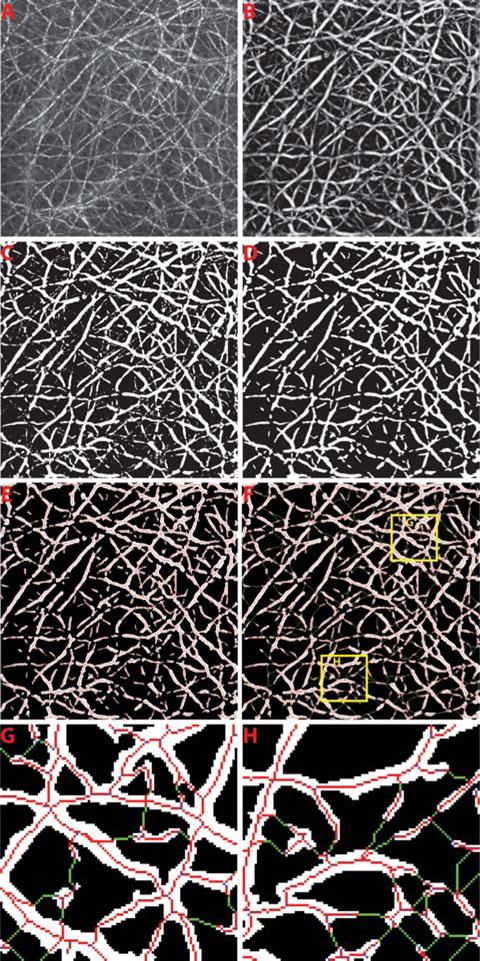
The illustration of image processing to trace collagen fibers from the collagen network. The raw capsule image is shown in (A). The enhanced image after Frangi filtering is shown in (B). The binary image after collagen segmentation is presented in (C). (D) shows the final segmented image of collagen after morphological operations to remove the small objects. The initial skeletons of each collagen segment are shown in (E). (F) The gap filling method was performed to finally connect the broken collagen fibers where the connected pixels are shown in green. Two regions-of-interest are shown for example in (G) and (H).
The enhanced image after Frangi filtering was segmented into collagen and background by using a segmentation algorithm based on Gaussian mixture models [38], which was shown to be more accurate than other methods such as global thresholding and clustering methods [39] (Figure 4C). The morphological closing was then performed to smooth the binary mask of the collagen and any segment with less than 5 pixels was removed (Figure 4D).
The initial centerlines of the binary mask of the segmented collagen were extracted by skeletonization (Figure 4E). Since the boundaries of the segmented collagen areas are usually noisy, the classic skeletonization methods based on morphological thinning are not appropriated as the skeletons extracted could be affected by spurious branches. We implemented a skeletonization method proposed by Telea et al. [40] which uses Fast Marching Method (FMM) to evolve the boundary towards inside of the collagen area by assigning a U value to each pixel accordingly. It assumes that the collapsed points on the front of boundary during the propagation would be the skeleton points, which has larger differences of U values between its neighbors. Thus, we set a threshold as 10% of the maximum U value difference in each collagen segment which gave satisfactory results for identification of skeleton points in collagen segments with different sizes. The thinning processing was further performed if the identified skeleton is not one-pixel in width.
The skeletons were vectorized and represented by a graph G = (V, E), where each vertex vi ∈ V is a point on the skeleton and each edge ek = (vi, vj) ∈ E connects two neighboring vertexes on the skeleton. The vertexes were further identified into three types (end points, curve points and branch points) based on the number of their neighboring vertexes:
Before we trace each of the collagen fiber from graph G, it is necessary to adopt a gap-filling algorithm to preserve the real collagen network topology. As the collagen network topology is strongly affected by the discontinuities of the segmented collagen fibers due to the influence of noise, the gaps are formed between the closest discontinuous collagen fibers that affect the accuracy of the following quantification of collagen network features.
A direction profile was first established for each end point in the skeletons, which uses a plurality of directions in its circular neighborhood with radius defined as 5 times of the shortest distance from the end point to the background. In the neighborhood, the direction profile is defined as the average squared intensity deviation with respect to the directions to the particular point. It is assumed that, along the direction where a tubular structure existed, the variation of intensity should be low. Hence, the local minimums were identified from the direction profile and considered as the directions of the potential gaps. Searching through each of these directions detected, we found the nearest end point or branch point belonging to the skeleton of another collagen segment as the other end of the gap and connected them accordingly (Figure 4F–H).
To trace each fiber in the graph G, we started from each end point through the connecting curve points towards another end point or branch point. If another end point was reached, a complete fiber was traced and updated in the fiber list. Otherwise, the fiber was stored as an incomplete fiber for further processing. We next started from each branch point through the connecting curve points towards another branch point and updated in the incomplete fiber list as well. For all the incomplete fibers that share the same branch point as one end, they were connected if the difference of the orientation of these two incomplete fibers is smaller than a threshold of 60 degrees. The connected incomplete fibers were finally updated in the complete fiber list. The short fibers would be removed since they are likely the false branches from the skeleton of collagen fibers. A fiber will be considered as the candidate of short fiber to be deleted if at least one end is a branch point. The threshold was set as 5 pixels to delete all candidates shorter than this. Finally, 16 features were extracted to represent morphologies of fibers and geometrical distributions of collagen network, which are described in Table 1.
Table 1.
Summarization of all 125 features extracted.
| No. | Feature Descriptions |
|---|---|
| Morphological Features | |
| 1 | Number of fibers |
| 2 | Number of cross-links |
| 3–4 | Mean and variation of the size of pores |
| 5 | Number of pores |
| 6–7 | Mean and variation of fiber length |
| 8–9 | Mean and variation of fiber width |
| 10 | Amount of collagen |
| 11–12 | Mean and variation of cross-link spaces |
| 13–14 | Mean and variation of cross-link densities |
| 15–16 | Mean and variation of the straightness of fibers |
| Texture Features | |
| 17–28 | Contrast, correlation, energy and homogeneity from the GLCM given three different pixel distances at two, four and eight pixels |
| 29–34 | Energy, entropy, mean, standard deviation, third moment and fourth moment of the coefficients from Fourier transform |
| 35–94 | Energy, entropy, mean, standard deviation, third moment and fourth moment of the wavelet decomposition coefficients from ten sub-images generated by Daubechies wavelet transform |
| 95–124 | Energy, entropy, mean, standard deviation, third moment and fourth moment of the magnitude of the convolution over the image with Gabor filter at five scales |
| 3D Feature | |
| 125 | Capsule thickness |
2.4.2.2 Texture features
A total of 108 texture features including gray-level co-occurrence matrix (GLCM) based features [41], Daubechies wavelet transform based features [42], Gabor filters based features [43] and Fourier transform based features [44] were extracted.
We calculated contrast, correlation, energy and homogeneity [41] from the GLCM with three different pixel distances of two, four and eight, where the distance between the pixel of interest and its neighbor to create the co-occurrence. At each pixel distance, each feature was the average of the same measurement calculated at four different directions at 0, 45, 90, 135 degrees from the GLCM.
A three-level Daubechies wavelet transform was preformed to generate ten sub-images from the original image, after which energy, entropy, mean, standard deviation, third moment and fourth moment [42] of the wavelet decomposition coefficients were calculated for each sub-image.
To calculate Gabor wavelet transform features, the original image was initially convolved with a Gabor filter with five wavelet scales and six filter orientations. Energy, entropy, mean, standard deviation, third moment and fourth moment [43] of the magnitude of the convolution over the image at each scale were then calculated by averaging each measurement from six orientations at the same scale.
Fourier transformation was performed on the original image and energy, entropy, mean, standard deviation, third moment and fourth moment of the coefficients were calculated.
2.4.2.3 Capsule thickness
The capsule thickness was calculated from the rotated image stack before the MIP was performed. The thickness was defined as the width of the band with high pixel intensities in the x-z or y-z image (Figure 3) and quantified as described previously [17].
The mean and the standard error of mean (SEM) values of all 125 features from the TAA model are shown in Supplementary Table 1.
2.4.3 Feature selection
Feature selection was applied to recognize the best subset among all 125 features that are the most relevant to fibrosis progression. Support vector machine recursive feature elimination (SVMRFE) approach [45] was first adopted to rank all the features. SVMRFE was introduced as a multivariate feature ranking method that uses SVM weights as the ranking criterion of features. Starting from using all the features, a SVM was trained and features were sorted by the absolute value of their weight in the hyper-plane. The feature with the smallest weight was least important and was eliminated from the feature set and a SVM was trained again using the new feature set after elimination, this process was performed iteratively until all the features had been removed. All the features were hence ranked during this recursive elimination procedure.
The diversities were generated on the training set by the bootstrapping method [46], after which SVMRFE was applied on each of these bootstrap samples and a diverse set of feature rankings was obtained. The ensemble rankings of all the features were aggregated by summing the ranks over all bootstrap samples [47] for each feature. Different numbers of the features were selected according to the ensemble rankings from the top order to train a SVM on the bootstrap samples and be evaluated on the out-of-bag samples based on the area under the receiver operating characteristic curve (AUC) [48], which was a measure of test performance. The subset of the features that lead to the highest AUC among all was finally selected.
2.4.4 Sample classification
A leave-one-out cross-validation approach was adopted, where one sample was used as the test set to calculate capsule index while all other samples were used for training. MNL model [35] was used for the training set with selected features to predict the probabilities of all the stages from 0 to 4 for the test sample. MNL is a generalization of normal logistic regression by allowing more than two discrete outcomes that were appropriate, as we need to classify each image into one of the five stages. We then combined the probabilities of each stage for the test sample into the capsule index by the equation as follows:
where pi is the probability of stage i, Ei = i is the expectation value of each stage i and α is a scale factor to normalize the capsule index into certain range. α was set to 0.25 in our study so that the capsule index is a continuous measurement ranging from 0 to 1.
All image processing and statistical learning algorithms were developed and performed using Matlab (The Math Works, Inc., Natick, Massachusetts).
3. Results and discussions
3.1 Reflective SHG reveals collagen architectures of the Glisson’s capsule
TPEF/SHG microscopy on unstained samples is a good substitute for conventional histological imaging of liver fibrosis where most of the important features used in scoring system can be observed [27, 28]. A Masson Trichrome (MT) stained image of a normal liver which contains minimal collagen within portal tracts and around central veins is shown in Figure 5A. Similar collagen patterns were observed in the TPEF/SHG image of the same location (Figure 5B). In a late stage fibrotic liver of the TAA model, the collagen patterns changed significantly where broad complete septa are formed between portal areas, and between portal areas and central veins. These changes can be clearly identified in both MT stained (Figure 5D) and TPEF/SHG images (Figure 5E).
Figure 5.
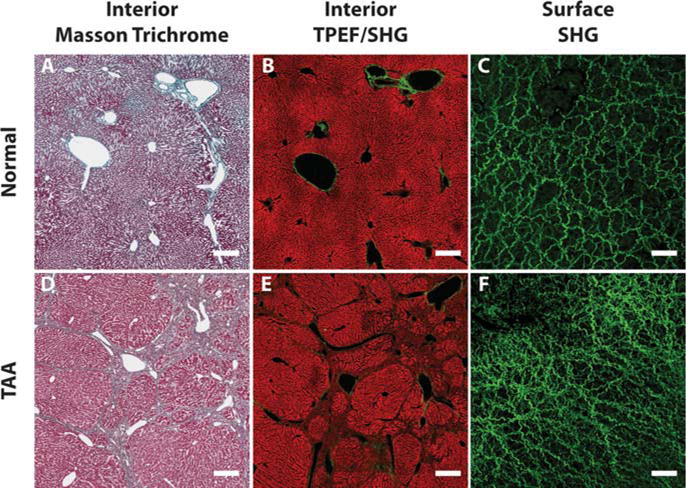
Comparisons between liver interior images and liver surface images. (A) to (C) are Masson Trichrome stained interior image, TPEF/SHG interior image and SHG surface image from a normal liver, respectively. Same morphologies and structures of collagen and cells can be observed in liver interior images from both conventional staining and TPEF/SHG microscopy. The TPEF signals come from intrinsic molecules such as reduced nucleotide (NAD(P)H) and oxidized flavoproteins (Fp) which reveals the morphology of hepatocytes and cell necrosis in the liver. However, the collagen structures are totally different on the liver surface. (D) to (F) are interior and surface images from a late stage fibrotic liver of the TAA model. Both Masson Trichrome stained and TPEF/SHG interior images show the same collagen architecture changes as the bridging between portal tracts and veins. Different collagen structure changes are found on surface image, where capsule collagen fibers are denser and with smaller spaces between than normal liver. The scale bar represents 100 μm for interior images and 50 μm for surface images.
None of the pathological features related to the cellular and collagen structures in the interior of the liver showed up in the Glisson’s capsule as the outermost layer of the liver. Reflective SHG microscopy used to scan the front surface of the livers from the TAA model successfully revealed collagen network architectures of the Glisson’s capsule. In the capsule layer of the normal liver (Figure 5C), capsule collagen fibers or fibrous bundles are dense with wavy sub-filament structures. In fibrotic liver of the TAA model (Figure 5F), the capsule collagen fibers or fibrous bundles are denser than that of the normal liver and the spaces in between the fibers or bundles are smaller. The fibers are straight with loss of curry sub-filament structures and spaces between the fiber bundles are larger than the normal liver. These structural changes are likely due to the dramatic alteration of liver mechanical properties because of increased extracellular matrix (ECM) deposition and portal hypertension, which in turn affect the cellular and tissue functions or structures [49, 50].
The capsule images of the normal and fibrotic livers were shown at different imaging depth from 0 to 16 μm in Figure 6. The morphology of collagen network is consistent in the images at different depth. Thus, the 2D image generated by MIP from the z-stack image is well representative of the entire collagen network of the Glisson’s capsule and is valid for the further quantification.
Figure 6.

Illustration of SHG images at different imaging depth from the top of the Glisson’s capsule. The morphology and structure of collagen network are consistent at different imaging depth.
3.2 Quantitative assessment of liver fibrosis by capsule index
In the feature selection process, the important features should have higher frequencies since they tend to be selected more often no matter how the training set changes. The frequency of the features selected from all measurements to build the regression model in the TAA models were shown in Supplementary Figure 1. It is important to fine-tune capsule index in liver diseases of different etiologies by building the specific multinomial logistic regression model for each disease with proper training set of capsule images. One advantage of the proposed framework to calculate capsule index in this study is that the rule of combination of various features to create the index was automatically learned from the training set using the pathology scores as the ground-truth. The selected features are shown in Supplementary Table 2, which gives the best performance of classification.
The Capsule index values of the TAA rat models samples at different Metavir stages are shown in Figure 7. The Metavir scores were assigned by an experienced pathologist from reading the MT stained slices of the interior of the same liver of which the surface was scanned. We also presented the capsule thickness and collagen proportionate area (CPA) quantified from the capsule images at different fibrosis stages for the comparison.
Figure 7.
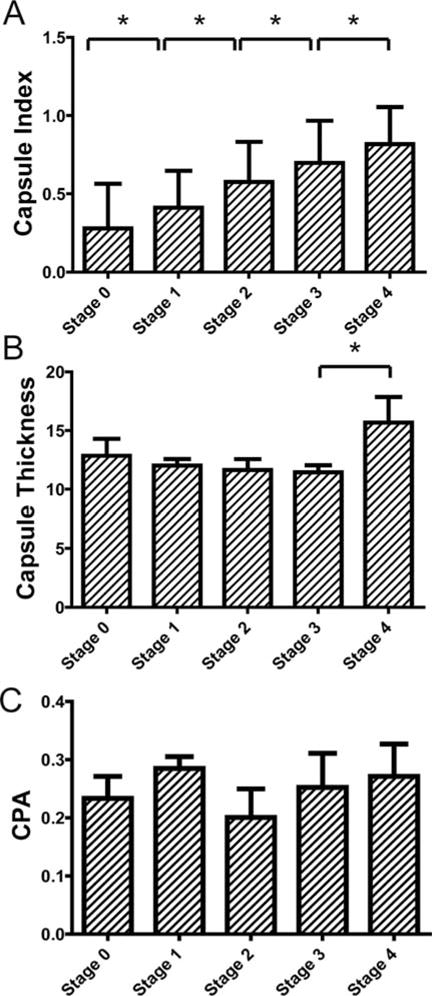
Validation of capsule index with conventional histopathology scoring system for the thioacetamide (TAA) model. Comparison between scoring results from conventional histo-pathological scoring system against capsule index were shown in (A). An increasing trend of capsule index was clearly observed along the fibrosis progression for both models. One-way ANOVA was done (p < 0.001) to show that capsule index of at least two stages are significantly different. The pair-wise comparisons show that the capsule index between every two stages is significantly different. (B) shows the capsule thickness of the TAA model for different stages. (C) shows the collagen proportionate area (CPA) of the TAA model for different fibrosis stages. No trends were observed along fibrosis progression for capsule thickness and CPA.
In the TAA model, an increasing trend of the capsule index could be observed with fibrosis progression (Figure 7A). One-way ANOVA indicated that the means of the capsule index of each stage were not all equal (p < 0.0001). Further analysis revealed that the capsule index could differentiate between all fibrosis stages. On the other hand, capsule thickness decreased until stage 3 and a sharp increase was observed in the late stage. No significant differences were found between stages from 0 to 3 in the TAA model for capsule thickness (Figure 7B). No trend was observed for CPA along the fibrosis progression (Figure 7C).
These results showed that the conventional quantification of the Glisson’s capsule by measuring capsule thickness was not sufficient to accurately monitor fibrosis progression. CPA was useful to quantify fibrosis progression in the liver interior [28]; however, it is not a good indicator for liver fibrosis assessment from the surface.
3.3 Capsule index can detect liver fibrosis at different stages
The performance of capsule index for detection of fibrosis at different stages was evaluated with receiver operating characteristics curve (ROC) analysis. The larger area under the ROC curve (AUC) indicates the better sensitivity and specificity for the detection of certain stages. The AUC of 0.5 represents a random classification.
For the detection of fibrotic samples against normal samples (stage 0 versus. stages 1–4,), the AUC of capsule index was 0.80 for the TAA model, and were significantly higher than 0.5 (Figure 8A, p < 0.001). The AUCs of capsule thickness and CPA were 0.53 and 0.65 for the TAA model. Since these AUCs were not significantly higher than 0.5, both capsule thickness and CPA failed to differentiate between normal and fibrotic samples.
Figure 8.
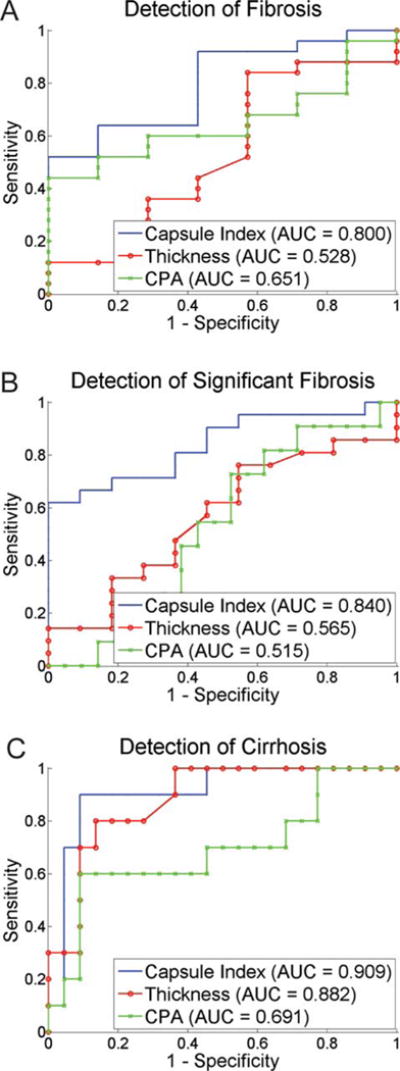
Receiver operating characteristics curve (ROC) analysis of capsule index to demonstrate performance for fibrosis detection at different stages. For the detection of fibrosis (stage 0 versus stages 1–4), significant fibrosis (stages 0–1 versus stages 2–4) and cirrhosis (stages 0–3 versus stage 4), capsule index performs better than capsule thickness and collagen proportionate area (CPA) with area under ROC (AUC) from 0.72 to 0.91.
The detection of significant fibrosis (stages 2–4) versus non-significant fibrosis (stages 0–1) is critical for assessing the need of antiviral therapies [51]. Capsule index achieved AUCs at 0.84 for detection of significant fibrosis in the TAA models (Figure 8B). The best cut-off value was 0.52 for the TAA model with 81.8% sensitivity and 71.4% specificity. The AUCs of capsule thickness and CPA were smaller (0.52–0.69).
The detection of cirrhosis (stage 4) versus non-cirrhosis (stages 0–3) is also an important indication for the end stage of fibrosis progression which has the higher risk of developing liver cancer such as hepatocellular carcinoma [51]. The AUCs of capsule index was 0.91 for the detection of cirrhosis in the TAA model (Figure 8C). The best cut-off value was 0.62 for the TAA model with 90.9% sensitivity and 90.0% specificity. The capsule thickness can detect cirrhosis well in the TAA model with the AUC at 0.88. The performance of CPA was as not good as capsule index with lower AUCs (0.69).
Thus, capsule index can monitor the liver fibrosis progression in the TAA model, and can detect liver fibrosis at different stages with reasonable sensitivity and specificity. The superiority of the capsule index over the capsule thickness and CPA for fibrosis staging comes from the detailed collagen network structure imaged by reflective SHG microscopy and quantified by our image analysis algorithm. Capsule collagen structures are highly correlated with the fibrosis progression.
The TAA animal model has similar characteristics as viral hepatitis in humans [52], such as hepatitis B and C which are the leading and important targets for fibrosis assessment in chronic liver diseases (CLDs). The good performance of capsule index to detect different fibrosis stages in the TAA model (AUC: 0.80–0.91) showed that it is a useful marker for prognosis of fibrosis progression and regression for treatment evaluation in CLDs. Furthermore, we have previously demonstrated the correlation of sub-capsular features to the interior liver features and the correlation of sub-capsular features to fibrosis stages [17]. Hence, it would be beneficial to further investigate the sub-capsular collagen and cellular information beneath the Glisson’s capsule to improve the sensitivity and specificity of the capsule index for the detection of liver fibrosis at different stages. We have previously demonstrated the use of scale-invariant feature transform (SIFT) for staging liver diseases from sub-capsular TPEF images [53] which can be potentially used together with the Capsule index method proposed in this study under the statistical framework of supervised learning from multiple classifiers such as proposed in [54].
Translation of the TPEF/SHG microscopy into potential clinical applications in vivo requires the establishment of minimally invasive diagnostic imaging tools. Recent studies have reported the development of nonlinear endoscopy technology and their applications for imaging in different organs, such as kidney, liver, lung, colon and cervix [55–60]. Nonlinear endoscope is capable of acquiring images with distinct features that are similar in the images acquired by conventional nonlinear microscope. The imaging condition of the nonlinear endocscope system is similar to that used in this study, for example a 20 × 0.4 NA objective lens with a field-of-view of 110 μm in diameter was used in [56]. The size of field-of-view using an endoscopy system could be further increased to the size of 440 μm in diameter which is comparable to the conventional bench-top nonlinear microscope [61]. Hence, we foresee that similar collagen network images can be acquired for the Glisson’s capsule by SHG endoscopes that would yield a similar framework to quantify capsule index to differentiate different stages of liver fibrosis for scoring. On the other hand, since the features used in the proposed image classification methods are not scale-invariant, the system needs to be re-trained with training images of the same imaging condition as the test images for the potential application of such method using endoscope images with different field-of-view or spatial resolution. It should also be noted that endoscopy is still a minimal invasive procedure thus its potential application needs to be further investigated. Another necessary study is to address some of the critical issues in real practice, such as the minimized number of focal spots to be imaged using the endoscopy to achieve the satisfied performance from the analysis.
4. Conclusions
We proposed and validated a quantification system, capsule index, for liver fibrosis assessment from liver surface reflective SHG imaging. We demonstrated the advantage of imaging the Glisson’s capsule using reflective SHG, which can accurately reveal the architecture of liver capsule collagen network. Image analysis methods were developed to extract plenary morphology, structure and texture features from capsule collagen network. We also presented a statistical framework to select the most important measurements from all the extracted features and to combine the selected measurements into one index. Capsule index values were compared with conventional histopathology scoring system for the TAA model, and good correlations were established. The results indicate that capsule index was able to differentiate different fibrosis stages with good performance. We have established the feasibility of liver fibrosis staging and diagnosis from scanning the liver surface in a less invasive manner. This would also provide us the potential to image larger sampling area than from biopsy and extract enough information, over many time-points for a long period of time, for liver fibrosis monitoring without the complication brought forth by the current gold standard of the invasive liver biopsy. Thus, in the near future, liver surface scanning with SHG endomicroscopy could possibly replace liver biopsy in the clinical practice for the sole purpose of fibrosis assessment critical in making clinical decisions on many chronic liver diseases.
Supplementary Material
Acknowledgments
The authors would like to thank Dr. Piyushkumar Mundra from Bioinformatics Research Center, NTU for the discussion about feature selection and statistical analysis. This work is supported in part by the National Research Foundation Singapore, through the Singapore MIT Alliance for Research and Technology (SMART) Centre’s BioSyM IRG research program to PS and HY, the Institute of Bioengineering and Nanotechnology, Biomedical Research Council, A*STAR; grants from Janssen, and Mechanobiology Institute, Singapore to HY, the National Natural Science Foundation of China (61275006 and 61335011) and the Natural Science Foundation for Distinguished Young Scholars of Fujian Province (2014J06016) to SZ. SZ is a SMART postdoctoral fellow.
Footnotes
Supporting Information
Additional supporting information may be found in the online version of this article at the publisher’s website.
Author biographies: Please see Supporting Information online.
Copyright of Journal of Biophotonics is the property of Wiley-Blackwell and its content may not be copied or emailed to multiple sites or posted to a listserv without the copyright holder’s express written permission. However, users may print, download, or email articles for individual use.
References
- 1.Bataller R, Brenner DA. J Clin Invest. 2005;115(2):209–218. doi: 10.1172/JCI24282. [DOI] [PMC free article] [PubMed] [Google Scholar]
- 2.Friedman SL. Nature Reviews Gastroenterology and Hepatology. 2010;7(8):425–436. doi: 10.1038/nrgastro.2010.97. [DOI] [PubMed] [Google Scholar]
- 3.Rockey DC, Caldwell SH, Goodman ZD, Nelson RC, Smith AD. Hepatology. 2008;49(3):1017–1044. doi: 10.1002/hep.22742. [DOI] [PubMed] [Google Scholar]
- 4.Standish R, Cholongitas E, Dhillon A, Burroughs A, Dhillon A. Gut. 2006;55(4):569–578. doi: 10.1136/gut.2005.084475. [DOI] [PMC free article] [PubMed] [Google Scholar]
- 5.Carey E, Carey WD. Cleveland Clinic journal of medicine. 2010;77(8):519–527. doi: 10.3949/ccjm.77a.09138. [DOI] [PubMed] [Google Scholar]
- 6.Martínez SM, Crespo G, Navasa M, Forns X. Hepatology. 2011;53(1):325–335. doi: 10.1002/hep.24013. [DOI] [PubMed] [Google Scholar]
- 7.Taouli B, Ehman RL, Reeder SB. American Journal of Roentgenology. 2009;193(1):14–27. doi: 10.2214/AJR.09.2601. [DOI] [PMC free article] [PubMed] [Google Scholar]
- 8.Choong C, Venkatesh SK, Siew E. Journal of Clinical Imaging Science. 2012;2(1):58. doi: 10.4103/2156-7514.101000. [DOI] [PMC free article] [PubMed] [Google Scholar]
- 9.Ziol M, Handra-Luca A, Kettaneh A, Christidis C, Mal F, Kazemi F, de Lédinghen V, Marcellin P, Dhumeaux D, Trinchet JC. Hepatology. 2004;41(1):48–54. doi: 10.1002/hep.20506. [DOI] [PubMed] [Google Scholar]
- 10.Friedrich-Rust M, Ong MF, Martens S, Sarrazin C, Bojunga J, Zeuzem S, Herrmann E. Gastroenterology. 2008;134(4):960–974.e968. doi: 10.1053/j.gastro.2008.01.034. [DOI] [PubMed] [Google Scholar]
- 11.Rouvière O, Yin M, Dresner MA, Rossman PJ, Burgart LJ, Fidler JL, Ehman RL. Radiology. 2006;240(2):440–448. doi: 10.1148/radiol.2402050606. [DOI] [PubMed] [Google Scholar]
- 12.Huwart L, Sempoux C, Vicaut E, Salameh N, Annet L, Danse E, Peeters F, ter Beek LC, Rahier J, Sinkus R. Gastroenterology. 2008;135(1):32. doi: 10.1053/j.gastro.2008.03.076. [DOI] [PubMed] [Google Scholar]
- 13.Shaheen AAM, Wan AF, Myers RP. The American journal of gastroenterology. 2007;102(11):2589–2600. doi: 10.1111/j.1572-0241.2007.01466.x. [DOI] [PubMed] [Google Scholar]
- 14.Lucidarme D, Foucher J, Le Bail B, Vergniol J, Castera L, Duburque C, Forzy G, Filoche B, Couzigou P, de Lédinghen V. Hepatology. 2008;49(4):1083–1089. doi: 10.1002/hep.22748. [DOI] [PubMed] [Google Scholar]
- 15.Park SH, Kim CH, Kim DJ, Suk KT, Cheong JY, Cho SW, Hwang SG, Lee YJ, Cho M, Yang JM. Journal of clinical gastroenterology. 2011;45(4):361. doi: 10.1097/MCG.0b013e31820d3458. [DOI] [PubMed] [Google Scholar]
- 16.Baranova A, Lal P, Birerdinc A, Younossi ZM. BMC gastroenterology. 2011;11(1):91. doi: 10.1186/1471-230X-11-91. [DOI] [PMC free article] [PubMed] [Google Scholar]
- 17.He Y, Kang CH, Xu S, Tuo X, Trasti S, Tai DCS, Raja AM, Peng Q, So PTC, Rajapakse JC, Welsch R, Yu H. Journal of biomedical optics. 2010;15(5) doi: 10.1117/1.3490414. 056007-056007-056011. [DOI] [PubMed] [Google Scholar]
- 18.MacAulay C, Lane P, Richards-Kortum R. Gastrointestinal endoscopy clinics of North America. 2004;14(3):595–620. doi: 10.1016/j.giec.2004.03.014. [DOI] [PubMed] [Google Scholar]
- 19.Hosoyamada Y, Kurihara H, Sakai T. Journal of Anatomy. 2002;196(3):327–340. doi: 10.1046/j.1469-7580.2000.19630327.x. [DOI] [PMC free article] [PubMed] [Google Scholar]
- 20.Buschmann RJ, Ryoo JW. Experimental and molecular pathology. 1989;50(1):114–124. doi: 10.1016/0014-4800(89)90061-0. [DOI] [PubMed] [Google Scholar]
- 21.Bedossa P, Poynard T. Hepatology. 1996;24(2) doi: 10.1002/hep.510240201. [DOI] [PubMed] [Google Scholar]
- 22.Knodell RG, Ishak KG, Black WC, Chen TS, Craig R, Kaplowitz N, Kiernan TW, Wollman J. Hepatology. 1981;1(5):431–435. doi: 10.1002/hep.1840010511. [DOI] [PubMed] [Google Scholar]
- 23.Ishak K, Baptista A, Bianchi L, Callea F, De Groote J, Gudat F, Denk H, Desmet V, Korb G, MacSween RNM. J hepatol. 1995;22:696–699. doi: 10.1016/0168-8278(95)80226-6. [DOI] [PubMed] [Google Scholar]
- 24.Chapman G, Eagles D. Tissue and Cell. 2007;39(5):343–351. doi: 10.1016/j.tice.2007.06.005. [DOI] [PubMed] [Google Scholar]
- 25.Lee HS, Liu Y, Chen HC, Chiou LL, Huang GT, Lo W, Dong CY. Optics letters. 2004;29(22):2614–2616. doi: 10.1364/ol.29.002614. [DOI] [PubMed] [Google Scholar]
- 26.Sun W, Chang S, Tai DCS, Tan N, Xiao G, Tang H, Yu H. Journal of biomedical optics. 2008;13(6) doi: 10.1117/1.3041159. 064010-064010-064017. [DOI] [PubMed] [Google Scholar]
- 27.Tai DCS, Tan N, Xu S, Kang CH, Chia SM, Cheng CL, Wee A, Wei CL, Raja AM, Xiao G, Chang S, Rajapakse JC, So PTC, Tang HH, Chen CS, Yu H. Journal of biomedical optics. 2009;14(4) doi: 10.1117/1.3183811. 044013-044013-044010. [DOI] [PubMed] [Google Scholar]
- 28.Gailhouste L, Grand YL, Odin C, Guyader D, Turlin B, Ezan F, Désille Y, Guilbert T, Bessard A, Frémin C. Journal of Hepatology. 2010;52(3):398–406. doi: 10.1016/j.jhep.2009.12.009. [DOI] [PubMed] [Google Scholar]
- 29.Regev A, Berho M, Jeffers LJ, Milikowski C, Molina EG, Pyrsopoulos NT, Feng ZZ, Reddy KR, Schiff ER. The American journal of gastroenterology. 2002;97(10):2614–2618. doi: 10.1111/j.1572-0241.2002.06038.x. [DOI] [PubMed] [Google Scholar]
- 30.Bedossa P, Dargere D, Paradis V. Hepatology. 2003;38(6):1449–1457. doi: 10.1016/j.hep.2003.09.022. [DOI] [PubMed] [Google Scholar]
- 31.Constandinou C, Henderson N, Iredale JP. Methods in molecular medicine. 2005;117:237. doi: 10.1385/1-59259-940-0:237. [DOI] [PubMed] [Google Scholar]
- 32.Iredale JP. Journal of Clinical Investigation. 2007;117(3):539. doi: 10.1172/JCI30542. [DOI] [PMC free article] [PubMed] [Google Scholar]
- 33.Goodman ZD. Journal of hepatology. 2007;47(4):598–607. doi: 10.1016/j.jhep.2007.07.006. [DOI] [PubMed] [Google Scholar]
- 34.Wallis JW, Miller TR. Journal of nuclear medicine: official publication, Society of Nuclear Medicine. 1991;32(3):534. [PubMed] [Google Scholar]
- 35.Greene WH, Zhang C. Econometric analysis. Prentice hall Upper Saddle River; NJ: 1997. [Google Scholar]
- 36.Frangi A, Niessen W, Vincken K, Viergever M. Medical Image Computing and Computer-Assisted Interventation – MICCAI’98. 1998:130–137. [Google Scholar]
- 37.Longair MH, Baker DA, Armstrong JD. Bioinformatics. 2011;27(17):2453–2454. doi: 10.1093/bioinformatics/btr390. [DOI] [PubMed] [Google Scholar]
- 38.Dempster AP, Laird NM, Rubin DB. Journal of the Royal Statistical Society Series B (Methodological) 1977:1–38. [Google Scholar]
- 39.Xu S, Tai D, So P, Yu H, Rajapakse J. Australian Journal of Intelligent Information Processing Systems. 2010;12(2) [Google Scholar]
- 40.Telea A, Van Wijk JJ. Proceedings of the symposium on Data Visualisation 2002. Eurographics Association; 2002. p. 251ff. [Google Scholar]
- 41.Haralick RM, Shanmugam K, Dinstein IH. Systems, Man and Cybernetics, IEEE Transactions on. 1973;6:610–621. [Google Scholar]
- 42.Shen J, Strang G. Applied and Computational Harmonic Analysis. 1998;5(3):312–331. [Google Scholar]
- 43.Daugman JG. Acoustics, Speech and Signal Processing, IEEE Transactions on. 1988;36(7):1169–1179. doi: 10.1109/29.9030. [DOI] [PubMed] [Google Scholar]
- 44.Pinsky MA. Introduction to Fourier analysis and wavelets, Amer Mathematical Society. 2002 [Google Scholar]
- 45.Guyon I, Weston J, Barnhill S, Vapnik V. Machine learning. 2002;46(1):389–422. [Google Scholar]
- 46.Wu CFJ. The Annals of Statistics. 1986;14(4):1261–1295. [Google Scholar]
- 47.Abeel T, Helleputte T, Van de Peer Y, Dupont P, Saeys Y. Bioinformatics. 2010;26(3):392–398. doi: 10.1093/bioinformatics/btp630. [DOI] [PubMed] [Google Scholar]
- 48.Hanley JA. Radiology. 1982;743:29–36. doi: 10.1148/radiology.143.1.7063747. [DOI] [PubMed] [Google Scholar]
- 49.Georges PC, Hui JJ, Gombos Z, McCormick ME, Wang AY, Uemura M, Mick R, Janmey PA, Furth EE, Wells RG. American Journal of Physiology-Gastrointestinal and Liver Physiology. 2007;293(6):G1147–G1154. doi: 10.1152/ajpgi.00032.2007. [DOI] [PubMed] [Google Scholar]
- 50.Wells RG. Hepatology. 2008;47(4):1394–1400. doi: 10.1002/hep.22193. [DOI] [PubMed] [Google Scholar]
- 51.Castera L. Hepatology international. 2011;5(2):625–634. doi: 10.1007/s12072-010-9240-0. [DOI] [PMC free article] [PubMed] [Google Scholar]
- 52.Müller A, Machnik F, Zimmermann T, Schubert H. Experimental pathology. 1988;34(4):229–236. doi: 10.1016/s0232-1513(88)80155-5. [DOI] [PubMed] [Google Scholar]
- 53.Stanciu SG, Xu S, Peng Q, Yan J, Stanciu GA, Welsch RE, So PT, Csucs G, Yu H. Scientific reports. 2014;4 doi: 10.1038/srep04636. [DOI] [PMC free article] [PubMed] [Google Scholar]
- 54.Raykar VC, Yu S, Zhao LH, Jerebko A, Florin C, Valadez GH, Bogoni L, Moy L. Proceedings of the 26th Annual international conference on machine learning. ACM; 2009. pp. 889–896. [Google Scholar]
- 55.Wu Y, Xi J, Cobb MJ, Li X. Optics letters. 2009;34(7):953–955. doi: 10.1364/ol.34.000953. [DOI] [PMC free article] [PubMed] [Google Scholar]
- 56.Zhang Y, Akins ML, Murari K, Xi J, Li MJ, Luby-Phelps K, Mahendroo M, Li X. Proceedings of the National Academy of Sciences. 2012;109(32):12878–12883. doi: 10.1073/pnas.1121495109. [DOI] [PMC free article] [PubMed] [Google Scholar]
- 57.Fu L, Jain A, Xie H, Cranfield C, Gu M. Optics Express. 2006;14(3):1027–1032. doi: 10.1364/oe.14.001027. [DOI] [PubMed] [Google Scholar]
- 58.Bao H, Boussioutas A, Jeremy R, Russell S, Gu M. Optics Express. 2010;18(2):1255–1260. doi: 10.1364/OE.18.001255. [DOI] [PubMed] [Google Scholar]
- 59.Brown CM, Rivera DR, Pavlova I, Ouzounov DG, Williams WO, Mohanan S, Webb WW, Xu C. Journal of biomedical optics. 2012;17(4):040505-040501–040505-040503. doi: 10.1117/1.JBO.17.4.040505. [DOI] [PMC free article] [PubMed] [Google Scholar]
- 60.Rivera DR, Brown CM, Ouzounov DG, Pavlova I, Kobat D, Webb WW, Xu C. Proceedings of the National Academy of Sciences. 2011;108(43):17598–17603. doi: 10.1073/pnas.1114746108. [DOI] [PMC free article] [PubMed] [Google Scholar]
- 61.Rivera DR, Brown CM, Ouzounov DG, Webb WW, Xu C. Optics letters. 2012;37(5):881–883. doi: 10.1364/OL.37.000881. [DOI] [PubMed] [Google Scholar]
Associated Data
This section collects any data citations, data availability statements, or supplementary materials included in this article.


