Abstract
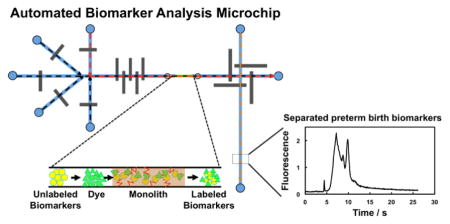
We have developed multichannel integrated microfluidic devices for automated preconcentration, labeling, purification and separation of preterm birth (PTB) biomarkers. We fabricated multi-layer poly(dimethylsiloxane)-cyclic olefin copolymer (PDMS-COC) devices, that perform solid-phase extraction (SPE) and microchip electrophoresis (μCE) for automated PTB biomarker analysis. The PDMS control layer had a peristaltic pump and pneumatic valves for flow control, while the PDMS fluidic layer had five input reservoirs connected to microchannels and a μCE system. The COC layers had a reversed-phase octyl methacrylate porous polymer monolith for SPE and fluorescent labeling of PTB biomarkers. We determined μCE conditions for two PTB biomarkers, ferritin (Fer) and corticotropin releasing factor (CRF). We used these integrated microfluidic devices to preconcentrate and purify off-chip-labeled Fer and CRF in an automated fashion. Finally, we performed a fully automated on-chip analysis of unlabeled PTB biomarkers, involving SPE, labeling and μCE separation with 1 hour total analysis time. These integrated systems have strong potential to be combined with upstream immunoaffinity extraction, offering a compact sample-to-answer biomarker analysis platform.
Keywords: Microfluidics/Microfabrication, Capillary electrophoresis/Electrophoresis, Clinical/Biomedical analysis, Separations/Instrumentation, Extraction (SFE | SPE | SPME)
Graphical abstract
INTRODUCTION
Microfluidics can miniaturize benchtop processes, promising fast, sensitive, inexpensive and portable analysis systems suitable for point-of-care applications [1–4]. On-chip sample preparation is an important step in this direction allowing multiple time-consuming off-chip steps such as preconcentration, purification and labeling to be performed on the same platform [5]. Integration of on-chip sample preparation with miniaturized tools thus can simplify and automate the analysis process. Many recent studies focus on addressing this need, including preconcentration, purification and separation of proteins in urine [6]; labeling and separation of preterm birth (PTB) biomarkers [7,8]; affinity capture, tryptic digestion and isotopic labeling of an apoptosis biomarker [9]; preconcentration and purification of core needle biopsy samples for steroid quantitation [10]; and on-chip immunocapture and sensing of proteins in whole blood and urine samples [11]. PTB biomarker analysis in miniaturized platforms is an area of interest because PTB is the most common complication of pregnancy, the primary cause of neo-natal illnesses [12], and PTB risk can be correlated with specific molecular markers in bodily fluids [12]. Importantly, a panel of three serum peptides combined with six previously known biomarkers was shown to provide specific (~80%) and sensitive (~90%) prediction of the occurrence of a PTB several weeks in the future [13].
Microfluidic sample preparation can utilize various methods including electrokinetic manipulation [14], solid-phase extraction (SPE) [15,16] and size-selective membranes [6]. Reversed-phase SPE selectively retains analytes based on hydrophobic interactions [17]. Porous polymer monoliths for SPE [18,19] are versatile and effective, particularly in microchips due to the convenience of on-chip monolith polymerization and the ability to control the porosity and chemical properties through the composition [15].
Microchip electrophoresis (μCE) is an effective analysis method for multiplexed biomarkers [20,21]. Importantly, μCE increases in power and versatility when integrated with upstream sample processing like SPE [22]. Mohamadi et al. [23] developed an integrated microfluidic device combining immunoaffinity capture, preconcentration and μCE of β-amyloid peptide in cerebrospinal fluid. Farias et al. [24] combined affinity SPE with μCE for the analysis of phosphopeptides. Nordman et al. [25] combined reversed-phase SPE, μCE and electrospray ionization mass spectrometry for the analysis of verapamil. Sonker et al. [7] developed μCE and on-chip labeling modules for PTB biomarker analysis, but on-chip integration of SPE and μCE was not demonstrated. Notably, all these integrated microfluidic analyses used electrokinetic operation, which can simplify device fabrication, but applied voltages can be problematic for samples with high or low ionic strength. Alternatively, fluids can be manipulated on-chip with pneumatic pumps and valves [26],[27]. Sahore et al. [8] developed a pressure-injected μCE device for PTB biomarkers with improved signal and separation, but in that work only μCE separation was demonstrated. Recently, Kumar et al. [28] reported a pressure-driven microfluidic device integrating SPE and μCE for the preconcentration and separation of a PTB protein biomarker. This device used a single input reservoir and processed different solutions to perform the analysis of prelabeled analytes, but it required the reservoir to be emptied and refilled in order to change solutions. Thus, two key improvements in automated analysis would be to interface multiple solution inputs with on-chip SPE and μCE, and to perform on-chip labeling in the analysis to eliminate off-chip processing steps.
In this work, we developed pressure-actuated, multi-channel, multi-layer integrated microfluidic devices to analyze PTB biomarkers. We improved upon the design, operation, fabrication, SPE and μCE conditions from a previous study [28] to make integrated poly(dimethylsiloxane)-cyclic olefin copolymer (PDMS-COC) microfluidic devices that preconcentrate, label, purifiy and separate PTB biomarkers in an automated fashion. We optimized SPE retention and elution conditions to purify Fer and CRF from unbound label, and developed a μCE assay for these PTB biomarkers. Finally, we carried out a fully automated on-chip analysis of unlabeled PTB biomarkers, including the processes of SPE, labeling, purification and separation. This system is being developed as part of a larger integrated package that also entails upstream immunoaffinity extraction from a blood serum sample [22], with potential to provide a compact, integrated biomarker analysis platform.
EXPERIMENTAL SECTION
Chemicals and Materials
Methylcellulose (MC), hydroxypropyl cellulose (HPC), dimethyl sulfoxide (DMSO), ethylene glycol dimethacrylate (EGDMA), 1-dodecanol and 2,2-dimethoxy-2-phenylacetophenone (DMPA) were purchased from Sigma-Aldrich (St. Louis, MO). Octyl methacrylate (C8) was obtained from Scientific Polymer Products (Ontario, NY). Acetonitrile (ACN) and cyclohexanol were purchased from Fisher Scientific (Pittsburgh, PA) and J.T. Baker (Phillipsburg, NJ), respectively. Sodium carbonate, sodium bicarbonate and Fer were purchased from EMD Millipore (Billerica, MA). Human CRF was purchased from Biomatik (Wilmington, DE). PDMS base and curing agent were obtained from Dow (Midland, MI). Food coloring to visualize control layer channels was purchased from Walmart (Bentonville, AR). AZ P4620, SU-8 2025 and S1805 photoresists were purchased from MicroChem (Westborough, MA). COC (Zeonor 1020R) was obtained from Zeon Chemicals (Louisville, KY). Alexa Fluor 488-TFP Ester (AF 488) was purchased from Life Technologies (Carlsbad, CA). All solutions were made in deionized (DI) water either filtered by a Barnstead water purifier or purchased directly from Thermo Scientific (Waltham, MA).
Integrated Microfluidic Device Design
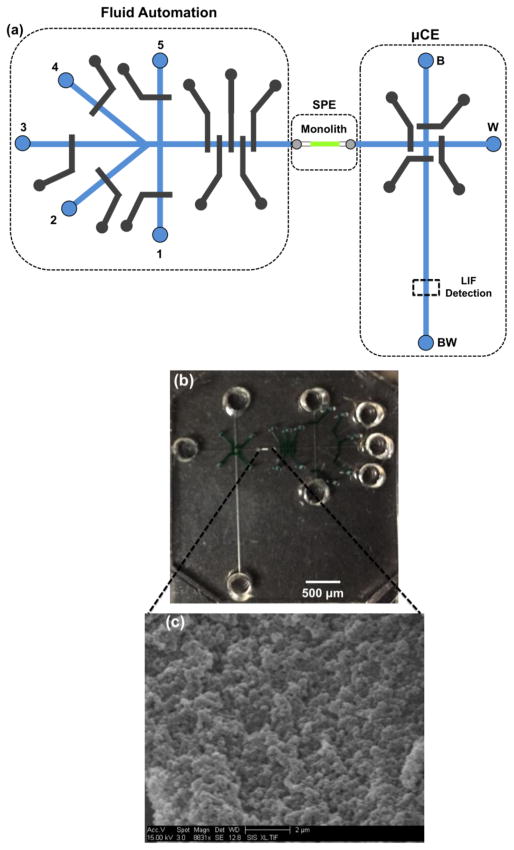
Microfluidic chip masks were designed using CleWin software (Informer Technologies, Shingle Springs, CA), with a device schematic shown in Figure 1a. Each microfluidic chip had the top two layers made from PDMS and the bottom two layers constructed from COC. The control layer had a five-valve peristaltic pump for fluid injection, five pneumatic valves for fluid input control and four pneumatic valves surrounding the μCE injection intersection for plug capture. The width of all pneumatic valves was 250 μm, and the spacing between the peristaltic pump valves was 120 μm. A four-valve design with 200 μm spacing from the injection intersection was used to capture the sample plug [8]. The fluidic PDMS layer had 100 μm wide and 18 ± 1 μm (n=23) deep channels, with five input reservoirs that connected to fluid channels for automation: (1) sample, (2) label, (3) rinse, (4) label eluent and (5) labeled sample eluent; and three reservoirs that connected to channels for μCE; waste (W), buffer (B), and buffer waste (BW). The distance between the B and W reservoirs to the injection intersection was 0.5 cm, and the distance from the BW reservoir to the intersection was 1.5 cm. The top and bottom COC layers were ~100 μm and 1 mm thick, respectively, with the top layer having ~200 μm diameter vias that connected the COC to the PDMS, and the bottom layer having an 80 μm wide, 1.5 mm long, and 29 ± 3 μm (n=22) deep channel in which the reversed-phase porous polymer monolith was formed.
Figure 1.
Integrated microfluidic device. (a) Schematic view of the multi-channel integrated microchip design, showing hydrodynamic controls, SPE column and μCE section. Eight reservoirs (1: sample, 2: fluorescent label, 3: rinse, 4: label eluent, 5: labeled sample eluent, B: buffer, BW: buffer waste, and W: waste) were used. Color scheme: blue-fluidic channels, grey-control channels and green-monolith. Operation involves sample loading on the monolith through pump operation with valve 1 open and 2–5 closed. Subsequently label is loaded with valve 2 open, and 1 and 3–5 closed. After labeling, the monolith is rinsed with solution from reservoir 3 with valve 3 open and 1–2 and 4–5 closed. With valve 4 open, and 1–3 and 5 closed, the unattached label is eluted using solution pumped from reservoir 4. Upon pumping labeled sample eluent with valve 5 open and 1–4 closed, the eluted PTB biomarker fluid plug is transferred into the injection intersection and then separated by μCE with LIF detection. Except during μCE runs, the separation channel valves to the μCE intersection were kept closed while leaving the injection channel valves open. During μCE the injection valves were closed while opening the separation valves. (b) Photograph of a microfabricated device, showing PDMS pneumatic pump and valves filled with colored dye solution, fluid channels in PDMS-COC, and the porous polymer monolith in COC. (c) SEM image showing monolith morphology in a device.
Device Fabrication
Device fabrication followed a method previously developed in our laboratory [28]; see also Fig. S1 in the Electronic Supplementary Material (ESM). Figure 1b is a photograph of a fully assembled integrated microdevice. A C8 reversed-phase porous polymer monolith was fabricated inside the COC microfluidic channel using 24% C8 and 11% EGDMA, with 10% cyclohexanol and 55% 1-dodecanol as porogens, and 1% DMPA as the photoinitiator. The monolith solution was exposed to UV light through the bottom COC layer through a Cr mask for 11 min, and a 0.6-mm long monolith was obtained. The polymerized monolith was rinsed using 2-propanol for at least 30 min. Other details of the monolith fabrication procedure are reported in an earlier study [28]. Morphology of the C8 monolith was observed using scanning electron microscopy (SEM, Philips XL30 FEG, FEI, Hillsboro, OR) as shown in Figure 1c; the details of the SEM sample preparation and imaging procedure have been published previously [29].
Experimental Setup
Details of the experimental setup can be found in our previous publications [7,8]. Briefly, a Nikon Eclipse TE 300 microscope (Nikon, Melville, NY) with 488 nm laser excitation (JDSU, Shenzhen, China) and photomultiplier tube fluorescence detection was used. Separation voltages were applied using platinum electrodes connected to a variable power supply (Stanford Research Systems, Sunnyvale, CA). The LabView (National Instruments, Austin, TX) control software and electrically controlled pneumatic system (Clippard Instrument, Cincinnati, OH) were expanded from our earlier work to accommodate 14 valves. The peristaltic pump could sustain a maximum of 18 psi before the PDMS-COC interface began to delaminate, so the air supply for solenoid actuation was split into two parts, one addressing the peristaltic pump (18 psi) and the other addressing the individual valves (25 psi).
Device Operation
Samples, AF 488 and different ACN eluents were prepared in 10 mM sodium bicarbonate buffer (BCB, pH 9.9). Labeling conditions such as buffer type, ionic strength, pH and analyte-dye ratio were first optimized off chip with analysis by pressure-injected μCE [8]. 10 mM BCB, pH 9.9, with 1:40 and 1:10 analyte-to-AF 488 ratios for Fer and CRF, respectively, provided the best off-chip labeling, and these conditions were adopted for on-chip labeling. Off-chip labeled Fer (450 kDa) and CRF (4.7 kDa) were purified four times at 14,000 rpm for 15 min using 50 kDa and 3 kDa centrifugal filters (EMD Millipore), respectively. The concentration of labeled Fer was measured using a NanoDrop Spectrometer (Thermo Scientific).
Some experiments were performed with 200 μm valve spacing, 3-layer PDMS-COC devices for pressure-injected μCE [8] of Fer (200 nM), CRF (750 nM) and a mixture of Fer and CRF at these same concentrations. Before experiments, pressure-injected μCE devices were washed with 2-propanol, DI water, and 10 mM BCB, with vacuum drying between each step. Subsequently the devices were filled with running buffer (25 mM BCB pH 9.9 with 0.05% MC), and samples dissolved in 10 mM BCB were injected with 20 Hz peristaltic pump actuation for 30 s. We previously reported detailed operation procedures for pressure-injected μCE devices [8].
Integrated microfluidic devices were prepared for use in the following operational sequence. First, with empty channels, all valves were actuated and their control lines filled using colored dye solutions; if the channels were filled with liquid before filling the control lines it increased bubble formation due to the air permeability of PDMS. Next, the fluid automation reservoirs and corresponding channels were filled with 90% ACN in 10 mM BCB. Filling the COC channel and the monolith required the peristaltic pump to prime the monolith with 90% ACN solution for 2 min. Then the solution in the reservoirs was replaced with 50% and then 30% ACN, and the peristaltic pump was operated for 1 min each time. Next, all reservoirs were filled with 10 mM BCB, pH 9.9, and the peristaltic pump was operated with solution pumped from each reservoir (keeping the other valves closed) for at least 30 s, to fill all the μCE channels. Finally, with the μCE injection valves closed, the separation channel was filled with 25 mM BCB pH 9.9 containing 0.05% MC.
With the device filled, preconcentration of Fer (50 nM), purification of CRF (750 nM) and separation of off-chip labeled Fer (50 nM) and CRF (750 nM) were performed as follows. Samples were loaded for 15 min with the peristaltic pump (20 Hz) with valve 1 and the injection channel valves open but all others closed, flowing solution to reservoir W. Solutions in reservoirs 1–5 were replaced with fresh 10 mM BCB pH 9.9, and all the automation channels were rinsed individually, followed by filling reservoir 4 with label eluent (50% ACN in BCB) and reservoir 5 with labeled sample eluent (90% ACN in BCB). Label eluent was flowed (20 Hz) to elute the unattached dye. Finally, labeled sample eluent flow (20 Hz) eluted the PTB biomarkers using discrete injections of 5 s each, followed by μCE separation with laser induced fluorescence (LIF) detection 10 mm from the injection intersection as described previously [8].
To determine its elution and retention properties on the monolith, a 40 μM AF 488 sample was loaded for 5 min. After 5 min, a 10 mM BCB pH 9.9 rinse and 15–90% ACN solutions were flowed, while LIF was measured after the monolith.
For on-chip labeling of PTB biomarkers, the integrated device was prepared and operated similarly. Either individual component [Fer (100 nM) or CRF (750 nM)] or a mixture of the two (150 nM Fer and 1 μM CRF) was loaded for 15 min with 20 Hz peristaltic pump actuation. Next, 10 or 40 μM AF 488 was loaded for 5 min at 13.3 Hz actuation, and the reaction was allowed to proceed for 30 min. After 10 mM BCB rinsing and 50% ACN label elution (20 Hz actuation) the labeled samples were eluted and transferred to the injection intersection using 90% ACN in 5 s increments, with each injection probed by μCE separation and LIF detection as before. Three to eight 5 s injections were needed to clear the dead volume between the monolith and μCE intersection. Between five to fifteen additional injections were probed by μCE. The cumulative injection time (including clearing the dead volume) is reported for each experiment in its figure caption. Additional device operation details can be found in the Figure 1 caption.
RESULTS AND DISCUSSION
Microchip Electrophoresis of PTB Biomarkers
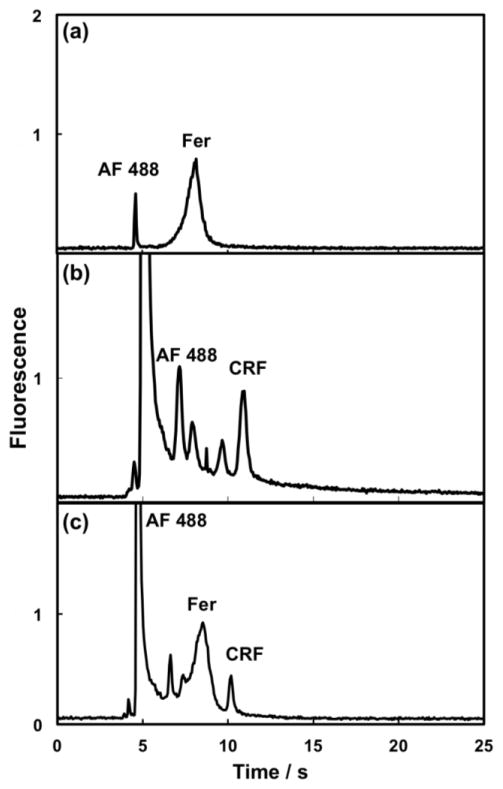
Initially, experiments were performed to analyze the separation of AF 488-labeled Fer and CRF, using a pressure operated PDMS-COC μCE device.[8] Microchip electropherograms are shown in Figure 2; most of the unreacted label is removed after 30 kDa filtering of the labeled Fer (Figure 2a), but even 3 kDa filtration did not completely remove AF 488 and possible decomposition byproducts from labeled CRF (Figure 2b). Consequently, the CRF sample had additional peaks at faster migration times than CRF; nonetheless, the individual PTB biomarkers were well resolved from these peaks. In the separation of the PTB biomarker mixture, Fer co-migrated with some of the AF 488 peaks, but it was still well resolved from the CRF peak (Figure 2c). The number of theoretical plates per meter (N/m) for PTB biomarker peaks is given in each figure caption; these N/m values were comparable to published work for PDMS μCE devices [8]. On the basis of this separation data, we decided to use similar buffer conditions for μCE in our integrated microfluidic devices.
Figure 2.
Pressure-driven injection μCE for off-chip AF 488-labeled (a) Fer (200 nM, N = 21,000 plates/m), (b) CRF (750 nM, N = 77,000 plates/m) and (c) Fer (200 nM, N = 11,000 plates/m)/CRF (750 nM, N = 270,000 plates/m) mixture using a 3-layer PDMS-COC device with 18 ± 1 μm (n=16) channel depth, 24 mm separation channel length, and 200 μm valve spacing. Additional experimental conditions: 20 Hz pump actuation rate, 30 s injection time, 10 mm detection distance, 1500 V μCE voltage, and 25 mM BCB pH 9.9 with 0.05% MC separation buffer.
Sample Preconcentration
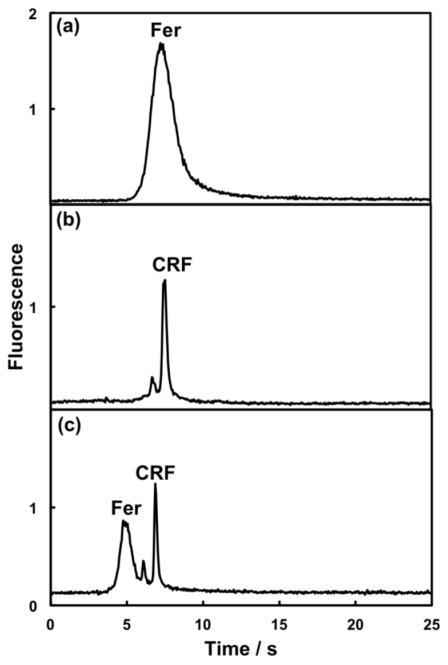
Preconcentration is useful for improving limits of detection or aiding in further sample preparation. We used the C8 reversed-phase monolith in the COC channel of our integrated microfluidic device to preconcentrate AF 488-labeled Fer. After loading, rinsing and label elution, the preconcentrated Fer was incrementally eluted, injected and analyzed by μCE. The pressure-injected microchip electropherogram in Figure 3a shows a labeled Fer peak that is well resolved from AF 488 still present in the off-chip filtered sample. Figure 3b shows Fer preconcentrated on-chip by SPE and analyzed by μCE using an integrated microfluidic device. Because of the monolith enrichment and label elution steps, the extra dye peak was removed and μCE of Fer yielded a peak with a 13-fold greater area than in Figure 3a. Comparing Figure 3a to the μCE data for all 8 runs, we calculated a ~50-fold preconcentration factor in the integrated microfluidic device. To account for minor variations in operational conditions, a spiked reference analyte could be used to determine a normalization factor for more accurate quantitation with our preconcentration approach. Importantly, the use of pneumatic valves allows multiple injections of the small-volume enriched sample that would be difficult to achieve using electrokinetic methods [29]. In addition to accomplishing preconcentration, the experiments also demonstrate the ability of our integrated microfluidic device to do automated analysis.
Figure 3.
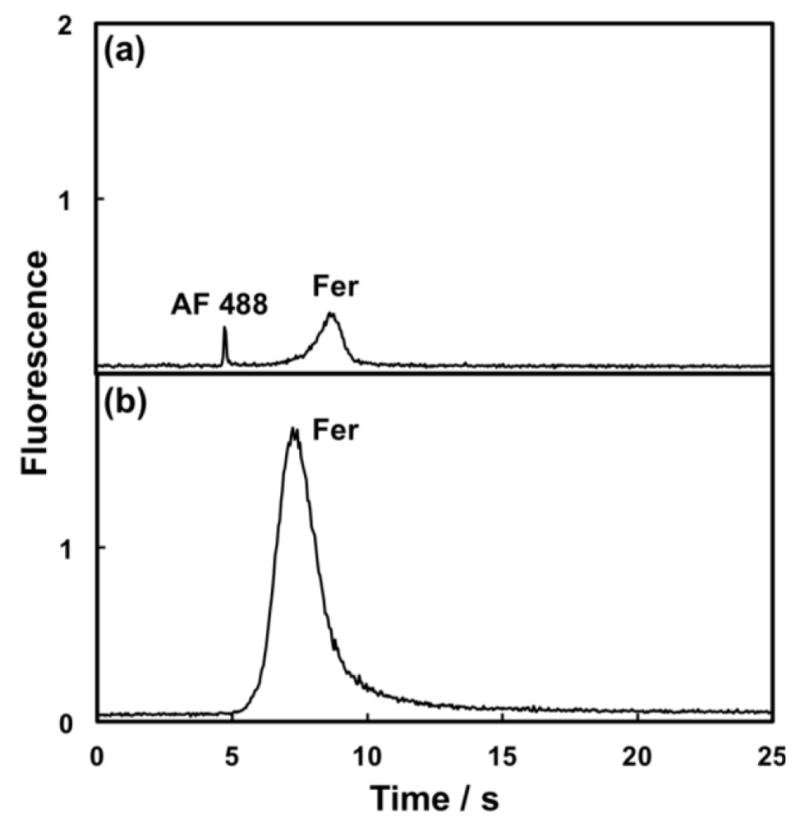
PTB biomarker preconcentration using an integrated microfluidic device. Pressure injection μCE for (a) off-chip AF 488-labeled Fer (100 nM, N = 19,000 plates/m) using a 3-layer PDMS-COC device without preconcentration, and (b) off-chip AF 488-labeled Fer (50 nM, N = 5600 plates/m) preconcentrated on the monolith, eluted, injected and separated by μCE using a 4-layer PDMS-COC integrated microfluidic chip. In (a), all parameters were the same as in Figure 2. In (b), all parameters except μCE voltage (1200 V) and separation channel length (19 ± 1 mm) were the same as in Figure 2.
Sample Purification
In integrated microfluidics sample purification can reduce the interferences present. We used our integrated microfluidic devices to purify AF 488-labeled CRF using differences in retention on the monolith. Unconjugated AF 488 was eluted first using 50% ACN, while purified and labeled CRF eluted from the monolith with 90% ACN. CRF that was labeled with AF 488 and 3 kDa filtered off-chip was analyzed by pressure-injected μCE. Dye peaks in addition to labeled CRF were visible, even after filtration (Figure 4a). The reversed-phase monolith in our device purifies more efficiently than the filter (compare 15 and 90% ACN elution traces in ESM Fig. S2), such that when we preconcentrated the same sample in our integrated microfluidic device followed by selective label and sample elution, sharp peaks for CRF and one minor impurity were obtained (Figure 4b). This clearly demonstrates the benefits of our device for automated on-chip SPE-μCE sample purification and analysis.
Figure 4.
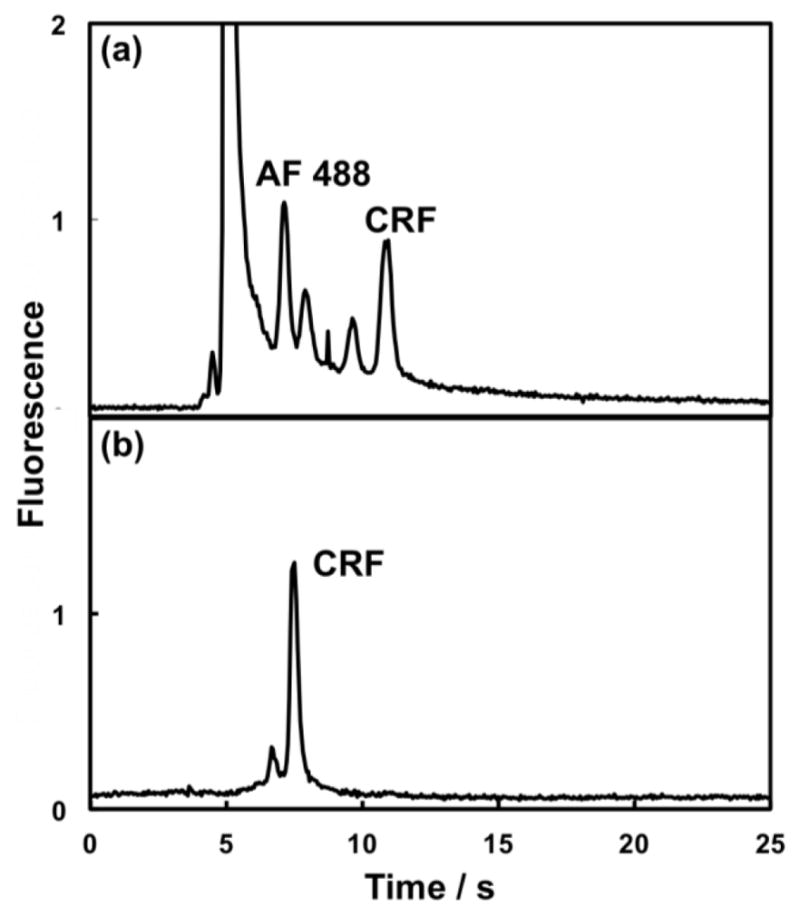
PTB biomarker purification in an integrated microfluidic device. Pressure-injected μCE of off-chip AF 488-labeled and 3 kDa filtered CRF (750 nM) (a) without on-chip purification in a 3-layer PDMS-COC device (N = 77,000 plates/m); and (b) with on-chip SPE purification after 40 s cumulative injection time (N = 180,000 plates/m). In (a), all parameters were the same as in Figure 2. In (b), all parameters except μCE voltage (1500 V) were the same as in Figure 3b. The difference in migration times for CRF can be explained by different separation voltages; the use of different devices: μCE only in (a) vs. integrated in (b); and different captured sample solutions: 10 mM BCB in (a) and 90% ACN in (b).
Integrated Microfluidic Device Analysis of Pre-labeled PTB Biomarkers
Disease diagnosis often requires determination of a panel of biomarkers; as a first step in this direction we have analyzed a mixture of two off-chip labeled PTB biomarkers in our integrated system. Fer and CRF were loaded individually, extracted and eluted, and the corresponding μCE results are shown in Figures 5a–b. Selective elution in our integrated microfluidic device yielded electropherograms free of label with just a minor impurity in Figure 5b along with the biomarker peak. Different μCE voltages (1200 V in Figure 5a and 1500 V in Figure 5b) cause the Fer and CRF peaks to have similar migration times. A mixture containing Fer and CRF was similarly processed in an integrated microfluidic device, and the electropherogram in Figure 5c shows the purified Fer and CRF peaks clearly resolved. The combination of μCE with upstream SPE improves the biomarker separation, which would be difficult to achieve using only SPE [7]. These results demonstrate the ability of our devices to process and separate multiple PTB biomarkers.
Figure 5.
Off-chip AF 488-labeled PTB biomarker analysis in an integrated microchip for (a) Fer (50 nM, 30 s cumulative injection time, N = 5600 plates/m), (b) CRF (750 nM, 40 s cumulative injection time, N = 180,000 plates/m) and (c) Fer (100 nM, N = 8800 plates/m)/CRF (750 nM, N = 220,000 plates/m) mixture (30 s cumulative injection time). All parameters except μCE voltage [1500 V for (b)] were the same as in Figure 3b.
On-chip Labeling of PTB Biomarkers
A key advantage of our integrated system is the ability to do automated labeling followed by separation of PTB biomarkers. Off-chip results were optimal with a molar label-to-analyte ratio as high as 40, so we tested the retention and elution characteristics of the C8 monolith with 40 μM AF 488. Elution of AF 488 was studied using 15–90% ACN, and we found that 50% ACN was the best eluent for AF 488 since it yielded the largest peak (see ESM Fig. S2).
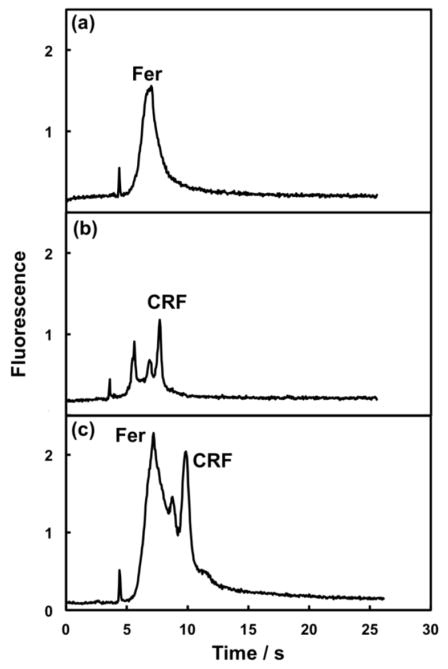
To demonstrate integrated PTB biomarker analysis, unlabeled Fer and CRF were loaded and labeled on-chip as described in the Experimental Section. Figure 6a shows μCE of on-chip-labeled Fer with a peak shape similar to that observed for off-chip labeled Fer in Figure 3b. Figure 6b shows μCE of on-chip labeled CRF with a peak shape similar to the data obtained using off-chip-labeled CRF in Figure 4b. A 10-fold higher CRF concentration compared to Fer was used because CRF (3 kDa) has fewer amine groups for labeling than Fer (450 kDa), and the retention of CRF on the monolith is lower than for Fer. Although we used 40 μM AF 488 for on-chip labeling, the very small unattached label peak at 4 s clearly demonstrates the ability of our devices to label, as well as purify the labeled PTB biomarkers. Finally, we loaded a mixture containing unlabeled Fer and CRF, and labeled, purified and separated the PTB biomarkers by μCE, as seen in Figure 6c. Figure 6c shows resolution of the on-chip labeled Fer and CRF, with a small CRF impurity peak between them, and a smaller AF 488 peak at ~4 s. Data in Figure 6c match well with the off-chip-labeled sample in Figure 5c; the minor offset in migration times is due to different separation conditions. These results demonstrate fully automated preconcentration, labeling, purification and separation of multiple PTB biomarkers in our integrated microfluidic devices.
Figure 6.
μCE after on-chip SPE, labeling [with 40 μM AF 488 for (a) and (c) and 10 μM AF 488 for (b)] and elution of PTB biomarkers in an integrated microfluidic device. (a) Fer (100 nM, 40 s cumulative injection time, N = 6000 plates/m), (b) CRF (750 nM, 35 s cumulative injection time, N = 110,000 plates/m), and (c) Fer (150 nM)/CRF (1 μM); 80 s cumulative injection time, additional separation buffer was loaded in B and BW reservoirs before this injection. All parameters except applied voltage [800 V for (c)] were the same as in Figure 3b.
CONCLUSIONS
We have developed pneumatically controlled integrated microfluidic devices for automated on-chip labeling and μCE separation of PTB biomarkers. The devices had a 4-layer PDMS-COC structure and were fabricated using soft lithography and hot embossing techniques. Fluidic controls in the top PDMS layer included a five-valve peristaltic pump, five pneumatic valves for flow control and four pneumatic valves for μCE injection control. The second PDMS fluidic layer had five input reservoirs connected to fluid channels and a μCE setup. The bottom two layers were made from COC and had a reversed-phase C8 porous polymer monolith fabricated inside the microchannel for SPE and fluorescent labeling. We used our integrated microfluidic devices to preconcentrate, purify and separate off-chip labeled PTB biomarkers in an automated fashion. Furthermore, we demonstrated the ability of our integrated microfluidic devices to do an analysis of a mixture of PTB biomarkers. Finally, we carried out a fully automated analysis including preconcentration, labeling, purification and μCE of a mixture of PTB biomarkers on our microdevices in one hour total analysis time.
Key advantages of our approach are the integration of sample preparation and μCE in a single platform to on-chip label and separate biomarkers in an automated fashion. Additionally, the use of pneumatic fluid controls allows the use of stronger eluents and eliminates complications like mobility bias that are associated with electrokinetic methods. Use of an on-chip peristaltic pump further reduces dead volumes associated with external syringe pumps, for example. The use of pneumatic valves offer additional control in sample manipulation, allowing plugs to be injected multiple times in a discrete and precise manner. We are now working to develop a fully integrated sample-to-answer microfluidic device for PTB biomarker analysis that further combines upstream immunoaffinity extraction with these processes. Multilayer device fabrication using conventional clean room techniques, while feasible, can be a limiting factor in these analyses due to long fabrication times. 3D printing may provide an attractive alternative to reduce fabrication times, provided truly microfluidic (<100 μm) features can be created [30][31]. Finally, although this work is directed towards the analysis of preterm birth biomarkers, the general nature of our approach makes it broadly applicable to other disease-related biomarkers.
Supplementary Material
Fig. S1 Fabrication schematic for integrated microfluidicde vices
Fig. S2 Fluorescence detection during elution from a C8 monolith in a microfluidic device. 40 μM AF 488 was loaded on the monolith and eluted in different ACN solutions made in 10 mM BCB pH 9.9
Acknowledgments
We thank the National Institutes of Health (R01 EB006124) for funding this research. We are grateful to the Integrated Microfabrication Lab and Electron Microscopy Laboratory at Brigham Young University for their facilities. We also thank the Science Support Shop in the Department of Chemistry and Biochemistry for helping with the instrumentation-related support.
Footnotes
Compliance with Ethical Standards
Conflict of interest
The authors declare that they have no conflict of interest.
References
- 1.Mark D, Haeberle S, Roth G, Von Stetten F, Zengerle R. Microfluidic lab-on-a-chip platforms: requirements, characteristics and applications. Chem Soc Rev. 2010;39:1153–1182. doi: 10.1039/b820557b. [DOI] [PubMed] [Google Scholar]
- 2.Yetisen AK, Akram MS, Lowe CR. Paper-based microfluidic point-of-care diagnostic devices. Lab Chip. 2013;13:2210–2251. doi: 10.1039/c3lc50169h. [DOI] [PubMed] [Google Scholar]
- 3.Mashaghi S, Abbaspourrad A, Weitz DA, Van Oijen AM. Droplet microfluidics: a tool for biology, chemistry and nanotechnology. Trends Anal Chem. 2016;82:118–125. [Google Scholar]
- 4.Nge PN, Rogers CI, Woolley AT. Advances in microfluidic materials, functions, integration, and applications. Chem Rev. 2013;113:2550–2583. doi: 10.1021/cr300337x. [DOI] [PMC free article] [PubMed] [Google Scholar]
- 5.Cui F, Rhee M, Singh A, Tripathi A. Microfluidic sample preparation for medical diagnostics. Annu Rev Biomed Eng. 2015;17:267–286. doi: 10.1146/annurev-bioeng-071114-040538. [DOI] [PubMed] [Google Scholar]
- 6.Li F, Guijt RM, Breadmore MC. Nanoporous membranes for microfluidic concentration prior to electrophoretic separation of proteins in urine. Anal Chem. 2016;88:8257–8263. doi: 10.1021/acs.analchem.6b02096. [DOI] [PubMed] [Google Scholar]
- 7.Sonker M, Yang R, Sahore V, Kumar S, Woolley AT. On-chip fluorescent labeling using reversed-phase monoliths and microchip electrophoretic separations of selected preterm birth biomarkers. Anal Methods. 2016;8:7739–7746. doi: 10.1039/C6AY01803C. [DOI] [PMC free article] [PubMed] [Google Scholar]
- 8.Sahore V, Kumar S, Rogers CI, Jensen JK, Sonker M, Woolley AT. Pressure-actuated microfluidic devices for electrophoretic separation of pre-term birth biomarkers. Anal Bioanal Chem. 2016;408:599–607. doi: 10.1007/s00216-015-9141-0. [DOI] [PMC free article] [PubMed] [Google Scholar]
- 9.Yang MA, Nelson R, Ros A. Toward analysis of proteins in single cells: a quantitative approach employing isobaric tags with MALDI mass spectrometry realized with a microfluidic platform. Anal Chem. 2016;88:6672–6679. doi: 10.1021/acs.analchem.5b03419. [DOI] [PubMed] [Google Scholar]
- 10.Kim J, Abdulwahab S, Choi K, Lafrenière NM, Mudrik JM, Gomaa H, Ahmado H, Behan LA, Casper RF, Wheeler AR. A microfluidic technique for quantification of steroids in core needle biopsies. Anal Chem. 2015;87:4688–4695. doi: 10.1021/ac5043297. [DOI] [PubMed] [Google Scholar]
- 11.Krivitsky V, Hsiung L-C, Lichtenstein A, Brudnik B, Kantaev R, Elnathan R, Pevzner A, Khatchtourints A, Patolsky F. Si nanowires forest-based on-chip biomolecular filtering, separation and preconcentration devices: nanowires do it all. Nano Lett. 2012;12:4748–4756. doi: 10.1021/nl3021889. [DOI] [PubMed] [Google Scholar]
- 12.Goldenberg RL, Goepfert AR, Ramsey PS. Biochemical markers for the prediction of preterm birth. Am J Obstet Gyn. 2005;192:S36–S46. doi: 10.1016/j.ajog.2005.02.015. [DOI] [PubMed] [Google Scholar]
- 13.Esplin MS, Merrell K, Goldenberg R, Lai Y, Iams JD, Mercer B, Spong CY, Miodovnik M, Simhan HN, Van Dorsten P. Proteomic identification of serum peptides predicting subsequent spontaneous preterm birth. Am J Obstet Gyn. 2011;204:391.e1–391.e8. doi: 10.1016/j.ajog.2010.09.021. [DOI] [PMC free article] [PubMed] [Google Scholar]
- 14.Cong YZ, Katipamula S, Geng T, Prost SA, Tang KQ, Kelly RT. Electrokinetic sample preconcentration and hydrodynamic sample injection for microchip electrophoresis using a pneumatic microvalve. Electrophoresis. 2016;37:455–462. doi: 10.1002/elps.201500286. [DOI] [PubMed] [Google Scholar]
- 15.Knob R, Sahore V, Sonker M, Woolley AT. Advances in monoliths and related porous materials for microfluidics. Biomicrofluidics. 2016;10:032901. doi: 10.1063/1.4948507. [DOI] [PMC free article] [PubMed] [Google Scholar]
- 16.Yang R, Pagaduan JV, Yu M, Woolley AT. On chip preconcentration and fluorescence labeling of model proteins by use of monolithic columns: device fabrication, optimization, and automation. Anal Bioanal Chem. 2015;407:737–747. doi: 10.1007/s00216-014-7988-0. [DOI] [PMC free article] [PubMed] [Google Scholar]
- 17.Gañán J, Morante-Zarcero S, Pérez-Quintanilla D, Marina ML, Sierra I. One-pot synthesized functionalized mesoporous silica as a reversed-phase sorbent for solid-phase extraction of endocrine disrupting compounds in milks. J Chromatogr A. 2016;1428:228–235. doi: 10.1016/j.chroma.2015.08.063. [DOI] [PubMed] [Google Scholar]
- 18.Svec F. Porous polymer monoliths: amazingly wide variety of techniques enabling their preparation. J Chromatogr A. 2010;1217:902–924. doi: 10.1016/j.chroma.2009.09.073. [DOI] [PMC free article] [PubMed] [Google Scholar]
- 19.Arrua RD, Causon TJ, Hilder EF. Recent developments and future possibilities for polymer monoliths in separation science. Analyst. 2012;137:5179–5189. doi: 10.1039/c2an35804b. [DOI] [PubMed] [Google Scholar]
- 20.Castro ER, Manz A. Present state of microchip electrophoresis: State of the art and routine applications. J Chromatogr A. 2015;1382:66–85. doi: 10.1016/j.chroma.2014.11.034. [DOI] [PubMed] [Google Scholar]
- 21.Nuchtavorn N, Suntornsuk W, Lunte SM, Suntornsuk L. Recent applications of microchip electrophoresis to biomedical analysis. J Pharm Biomed Anal. 2015;113:72–96. doi: 10.1016/j.jpba.2015.03.002. [DOI] [PubMed] [Google Scholar]
- 22.Yang W, Yu M, Sun X, Woolley AT. Microdevices integrating affinity columns and capillary electrophoresis for multibiomarker analysis in human serum. Lab Chip. 2010;10:2527–2533. doi: 10.1039/c005288d. [DOI] [PMC free article] [PubMed] [Google Scholar]
- 23.Mohamadi RM, Svobodova Z, Bilkova Z, Otto M, Taverna M, Descroix S, Viovy J-L. An integrated microfluidic chip for immunocapture, preconcentration and separation of β-amyloid peptides. Biomicrofluidics. 2015;9:054117. doi: 10.1063/1.4931394. [DOI] [PMC free article] [PubMed] [Google Scholar]
- 24.Araya-Farias M, Dziomba S, Carbonnier B, Guerrouache M, Ayed I, Aboud N, Taverna M, Tran NT. A lab-on-a-chip for monolith-based preconcentration and electrophoresis separation of phosphopeptides. Analyst. 2017;142:485–494. doi: 10.1039/c6an02324j. [DOI] [PubMed] [Google Scholar]
- 25.Nordman N, Barrios Lopez B, Laurén S, Suvanto P, Kotiaho T, Franssila S, Kostiainen R, Sikanen T. Shape-anchored porous polymer monoliths for integrated online solid-phase extraction - microchip electrophoresis - electrospray ionization mass spectrometry. Electrophoresis. 2015;36:428–432. doi: 10.1002/elps.201400278. [DOI] [PubMed] [Google Scholar]
- 26.Bowen AL, Martin RS. Integration of on-chip peristaltic pumps and injection valves with microchip electrophoresis and electrochemical detection. Electrophoresis. 2010;31:2534–2540. doi: 10.1002/elps.201000029. [DOI] [PMC free article] [PubMed] [Google Scholar]
- 27.Sun X, Kelly RT, Danielson WF, Agrawal N, Tang K, Smith RD. Hydrodynamic injection with pneumatic valving for microchip electrophoresis with total analyte utilization. Electrophoresis. 2011;32:1610–1618. [Google Scholar]
- 28.Kumar S, Sahore V, Rogers CI, Woolley AT. Development of an integrated microfluidic solid-phase extraction and electrophoresis device. Analyst. 2016;141:1660–1668. doi: 10.1039/c5an02352a. [DOI] [PMC free article] [PubMed] [Google Scholar]
- 29.Sonker M, Knob R, Sahore V, Woolley AT. Integrated electrokinetically driven microfluidic devices with pH-mediated solid-phase extraction coupled to microchip electrophoresis for preterm birth biomarkers. Electrophoresis. 2017;38:1743–1754. doi: 10.1002/elps.201700054. [DOI] [PMC free article] [PubMed] [Google Scholar]
- 30.Gong H, Beauchamp M, Perry S, Woolley AT, Nordin GP. Optical approach to resin formulation for 3D printed microfluidics. RSC Advances. 2015;5:106621–106632. doi: 10.1039/C5RA23855B. [DOI] [PMC free article] [PubMed] [Google Scholar]
- 31.Gong H, Woolley AT, Nordin GP. High density 3D printed microfluidic valves, pumps, and multiplexers. Lab Chip. 2016;16:2450–2458. doi: 10.1039/c6lc00565a. [DOI] [PMC free article] [PubMed] [Google Scholar]
Associated Data
This section collects any data citations, data availability statements, or supplementary materials included in this article.
Supplementary Materials
Fig. S1 Fabrication schematic for integrated microfluidicde vices
Fig. S2 Fluorescence detection during elution from a C8 monolith in a microfluidic device. 40 μM AF 488 was loaded on the monolith and eluted in different ACN solutions made in 10 mM BCB pH 9.9


