

Abstract
Objectives
Intra-abdominal pressure (IAP) may contribute to pelvic floor health, though the direction and magnitude of such an effect, if any, is not yet known. Identifying individual characteristics, and in particular modifiable factors, associated with higher IAP during recovery from vaginal childbirth might serve to mitigate early pelvic floor dysfunction. The aim of this study was to identify characteristics associated with maximal IAP during lifting in postpartum primiparous women that delivered vaginally.
Methods
At 6 to 10 weeks post-partum, we measured maximal IAP, assessed via an upper vaginal sensor, as participants (enrolled in an ongoing cohort study) lifted a weighted car seat (12.5 kg). We evaluated whether the following independent variables were associated with maximal IAP: age, ethnicity, body mass index, height, abdominal circumference, weight gain during pregnancy, lifting time, breath holding during lifting, lifting technique, measures of muscular fitness, and days since delivery.
Results
In the 206 participants, weight, waist circumference, body mass index, and days since delivery were positively associated with mean maximal IAP during lifting, while IAP decreased as height increased. As the duration of the lifting task increased, mean maximal IAP during lifting also increased, but there were no associations between lifting technique or breath-holding during lifting and IAP. Neither pelvic floor muscle strength nor abdominal muscle endurance were associated with IAP during lifting.
Conclusion
Other than measures of body habitus and lifting duration, we did not identify modifiable factors that could mitigate maximal pressures experienced by the pelvic floor during the early post-partum period.
Keywords: Pelvic organ prolapse, pelvic floor disorders, urinary incontinence, physical activity, intra-abdominal pressure
INTRODUCTION
Vaginal childbirth is the strongest known risk factor for developing the signs and symptoms of pelvic organ prolapse (POP) and for surgical repair.1, 2 Yet, most women deliver vaginally and one in five to one in nine will undergo POP surgery in her lifetime.3–5 Using an integrated lifespan model, DeLancey et al describe three life phases during which protective and deleterious factors that influence pelvic floor function occur: 1) developing optimal functional reserve during a woman’s growth, 2) childbirth, and in particular, vaginal birth, in which variations of injury and recovery occur during and following delivery and 3) deterioration that occurs with advancing age.6
While many of these factors, such as genetics, are not modifiable, one factor frequently attributed to increasing the risk for POP may be intra-abdominal pressure (IAP). Occupations that involve heavy labor or heavy lifting appear to increase the risk for pelvic organ prolapse.7 The association between occupational or recreational activities that increase IAP and POP is not yet fully established; yet, the American Urogynecologic Society, on its patient portal, recommends that women use their lower back or abdomen for heavy lifting, and use their leg and arm muscles as much as possible to prevent POP8, presumably in attempts to decrease the amount of force exerted on the pelvic floor. The Royal College of Obstetricians and Gynaecologists notes that avoiding heavy lifting and physical activity such as trampolining and high-impact activity may stop prolapse from becoming worse.9 Patients with POP are often counseled to avoid heavy lifting or high impact exercise; as Barber points out, this is not supported by evidence but as it offers little risk, may be reasonable.10 Even more commonly, patients that have undergone pelvic surgery are advised to restrict many activities for varying durations.11 Several researchers have questioned the validity of these recommendations, noting that IAPs during restricted activities are often less than those during unrestricted ones (such as getting up from a chair).12–14
If IAP is found to be an established risk factor for POP, then it makes sense to attempt to decrease activities that raise IAP, as suggested by AUGS, to the extent possible. In particular, it seems logical to do this during one particularly vulnerable time for the pelvic floor: the postpartum period following vaginal childbirth. Lifting is an example of an activity that increases IAP11, 13 but is largely unavoidable for new mothers who must lift and transfer their babies. Lifting a baby in a car seat is a particularly strenuous task for many women. Compared to walking while carrying a 13.6 kg load (similar to that of a 3-month old in a car seat) in a backpack, carrying the load as one must for a car seat significantly increased IAP (mean (SD) 55.5 (11.4) cm H2O for carrying in backpack, 65.8 (10.6) for carrying awkwardly at the side and 77.3 (13.1) for carrying in front of body; p<0.0001).15
We hypothesized that there might be modifiable factors associated with IAP generated during this largely unavoidable postpartum activity. Thus, the aim of this study was to identify individual characteristics associated with maximal IAP during lifting a weighted car seat in primiparous women that delivered vaginally 6 to 10 weeks postpartum.
METHODS
This is an observational ancillary study that includes participants drawn from an ongoing prospective cohort study, which enrolls nulliparous women during the third trimester and follows those that deliver vaginally for one year postpartum. In addition to subsequently excluding women that delivered by cesarean, we also excluded those that delivered before 37 weeks gestation. Complete methods of the parent study are described elsewhere.16 The aims of the parent study that investigate IAP as a risk factor include to determine whether IAP measured at 6 to 10 weeks postpartum during lifting and abdominal muscle endurance testing predicts pelvic floor support and symptoms one year postpartum, and whether measures of muscular fitness (abdominal muscle endurance, pelvic floor muscle strength and grip strength) will modify the effect of IAP during lifting on pelvic floor support at one year postpartum. The current study was conducted at four sites in the Salt Lake Valley. The study was approved by the relevant IRBs and all participants completed written informed consent. For the current study, we examined data from the first 206 women to complete the 6–10 week postpartum study visit before November 16, 2016.
During the 6 to 10 week postpartum study visit, height and weight were assessed with women dressed in light clothing without shoes by medical scale and wall stadiometer. Height and weight were used to calculate body mass index (BMI, kg/m2). Weight gain during pregnancy was obtained by subtracting the last recorded weight prior to delivery from the self-report of pre-pregnancy weight. Waist circumference was measured (cm) at the natural waist. As per American College of Sports Medicine’s Guidelines, the mean of two trials was recorded.17
Intra-abdominal pressure was measured using a vaginal sensor system developed and validated by our group.18, 19 The sensor was inserted into the upper third of the vagina by a trained clinical coordinator. With the sensor in place, women lifted a car seat which weighed 6.8 kg (based on weight of top selling car seats at the time of study planning) with a 5.7 kg added “infant” weight (based on the 50th percentile for weight in boys at 10 weeks in the U.S.20), for a total weight of 12.5 kg. Women lifted the car seat three times. Using a previously described peak measurement algorithm, given that pressure tracings for the three-lift activity consistently produced 4 to 7 peaks, mean maximal IAP was reported as average of the five highest “peaks” recorded during the lifting task that were at least 1 second apart.21 Clinical coordinators observed, and, guided by line drawings delineating lifting techniques, noted whether women lifted with flexed knees, straight knees or something in between for each lift. Women reported whether breath holding occurred during each lift. We did not instruct women on how to lift or breathe, as we were interested in measuring IAP during their usual method of lifting. The standing resting pressure was calculated by averaging pressure during a 10-second period during which women were standing without movement.
Women completed an abdominal muscle endurance test as a measure of muscular fitness.22 While seated on an exam table with hips and knees flexed to 90 degrees and feet secured, women were asked to sustain an isometric abdominal contraction for as long as possible while maintaining a 60-degree angle with reference to the table as guided by a wedge positioning device. The hold time during this test was used as the measure of abdominal endurance. We evaluated pelvic muscle strength using the Brinks scale.23
The primary outcome evaluated was mean maximal IAP during lifting. We considered factors that were biologically plausible in terms of contributing to IAP variability during lifting, and included those related to increased force on the pelvic floor, muscular fitness, distance/moment, and technique of lifting. Thus, we assessed whether the following independent variables were associated with the primary outcome: body mass index, height (as measure of distance/moment), abdominal circumference, weight gain during pregnancy, pelvic floor muscle strength, abdominal muscle endurance, time to complete the lifting task, breath-holding during lifting, and lifting technique (bent vs straight knees).
Statistical analysis
In order to achieve 90% power to detect a R-Squared of 0.20 attributed to 20 independent variable(s) using an F-Test with a significance level (alpha) of 0.05, we would require a minimum sample size of 122 participants. The next frozen data file after this apriori calculation contained 206 participants, which resulted a minimum detectable R2 of 0.12.
Summary statistics (mean/standard deviation, and frequency count and percentage) were first calculated for all relevant variables. We first fit univariate linear regression of the mean maximal IAP during lifting on all the potential predictors, and then placed those predictors that were significant at the 0.20 level into a multivariable linear regression model. For each of the continuous predictors, a penalized B-spline curve was also plotted to examine the linear relationship between the predictor and mean maximal IAP during lifting. A stepwise variable selection process was then carried out to find the final model with statistical and clinical significant predictors. Collinearity was checked via Pearson correlation coefficient between groups of variables that measured similar outcomes.
RESULTS
The mean age (SD) of the 206 participants was 27.38 (5.00) years. Forty-four (21.36%) were of Hispanic ethnicity. Participant characteristics are summarized in Table 1.
Table 1.
Characteristics of the study population*
| Characteristic | Mean (SD) | Range: Minimum, Maximum |
|---|---|---|
| Age (years) | 27.38 (5.00) | 18.00, 38.68 |
| Days since delivery | 51.18 (9.80)** | 34.0, 76.0 |
| Body mass index (kg/m2) | 26.39 (5.17) | 18.44, 49.44 |
| Weight (kg) | 71.41 (14.96) | 47.17, 134.27 |
| Height (m) | 1.64 (0.07) | 1.45, 1.83 |
| Waist circumference (cm) | 80.90 (11.68) | 57.35, 155.00 |
| Weight gain during pregnancy (kg) | 13.08 (5.78) | −11.57, 27.22 |
| Pelvic floor muscle strength** | 8.59 (2.52) | 3.00, 12.00 |
| Abdominal muscle endurance test duration (sec) | 153.30 (144.21) | 9.00, 1022.00 |
| Lifting task duration (sec) | 26.58 (6.73) | 14.00, 65.00 |
| Mean IAP*** during standing (cm H2O) | 36.72 (7.06) | 10.74, 59.58 |
| Mean Maximal IAP*** during lifting task (cm H2O) | 53.62 (10.31) | 26.10, 80.28 |
Age at study enrollment in third trimester; remaining variables at 8-week postpartum study visit; weight gain during pregnancy reflects difference between last recorded weight at antenatal clinical visit and self-reported pre-pregnancy weight
Two influential outliers removed whose time from delivery was beyond the study visit window, at 92 and 113 days.
Measured according to Brinks Scale, with possible range of 3 (poor strength) to 12 (excellent strength)
IAP=Intra-abdominal pressure
The distribution of mean maximal IAP during lifting is shown in Figure 1.
Figure 1.
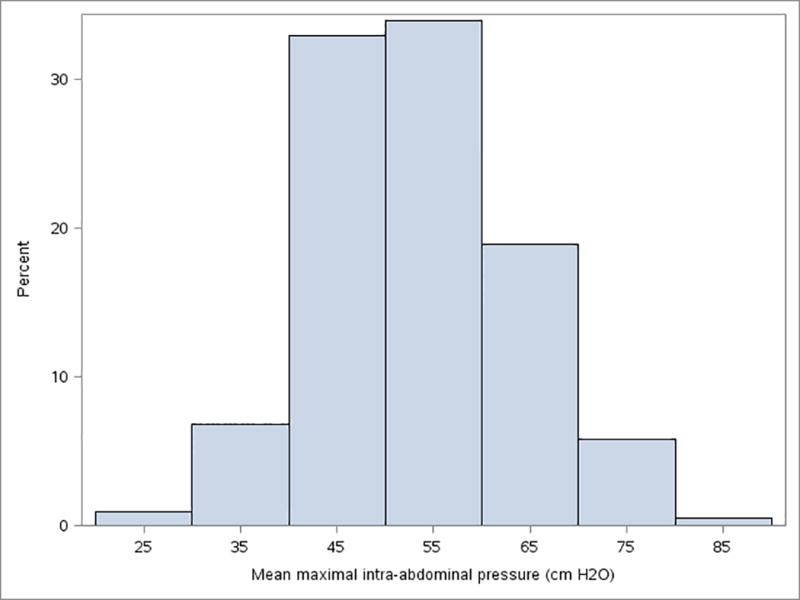
Distribution of mean maximal intra-abdominal pressure during lifting
While lifting the loaded car seat, most women maintained their legs in a relatively straight position (95; 46.12%) during at least two of the three lifts, while 59 (28.64%) bent their legs throughout the lift and 52 (25.24%) lifted with their legs in between straight and bent. Seventy (34.31%) reported holding their breath during the last lift, while 134 (65.69%) did not hold their breath (two did not respond to this question).
Weight, waist circumference and body mass index were positively associated with mean maximal IAP during lifting, while IAP decreased as height increased. Weight gain during pregnancy was not associated with mean maximal IAP during lifting (one influential outlier who lost 11.6 kg during pregnancy was removed from this analysis). As the duration of the lifting task increased, mean maximal IAP during lifting also increased, but there were no associations between leg position or breath-holding during lifting and IAP. IAP also increased slightly as the number of days since delivery increased. Neither pelvic floor muscle strength nor abdominal muscle endurance were associated with IAP during lifting. Associations between mean maximal IAP during lifting and factors assessed are summarized in Table 2 based on univariate analysis.
Table 2.
Univariate analysis of the associations between mean maximal IAP during lifting and participant characteristics
| Characteristic | Estimate* (SE) | P- value |
|---|---|---|
|
| ||
| Age (years) | −0.09 (0.14) | 0.513 |
|
| ||
| Ethnicity | 0.628 | |
| Hispanic vs Non-Hispanic | 0.85 (1.76) | |
|
| ||
| Days since delivery | 0.21 (0.07) | 0.005 |
|
| ||
| Body mass index (kg/m2) | 0.41 (0.14) | 0.003 |
|
| ||
| Weight (kg) | 0.04 (0.02) | 0.059 |
|
| ||
| Height (m) | −0.55 (0.25) | 0.030 |
|
| ||
| Waist circumference (cm) | 0.18 (0.06) | 0.003 |
|
| ||
| Weight gain during pregnancy** (kg) | −0.18 (0.14) | 0.183 |
|
| ||
| Pelvic floor muscle strength | ||
| 3–6 | (reference) | |
| 7–9 | −2.08 (2.33) | 0.372 |
| 10–12 | −1.06 (2.34) | 0.652 |
|
| ||
| Abdominal muscle endurance test duration (sec) | −0.004 (0.005) | 0.400 |
|
| ||
| Lifting task duration (sec) | 0.20 (0.11) | 0.059 |
|
| ||
| Mean intra-abdominal pressure during standing (cm H2O) | 0.93 (0.08) | <.001 |
|
| ||
| Lifting technique | ||
| Straight legs | (reference) | 0.551 |
| Bent legs | −1.02 (1.71) | 0.339 |
| In between | −1.71 (1.78) | |
|
| ||
| Held breath during lifting | ||
| No vs Yes | −1.35 (1.52) | 0.376 |
For each additional unit of increase in the independent variable, IAP is expected to increase by this coefficient.
One influential outlier who lost 11.5 kg during pregnancy was removed for analysis.
In addition, standing IAP was, as expected, positively associated with IAP during lifting. Standing IAP was also associated with weight (p=.021), waist circumference (p=.003), and body mass index (p=.010) but not height (p=.99).
As anticipated, the three measures of body composition were highly correlated, with Pearson correlation coefficients as follows: BMI and weight, r=0.899; BMI and waist circumference, r=0.873; weight and waist circumference, r=0.845. There were positive but weak correlations between these measures and IAP. For IAP during lifting and standing, respectively, correlation coefficients were 0.21 and 0.18 for BMI, 0.13 and 0.16 for weight and 0.20 and 0.21 for waist circumference. Height was, as noted, negatively correlated with IAP during lifting (r=−0.15) but was not correlated with IAP during standing (r<0.01).
Given the collinearity between the measures of body composition, we constructed separate final linear regression models for each of weight and waist circumference, controlled for lifting task duration, days since delivery, and height in each model. We did not include standing IAP given that it is contained within lifting IAP; that is, lifting IAP includes standing IAP and the additional net IAP required for the task. In models with weight and waist circumference, lifting task duration, height, days since delivery, and each measure of body habitus remained significantly associated with IAP during lifting, with similar effect sizes in each model (Table 3).
Table 3.
Results of linear regression modeling showing effects of participant characteristics on mean maximal intra-abdominal pressure during lifting task
| Model | Estimate (95% confidence limits) | Standard error | P value |
|---|---|---|---|
| 1 | |||
| Lift duration (sec) | 0.25 (0.05, 0.46) | 0.10 | 0.015 |
| Height (m) | −27.88 (−48.97, −6.78) | 10.70 | 0.010 |
| Weight (kg) | 0.14 (0.04, 0.24) | 0.05 | 0.005 |
| Days since delivery | 0.16 (0.02, 0.31) | 0.07 | 0.028 |
| 2 | |||
| Lift duration (sec) | 0.26 (0.06, 0.47) | 0.10 | 0.012 |
| Height (m) | −21.11 (−40.66, −1.56) | 9.91 | 0.034 |
| Waist circumference (cm) | 0.17 (0.05, 0.29) | 0.06 | 0.005 |
| Days since delivery | 0.15 (0.01, 0.30) | 0.07 | 0.038 |
DISCUSSION
This observational study is the first of its kind evaluating factors that may affect intra-abdominal pressure specifically in the early post-partum period. In this cohort, we observed that measures of body habitus such as weight, BMI and waist circumference all had a positive association with maximum intra-abdominal pressure during lifting, but the correlations were weak. This finding is consistent with correlations reported by others between weight and intra-abdominal pressure measured by various means in different settings.24–28 We did not find an association between IAP during lifting and gestational weight gain. While the final pregnancy weight was obtained from the medical record at the prenatal visit preceding delivery, the recalled pre-pregnancy weight was provided by women at their first prenatal visit. Given that women tend to underreport their pre-pregnancy weight, it is possible that some bias exists in our measures of association pertaining to gestational weight gain. However, according to a recent systematic review, the correlation between self-reported pre-pregnancy weight, when reported within one year after the onset of pregnancy, and measured pre-pregnancy weight is high (r= 0.90 – 0.99).29
We were surprised that factors which we would hypothesize to affect IAP such as lifting technique and breath holding did not seem to affect IAP. In healthy non-pregnant adults, breath control, though not posture, affected IAP during dynamic weight lifting.30 It is possible that childbirth may reset the factors that lead to variability in IAP; that is, the muscles and connective tissues are altered as a result of childbirth at six to ten weeks postpartum may not be representative of a 'normal' physiological state, leading to different relationships between IAP and factors analyzed than might be seen in other populations. Indeed, the muscles and connective tissue of the abdomen, back and pelvic floor that are recovering after childbirth are precisely the structures that are recruited to increase IAP for postural bracing.31 The finding that IAP increased as time interval since birth increased supports abdominal wall and pelvic floor recovery. Over the short five week time period over which the study visits took place, IAP increased by about 6–7 cm H2O (0.16 cm H2O per extra day since delivery). While this increase is small, it is consistent with an increased ability to generate IAP as the muscles and connective tissue gain strength in the weeks to months after childbirth. Given that a modest amount of abdominal strength training can significantly increase a person’s ability to generate intraabdominal pressure,32 it is reasonable to attribute a gradual increase in IAP during lifting with longer time since delivery to improved function of the abdominal wall, spine and pelvic floor muscles and connective tissue.
While a possible explanation for the increase in IAP associated with duration of the lifting task might be that women who were less fit took longer to lift and also had higher IAP, muscular fitness measured by pelvic floor strength and abdominal muscle endurance was not associated with IAP. There may be unmeasured confounding factors that explain this relationship. However even if the association is causal the clinical significance is limited because our data indicate that for every 10 second decrease in lifting duration the IAP decreases only by 2 cm H2O (table 2). Thus, given the unclear relevance of this detected association, we do not at this point recommend interventions to decrease lifting time.
The negative relationship between height and mean maximal IAP during lifting is intriguing and appears to not be previously reported. It is possible that height affects the length of the torso and therefore the pressure distribution on the pelvic floor. However, we found no association between height and mean IAP during standing at rest. Functionally, taller women in our study may have been more likely than shorter women to flex at the knees in order to grasp the car seat prior to lifting. Yet, our observation of lifting technique was not associated with IAP during lifting.
The large numbers in this cohort of women in the early post-partum period is novel and a strength of this study. Our adherence to scripted activity at a set weight limited confounding variables such as fatigue with task. The IAP findings reported are limited to a short time point and not generalizable to all daily activities; it is possible that associations differ with repeated lifting throughout the day. It is also possible that IAP might have differed had we instructed women on exactly how to lift, rather than asking them to lift according to their usual practice. Additionally, lifting technique could have broader implications than simply IAP and may impact lumbar strain and other musculoskeletal health outcomes.
We again confirmed the highly inter-individual variability of mean maximal IAP. While care should always be taken before generalizing observations to a larger population, aside from body habitus, we were not able to find modifiable factors that could mitigate maximal pressures experienced by the pelvic floor during the early post-partum period. Results from the parent research study (anticipated completion 2019–20) will provide information about various factors, including IAP, predictive of pelvic floor health one year postpartum. If IAP is found to be either helpful or harmful, future intervention studies will be indicated to determine whether this effect can be mitigated or promoted.
Acknowledgments
Funding statement: The project described was supported by Grant Number 1P01HD080629 from the Eunice Kennedy Shriver National Institute of Child Health and Human Development. Its contents are solely the responsibility of the authors and do not necessarily represent the official views of the National Institutes of Health.
Footnotes
Competing interests statement: NONE of the investigators report competing interests to disclose.
Contributor Information
Yvonne Hsu, Department of Obstetrics and Gynecology, University of Utah, Yvonne.hsu@hsc.utah.edu.
Robert Hitchcock, Department of Bioengineering, University of Utah, r.hitchcock@utah.edu.
Stefan Niederauer, Department of Bioengineering, University of Utah, stefan.niederauer@utah.edu.
Ingrid E. Nygaard, Department of Obstetrics and Gynecology, University of Utah, Ingrid.nygaard@hsc.utah.edu.
Janet M. Shaw, Department of Health, Kinesiology, and Recreation, University of Utah, Janet.Shaw@health.utah.edu.
Xiaoming Sheng, Department of Pediatrics, University of Utah, Xiaoming.Sheng@hsc.utah.edu.
References
- 1.Mant J, Painter R, Vessey M. Epidemiology of genital prolapse: observations from the Oxford Family Planning Association Study. Br J Obstet Gynaecol. 1997;104:579–85. doi: 10.1111/j.1471-0528.1997.tb11536.x. [DOI] [PubMed] [Google Scholar]
- 2.Hallock JL, Handa VL. The Epidemiology of Pelvic Floor Disorders and Childbirth: An Update. Obstet Gynecol Clin North Am. 2016;43:1–13. doi: 10.1016/j.ogc.2015.10.008. [DOI] [PMC free article] [PubMed] [Google Scholar]
- 3.Handa VL, Blomquist JL, Knoepp LR, Hoskey KA, Mcdermott KC, Munoz A. Pelvic floor disorders 5–10 years after vaginal or cesarean childbirth. Obstet Gynecol. 2011;118:777–84. doi: 10.1097/AOG.0b013e3182267f2f. [DOI] [PMC free article] [PubMed] [Google Scholar]
- 4.Huberty JL, Coleman J, Rolfsmeyer K, Wu S. A qualitative study exploring women's beliefs about physical activity after stillbirth. BMC Pregnancy Childbirth. 2014;14:26. doi: 10.1186/1471-2393-14-26. [DOI] [PMC free article] [PubMed] [Google Scholar]
- 5.Smith FJ, Holman CD, Moorin RE, Tsokos N. Lifetime risk of undergoing surgery for pelvic organ prolapse. Obstet Gynecol. 2010;116:1096–100. doi: 10.1097/AOG.0b013e3181f73729. [DOI] [PubMed] [Google Scholar]
- 6.Delancey JO, Kane Low L, Miller JM, Patel DA, Tumbarello JA. Graphic integration of causal factors of pelvic floor disorders: an integrated life span model. Am J Obstet Gynecol. 2008;199:610 e1–5. doi: 10.1016/j.ajog.2008.04.001. [DOI] [PMC free article] [PubMed] [Google Scholar]
- 7.Nygaard IE, Shaw JM. Physical activity and the pelvic floor. Am J Obstet Gynecol. 2016;214:164–71. doi: 10.1016/j.ajog.2015.08.067. [DOI] [PMC free article] [PubMed] [Google Scholar]
- 8.American Urogynecologic Society. [accessed 03/04/17];2017 http://wwwvoicesforpfdorg/p/cm/ld/fid=25.
- 9.Royal College of Obstetricians and Gynaecologists. Patient information leaflet. [accessed 06/01/17]; https://wwwrcogorguk/globalassets/documents/patients/patient-information-leaflets/gynaecology/pi-pelvic-organ-prolapsepdf.
- 10.Barber MD. Pelvic organ prolapse. BMJ. 2016;354:i3853. doi: 10.1136/bmj.i3853. [DOI] [PubMed] [Google Scholar]
- 11.Nygaard IE, Hamad NM, Shaw JM. Activity restrictions after gynecologic surgery: is there evidence? Int Urogynecol J. 2013;24:719–24. doi: 10.1007/s00192-012-2026-2. [DOI] [PMC free article] [PubMed] [Google Scholar]
- 12.Weir LF, Nygaard IE, Wilken J, Brandt D, Janz KF. Postoperative activity restrictions: any evidence? Obstet Gynecol. 2006;107:305–9. doi: 10.1097/01.AOG.0000197069.57873.d6. [DOI] [PubMed] [Google Scholar]
- 13.Gerten KA, Richter HE, Wheeler TL, 2nd, et al. Intraabdominal pressure changes associated with lifting: implications for postoperative activity restrictions. Am J Obstet Gynecol. 2008;198:306 e1–5. doi: 10.1016/j.ajog.2007.09.004. [DOI] [PMC free article] [PubMed] [Google Scholar]
- 14.Yamasato KS, Oyama IA, Kaneshiro B. Intraabdominal pressure with pelvic floor dysfunction: do postoperative restrictions make sense? J Reprod Med. 2014;59:409–13. [PubMed] [Google Scholar]
- 15.Coleman TJ, Hamad NM, Shaw JM, et al. Effects of walking speeds and carrying techniques on intra-abdominal pressure in women. Int Urogynecol J. 2015;26:967–74. doi: 10.1007/s00192-014-2593-5. [DOI] [PMC free article] [PubMed] [Google Scholar]
- 16.Nygaard IE, Clark E, Clark L, et al. Physical and cultural determinants of postpartum pelvic floor support and symptoms following vaginal delivery: a protocol for a mixed-methods prospective cohort study. BMJ Open. 2017;7:e014252. doi: 10.1136/bmjopen-2016-014252. [DOI] [PMC free article] [PubMed] [Google Scholar]
- 17.Pescatello L, Arena R, Riebe D, Thompson P. ACSM's Guidelines for Exercise Testing and Prescription. Philadelphia: Lippincott Williams & Wilkins; 2013. [DOI] [PubMed] [Google Scholar]
- 18.Coleman TJ, Thomsen JC, Maass SD, Hsu Y, Nygaard IE, Hitchcock RW. Development of a wireless intra-vaginal transducer for monitoring intra-abdominal pressure in women. Biomed Microdevices. 2012;14:347–55. doi: 10.1007/s10544-011-9611-x. [DOI] [PMC free article] [PubMed] [Google Scholar]
- 19.Hsu Y, Coleman TJ, Hitchcock RW, Heintz K, Shaw JM, Nygaard IE. Clinical evaluation of a wireless intra-vaginal pressure transducer. Int Urogynecol J. 2012 doi: 10.1007/s00192-012-1811-2. [DOI] [PMC free article] [PubMed] [Google Scholar]
- 20.Centers for Disease Control. Growthcharts. [accessed 06 01 17]; https://wwwcdcgov/growthcharts/clinical_chartshtm.
- 21.Hamad NM, Shaw JM, Nygaard IE, et al. More complicated than it looks: The vagaries of calculating intra-abdominal pressure. J Strength Cond Res. 2013 doi: 10.1519/JSC.0b013e31828b8e4c. [DOI] [PMC free article] [PubMed] [Google Scholar]
- 22.Mcgill S, Childs A, Liebenson C. Endurance times for low back stabilization exercises: clinical targets for testing and training from a normal database. Arch Phys Med Rehabil. 1999;80:941–44. doi: 10.1016/s0003-9993(99)90087-4. [DOI] [PubMed] [Google Scholar]
- 23.Brink CA, Wells TJ, Sampselle CM, Taillie ER, Mayer R. A digital test for pelvic muscle strength in women with urinary incontinence. Nurs Res. 1994;43:352–6. [PubMed] [Google Scholar]
- 24.Shaw JM, Hamad NM, Coleman TJ, et al. Intra-abdominal pressures during activity in women using an intra-vaginal pressure transducer. J Sports Sci. 2014;32:1176–85. doi: 10.1080/02640414.2014.889845. [DOI] [PMC free article] [PubMed] [Google Scholar]
- 25.Cobb WS, Burns JM, Kercher KW, Matthews BD, James norton H, Todd heniford B. Normal intraabdominal pressure in healthy adults. J Surg Res. 2005;129:231–5. doi: 10.1016/j.jss.2005.06.015. [DOI] [PubMed] [Google Scholar]
- 26.Madjar S, Balzarro M, Appell RA, Tchetgen MB, Nelson D. Baseline abdominal pressure and valsalva leak point pressures-correlation with clinical and urodynamic data. Neurourol Urodyn. 2003;22:2–6. doi: 10.1002/nau.10073. [DOI] [PubMed] [Google Scholar]
- 27.Richter HE, Kenton K, Huang L, et al. The impact of obesity on urinary incontinence symptoms, severity, urodynamic characteristics and quality of life. J Urol. 2010;183:622–8. doi: 10.1016/j.juro.2009.09.083. [DOI] [PMC free article] [PubMed] [Google Scholar]
- 28.Noblett KL, Jensen JK, Ostergard DR. The relationship of body mass index to intra-abdominal pressure as measured by multichannel cystometry. Int Urogynecol J Pelvic Floor Dysfunct. 1997;8:323–6. doi: 10.1007/BF02765589. [DOI] [PubMed] [Google Scholar]
- 29.Headen I, Cohen AK, Mujahid M, Abrams B. The accuracy of self-reported pregnancy-related weight: a systematic review. Obes Rev. 2017;18:350–69. doi: 10.1111/obr.12486. [DOI] [PubMed] [Google Scholar]
- 30.Hagins M, Pietrek M, Sheikhzadeh A, Nordin M, Axen K. The effects of breath control on intra-abdominal pressure during lifting tasks. Spine (Phila Pa 1976) 2004;29:464–9. doi: 10.1097/01.brs.0000092368.90019.d8. [DOI] [PubMed] [Google Scholar]
- 31.Stokes IA, Gardner-Morse MG, Henry SM. Intra-abdominal pressure and abdominal wall muscular function: Spinal unloading mechanism. Clin Biomech (Bristol, Avon) 2010;25:859–66. doi: 10.1016/j.clinbiomech.2010.06.018. [DOI] [PMC free article] [PubMed] [Google Scholar]
- 32.Tayashiki K, Maeo S, Usui S, Miyamoto N, Kanehisa H. Effect of abdominal bracing training on strength and power of trunk and lower limb muscles. Eur J Appl Physiol. 2016;116:1703–13. doi: 10.1007/s00421-016-3424-9. [DOI] [PubMed] [Google Scholar]