

Abstract
The Notch signaling pathway mediates cell fate decisions1,2 and is tumor suppressive or oncogenic depending on the context2,3. During lung development, Notch pathway activation inhibits the differentiation of precursor cells to a neuroendocrine (NE) fate4–6. In small cell lung cancer (SCLC), an aggressive NE lung cancer7, loss-of-function NOTCH mutations and the inhibitory effects of ectopic Notch activation indicate that Notch signaling is tumor suppressive8,9. Here, we show that Notch signaling can be both tumor suppressive and pro-tumorigenic in SCLC. Endogenous activation of the Notch pathway results in a NE to non-NE fate switch in 10-50% of tumor cells in a mouse model of SCLC and in human tumors. This switch is mediated in part by Rest/Nrsf, a transcriptional repressor that inhibits NE gene expression. Non-NE Notch-active SCLC cells are slow growing, consistent with a tumor suppressive role for Notch, but these cells are also relatively chemoresistant and provide trophic support to NE tumor cells, consistent with a pro-tumorigenic role. Importantly, Notch blockade in combination with chemotherapy suppresses tumor growth and delays relapse. Thus, SCLC tumors generate their own microenvironment via activation of Notch signaling in a subset of tumor cells, and the presence of these cells may serve as a biomarker for the use of Notch pathway inhibitors in combination with chemotherapy in select SCLC patients.
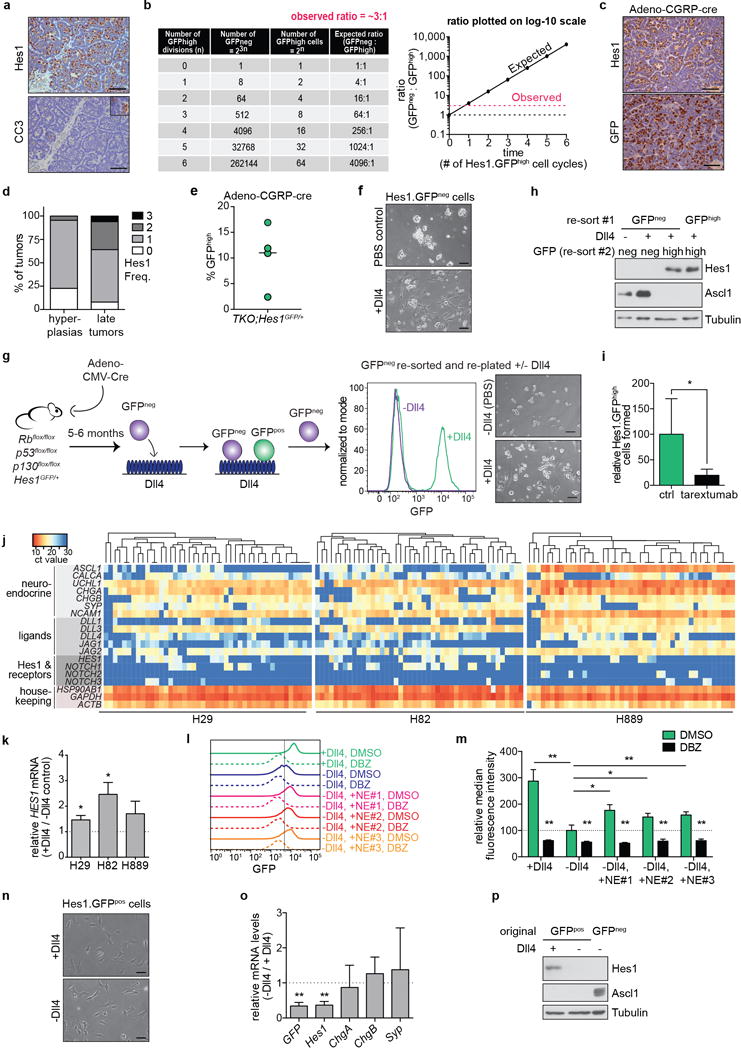
We examined Notch pathway activity in SCLC by immunostaining for Hes1, a transcriptional target of the pathway8. Almost all tumors in a p53flox/flox;Rbflox/flox;p130flox/flox conditional triple knockout (TKO) SCLC mouse model10 and a majority of human SCLC tumors express detectable levels of Hes1 (Fig. 1a-d and Extended Data Fig. 1a, b). In TKO Hes1GFP/+ mice, in which GFP is expressed from the endogenous Hes1 promoter11 (Fig. 1e and Extended Data Fig. 1c, d), both GFPneg and GFPhigh cells within tumors have undergone Cre-mediated recombination (Extended Data Fig. 1e-g). HES1-positive (HES1pos) cells within human tumors have histopathological features of SCLC tumor cells (analyzed by a board-certified pathologist, C.K.), further supporting their tumoral origin. Relative to GFPneg cells, GFPhigh cells sorted from TKO Hes1GFP/+ tumors express higher levels of Hes1, Nrarp (a Notch target12), and Notch1/2/3 (Fig. 1f). Conversely, GFPneg cells express higher levels of most Notch ligands, including the atypical ligand Dll3, a known target of Ascl1, itself a key regulator of NE differentiation and SCLC growth13,14 (Fig. 1f). Immunostaining for Hes1 and Notch2 in mouse tumors showed similar staining patterns (Extended Data Fig. 2a). Notch pathway ligands, receptors, and targets are also expressed in human SCLC cell lines15 and tumors (Extended Data Fig. 2b). Treatment with the γ-secretase inhibitor dibenzazepine (DBZ)16 led to the accumulation of the inactive form of Notch and decreased GFP, Hes1 and Nrarp expression in TKO Hes1GFP/+ tumors (Fig. 1g and Extended Data Fig. 2c-g). GFPhigh SCLC cells grown without the Notch ligand Dll4 showed decreased expression of GFP, Hes1, and the transcriptionally active Notch1 intra-cellular domain (N1ICD) (Fig. 1h and Extended Data Fig. 2h, i). Thus, a significant fraction of SCLC cells activate endogenous Notch signaling.
Figure 1. SCLC tumors harbor slow-growing, Notch-active non-neuroendocrine tumor cells.
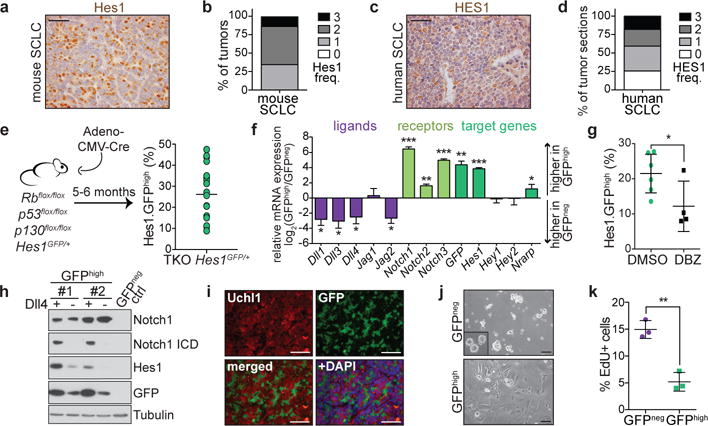
a,b, Representative Hes1 IHC (a) and frequency of Hes1pos cells (b) in mouse SCLC (n=5 mice, 83 tumors).
c,d, As in a,b, for human SCLC (n=172 sections).
e, Flow cytometry of %GFPhigh cells from pooled TKO Hes1GFP/+ tumors (n=18 mice).
f, qRT-PCR of Notch pathway genes in GFPhigh relative to GFPneg tumor cells (n=3 mice).
g, As in e, with mice treated with DMSO (n=5 mice) or DBZ (n=4 mice).
h, Immunoblots of GFPhigh cell lines grown with Dll4 or 72 hours after removal from Dll4.
i, GFP and Uchl1 (NE marker) immunofluorescence in TKO Hes1GFP/+ tumors (representative of n=3 biological replicas).
j, Images of cell cultures established from GFPneg and GFPhigh tumor cells (representative of n=5 biological replicas). Inset: NE KP1 SCLC cell line.
k, EdU incorporation in cells sorted from TKO Hes1GFP/+ tumors (n=3 mice).
*P < 0.05; **P < 0.01; ***P < 0.001. Two-tailed paired (f,k) or unpaired (g) Student’s t-test. Data are mean ± s.d. Scale bars, 50 μm.
Consistent with the inhibition of NE differentiation by Notch during development4–6, GFPhigh cells expressed lower levels of NE genes relative to GFPneg cells in TKO Hes1GFP/+ tumors (Fig. 1i and Extended Data Fig. 2j-l). Non-NE SCLC cells marked by high expression of CD44 and mesenchymal markers (e.g. vimentin) were previously described17, but the majority of GFPhigh cells express the epithelial marker EpCam, have no detectable CD44 on their surface, and do not upregulate vimentin (Extended Data Fig. 2m, n), indicating that GFPhigh and CD44high cell populations within primary TKO tumors are largely distinct. Cell lines of GFPneg cells grow as floating clusters typical of NE SCLC while GFPhigh cells grow adherently, further suggestive of a change in differentiation (Fig. 1j). Microarray gene expression analysis of GFPhigh and GFPneg cells (Extended Data Fig. 3a, b and Supplementary Table 1) supported an enrichment for Notch pathway activation (Extended Data Fig. 3c and Supplementary Table 2) and a suppression of neuroendocrine/neuronal differentiation in GFPhigh cells (Extended Data Fig. 3d-h and Supplementary Tables 3 and 4). GFPhigh cells were also less proliferative than GFPneg cells and formed slower-growing tumors (Fig. 1k and Extended Data Fig. 4a-d). Thus, the phenotypes of TKO SCLC cells with endogenous Notch activity are consistent with the tumor suppressive effects of ectopic Notch activation in SCLC8.
Based on cell cycle and cell death analyses (Fig. 1k and Extended Data Fig. 5a), GFPneg cells should rapidly outcompete GFPhigh cells in tumors (Extended Data Fig. 5b), which is inconsistent with the observed ratio of approximately three GFPneg to one GFPhigh cell (Fig. 1e) and the similar frequencies of Hes1pos cells in early- and late-stage TKO tumors (Extended Data Fig. 1a). Tumors initiated by expressing Cre from the NE-specific CGRP promoter18 harbor Hes1pos cells (Extended Data Fig. 5c-e), indicating that both non-NE Hes1pos and NE Hes1neg cells can arise from a NE cell of origin. In single-cell qRT-PCR analysis of TKO tumor cells, all non-NE Hes1pos cells expressed at least one Notch receptor and all NE Hes1neg cells expressed at least one Notch ligand. However, a fraction of NE Hes1neg SCLC cells also expressed at least one receptor (Fig. 2a), suggesting that these cells may be responsive to Notch ligands. Indeed, stimulation of GFPneg tumor cells with a high affinity form of Dll419 induced GFP expression and non-NE phenotypes in ~50% of cells (Fig. 2b, c and Extended Data Fig. 5f). Isolation and replating of the cells that remained GFPneg on Dll4-coated plates showed that a subset could again be induced to express GFP (Extended Data Fig. 5g, h), suggestive of a cyclic or stochastic expression of Notch receptors on NE SCLC cells. Dll4 effects on GFPneg cells were suppressed by DBZ and the Notch2/3-blocking antibody tarextumab20 (Fig. 2d and Extended Data Fig. 5i). Cells that express both Notch ligands and receptors are also present in human SCLC cell lines, and Dll4 induced HES1 in these lines (Extended Data Fig. 5j, k). Although GFP expression in GFPhigh cell lines depends on exogenous Dll4 (Fig. 1h and Extended Data Fig. 2h, i), this dependence was partially rescued by co-culture with NE cell lines and the rescue was blocked by DBZ (Fig. 2e and Extended Data Fig. 5l, m), indicating that NE SCLC cells can provide Notch ligands to SCLC cells expressing Notch receptors. Thus, a subset of NE SCLC cells express levels of Notch that may be sufficient for signaling induction by ligands on neighboring cells, contributing to their transition towards a non-NE fate.
Figure 2. Notch activation generates non-neuroendocrine cells from neuroendocrine SCLC cells.
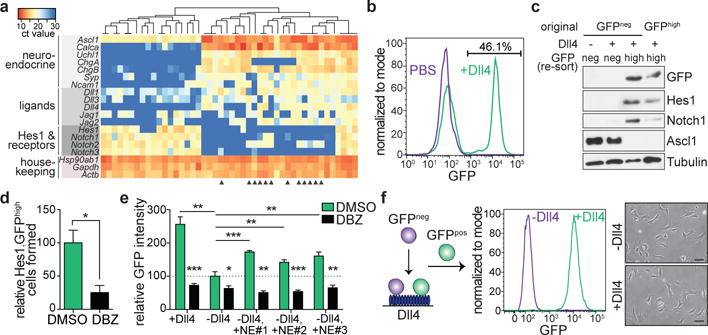
a, Unsupervised clustering of qRT-PCR (n=46 cells) from one TKO Hes1GFP/+ tumor (representative of n=2 experiments). Dark blue: undetectable expression. Arrowheads: NE cells that express at least one Notch receptor but have undetectable Hes1.
b, Flow cytometry of freshly isolated GFPneg cells grown on Dll4 or PBS control (representative of n=3 biological replicas).
c, Immunoblot of (b). GFPneg cells grown on Dll4 were re-sorted for GFPneg and GFPhigh populations.
d, Relative number of GFPhigh cells generated from freshly-isolated GFPneg cells grown on Dll4 after DBZ treatment (n=3 biological replicas).
e, Flow cytometry of a GFPhigh cell line treated with DMSO or DBZ while grown with or without Dll4 or co-cultured with 3 NE cell lines without Dll4 (n=3 biological replicas). Median GFP intensity normalized to DMSO; -Dll4.
f, Freshly isolated GFPneg cells that became GFPhigh after Dll4 exposure were replated with or without Dll4. Flow cytometry and images are shown (representative of n=2 biological replicas).
*P < 0.05; **P < 0.01; ***P < 0.001. Two-tailed paired Student’s t-test. Data are mean ± s.d. Scale bars, 50 μm.
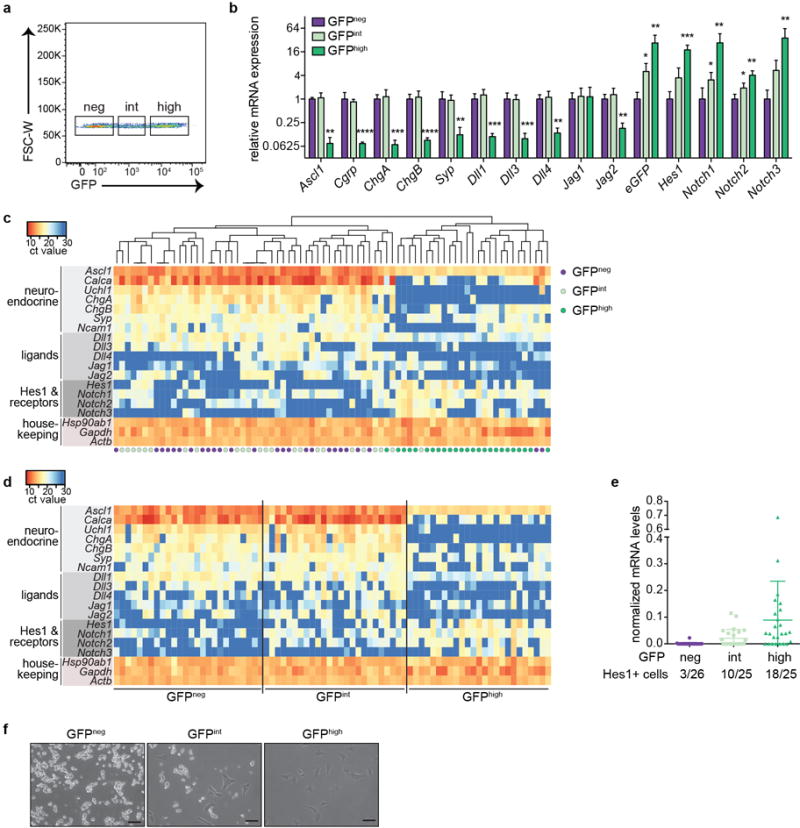
After establishment of the non-NE state, however, we observed no reversal to a NE state upon Notch pathway silencing (Fig. 2f and Extended Data Fig. 5n-p). SCLC cells with intermediate levels of GFP expression (GFPint cells) displayed intermediate activation of the Notch pathway, as expected, but clustered mostly with GFPneg cells and away from GFPhigh cells (Extended Data Fig. 6a-e). Thus, a certain threshold (strength and/or duration) of Notch pathway activation may be required to convert NE SCLC cells to the non-NE state. Nevertheless, some GFPint tumor cells are already in the process of switching to the non-NE state, as some adherent non-NE cells are formed from GFPint cells in culture (Extended Data Fig. 6f). These observations are reminiscent of some irreversible fate switches induced by Notch1,21, although we cannot exclude that some non-NE SCLC cells might retain the ability to revert to a NE state in specific contexts.
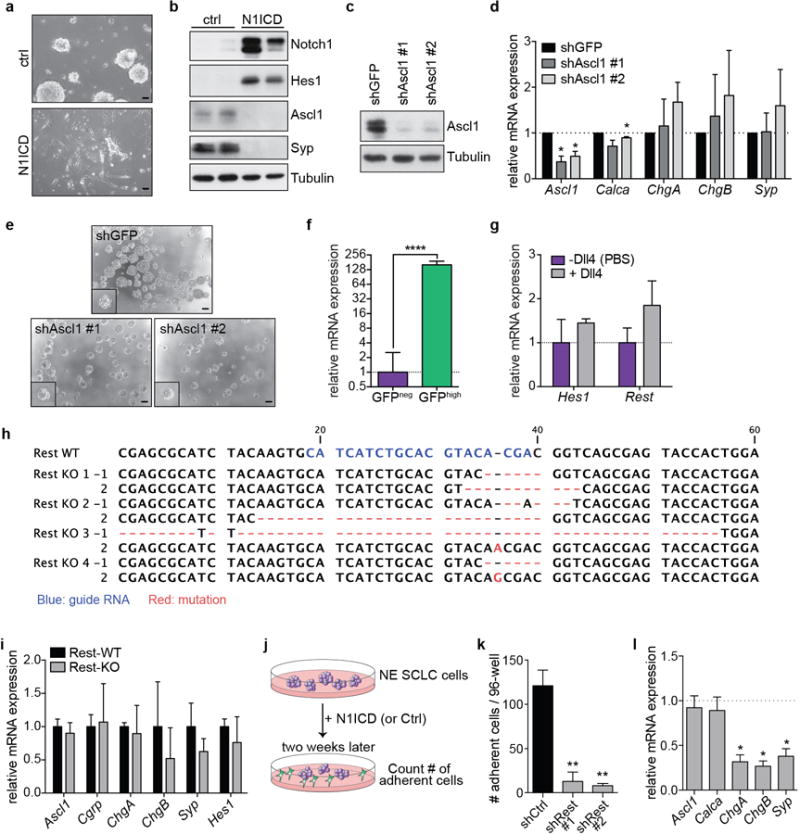
In SCLC cell lines, constitutive Notch activation results in a loss of NE differentiation after an initial growth suppressive phase8 (Extended Data Fig. 7a, b). NICD inhibits Ascl1 expression (Extended Data Fig. 7b and 8,22) but Ascl1 knockdown by itself did not significantly change the expression of NE genes and cellular morphology (Extended Data Fig. 7c-e), indicating that Ascl1 inhibition by Notch in SCLC cells is insufficient for the NE to non-NE switch. Analysis of microarray data (Supplementary Table 1) identified Rest/Nrsf as a candidate transcription factor that may repress genes expressed at lower levels in Notch-active, non-NE GFPhigh cells relative to NE GFPneg cells (Fig. 3a). Rest is a transcriptional repressor typically expressed in non-neuronal tissues where it suppresses the expression of neuronal genes23,24. Rest expression is higher in GFPhigh cells relative to GFPneg cells and is induced after Dll4 stimulation of GFPneg cells (Fig. 3b and Extended Data Fig. 7f, g). Rest is also a direct target of N1ICD (Fig. 3c, d). Rest downregulation did not affect the expression of NE genes (Extended Data Fig. 7h, i) but reduced the ability of N1ICD to induce a NE to non-NE transition in SCLC cells (Fig. 3e and Extended Data Fig. 7j, k). Rest binds to the promoters of NE genes (Fig. 3f) and its overexpression in NE SCLC cells was sufficient to downregulate the expression of NE genes and convert these cells to a non-NE phenotype (Fig. 3g, h and Extended Data Fig. 7l). Thus, induction of Rest is a critical step by which the Notch pathway inhibits NE differentiation in SCLC. Epigenetic remodeling involving repressor complexes containing Rest (reviewed in 25) may contribute to the irreversibility of the Notch-driven NE to non-NE switch in SCLC cells.
Figure 3. Rest is a Notch target that inhibits neuroendocrine differentiation in SCLC.
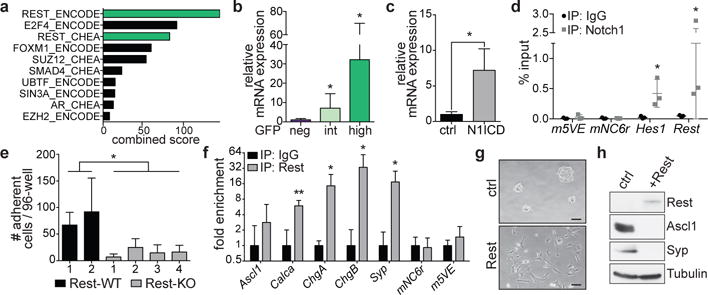
a, Top ten candidate factors from Enrichr analysis for the regulation of genes downregulated in GFPhigh cells.
b, qRT-PCR for Rest in cells sorted from TKO Hes1GFP/+ tumors (n=4 mice).
c,d, qRT-PCR for Rest (c) and Notch1 ChIP-qPCR (d) in KP1 cells overexpressing N1ICD (n=3 biological replicas with n=3 technical replicas). m5VE, mNC6R: negative control genomic regions.
e, Adherent cell numbers in Rest wild-type (WT) or knockout (KO) clones after N1ICD transduction (see Extended Data Fig. 7j) (n=3 biological replicas with n≥3 technical replicas each).
f, Rest ChIP-qPCR in KP1 cells (n=3 biological replicas with n=3 technical replicas each).
g,h, Images (g) and immunoblot (h) of KP1 cells ~1 month after Rest transduction (representative of n=2 biological replicas).
*P < 0.05; **P < 0.01. Two-tailed paired (b-d,f) or unpaired (e) Student’s t-test. Data are mean ± s.d. Scale bars, 50 μm.
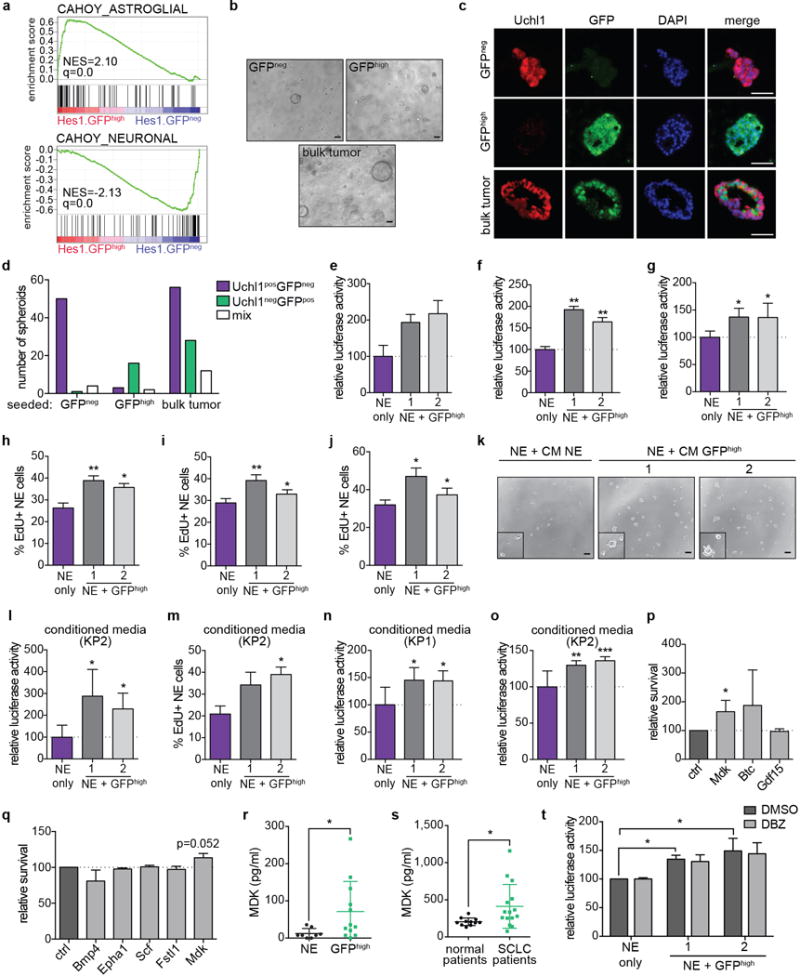
Gene expression profiles suggested that non-NE Hes1pos SCLC cells might be involved in extracellular matrix organization and regulation of cell adhesion (Extended Data Fig. 3g), reminiscent of tumor-stroma interactions in other cancers26. Furthermore, GFPhigh and GFPneg cells resemble astroglial cells and neurons, respectively (Extended Data Fig. 8a), and astroglial cells can provide trophic support for neurons27. Therefore, non-NE tumor cells might act as a tumor-derived microenvironment and contribute to SCLC development through non-cell autonomous effects on NE tumor cells. In a 3-D culture, bulk TKO Hes1GFP/+ tumor cells grew better than GFPhigh or GFPneg cells alone (Fig. 4a and Extended Data Fig. 8b-d). Co-culture with non-NE GFPhigh cell lines or with conditioned medium from GFPhigh cells promoted the growth of NE SCLC cell lines (Fig. 4b-e and Extended Data Fig. 8e-o). Of seven candidate secreted factors selected based on fold expression changes from the microarray data (Supplementary Table 1) and biological features (e.g., known role in neural/NE growth), only one showed a significant growth-promoting effect (Extended Data Fig. 8p, q), suggesting that factors not tested are implicated and/or that multiple factors act in concert to stimulate NE SCLC cell growth. Interestingly, however, the factor that promoted the growth of NE SCLC cells was midkine, which is secreted by glial cells to promote neuronal growth28. We detected midkine in the supernatant of GFPhigh SCLC cells (Extended Data Fig. 8r) and in the serum of SCLC patients (Extended Data Fig. 8s), suggesting that human tumors also produce midkine. The growth advantages provided by GFPhigh cells were not affected by Notch inhibition in co-culture assays (Extended Data Fig. 8t), indicating that the tumor-promoting effects of non-NE tumor cells are due to the differentiation state triggered by Notch activity, and not to ongoing Notch signaling.
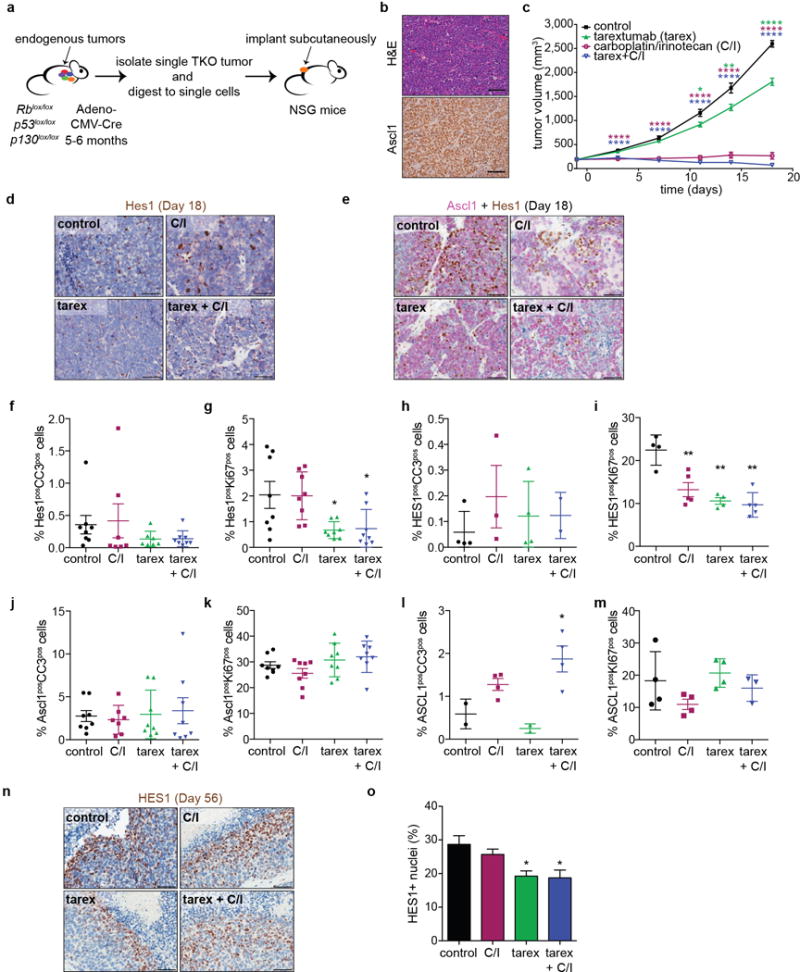
Figure 4. Notch-active SCLC cells promote the growth of neuroendocrine SCLC cells and a combination of chemotherapy and Notch blockade inhibits SCLC growth.
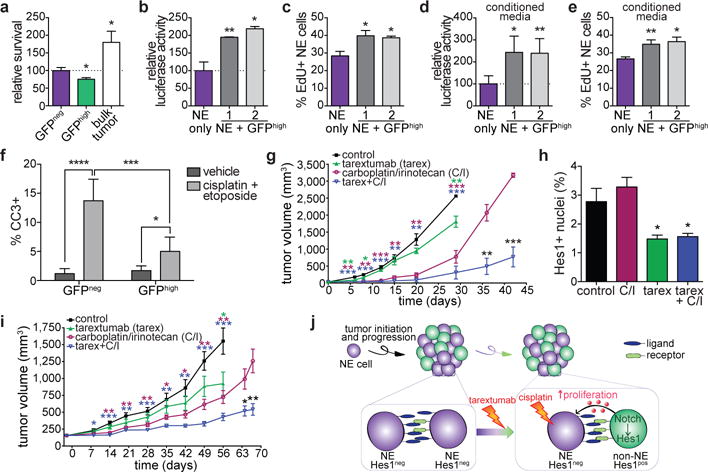
a, Cell viability assay of GFPneg, GFPhigh or a mixture of GFPneg and GFPhigh cells (bulk) in Matrigel (n=3 biological replicas).
b,c, Relative luciferase activity (b) and EdU incorporation (c) of luciferase-labeled KP1 cells in 2% serum with or without GFPhigh cells (n=3 biological replicas, with n=3 technical replicas each for (b)).
d,e, As in b,c, with conditioned media from KP1 or from GFPhigh cell lines (n=3 biological replicas, with n=3 technical replicas each for (d)).
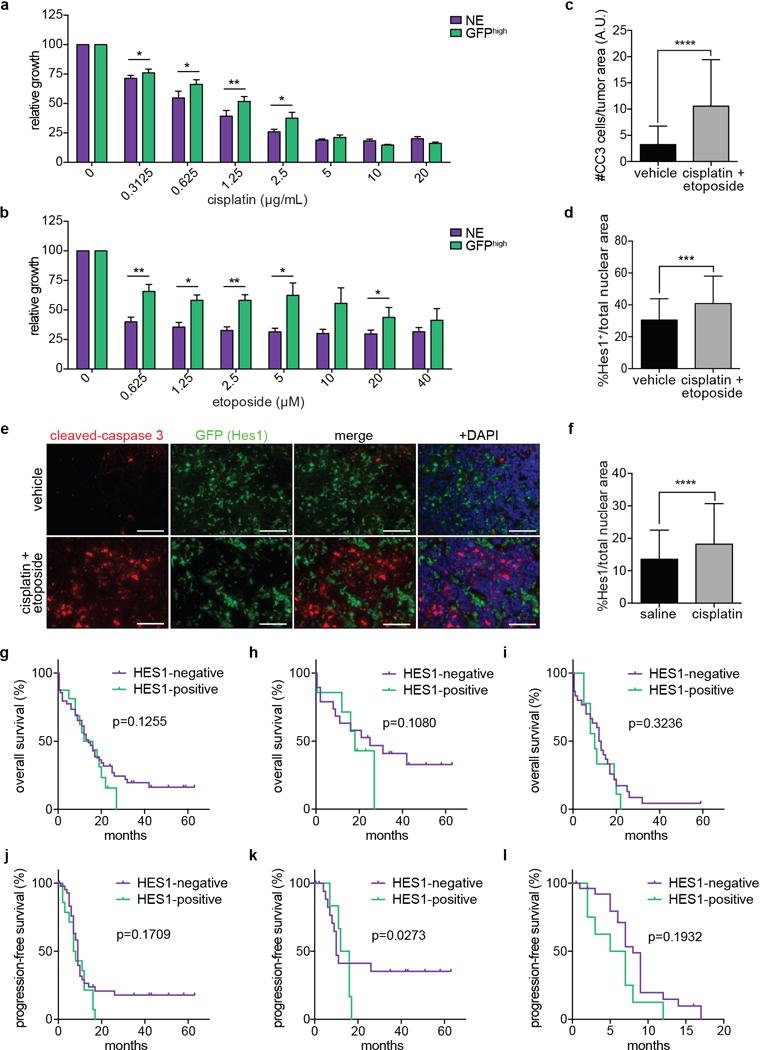
f, Quantification of %CC3pos cells in GFPneg or GFPhigh tumor cells in TKO Hes1GFP/+ mice treated acutely with cisplatin/etoposide (n=15 tumors per group, from 3 mice).
g, Tumor volumes of TKO SCLC allografts (n=5 tumors per group, one experiment).
h, Quantification of Hes1pos cells (n=8 tumors except tarex+C/I (n=6 tumors), one experiment) in TKO allografts after 18 days of treatment.
i, Tumor volumes of PDX model OMP-LU66 treated with control antibody (n=10 tumors), tarex (n=9), C/I (n=20), or tarex + C/I (n=24) (one experiment).
j, Model. In SCLC tumors, Notch signaling is activated in a subset of NE cells, leading to a loss of NE features. Non-NE SCLC cells promote the growth of NE cells. Combining chemotherapy and Notch inhibition can target both the fast cycling NE cells and the non-NE cells, respectively.
*P < 0.05; **P < 0.01; ***P < 0.001; ****P < 0.0001. For a-f, statistical significance determined by two-tailed paired (a-e) or unpaired (f) Student’s t-test; data are mean ± s.d. For g-i, statistical significance determined by two-tailed unpaired t-test against the control group when applicable or between the C/I and Tarex+C/I groups; data are mean ± SEM. Scale bars, 50 μm.
A major factor in the dismal survival rates for SCLC is rapid relapse following standard-of-care chemotherapy (often cisplatin or carboplatin with etoposide)7. GFPhigh tumor cell lines survived better than GFPneg tumor cell lines in response to cisplatin and etoposide (Extended Data Fig. 9a,b). Acute treatment of TKO mice with cisplatin and etoposide increased the number of cleaved caspase-3-positive (CC3pos) apoptotic tumor cells (Extended Data Fig. 9c), which correlated with an increase in the frequency of Hes1pos cells (Extended Data Fig. 9d); most of the CC3pos cells are (Hes1)GFPneg cells in these experiments (Fig. 4f and Extended Data Fig. 9e). The frequency of Hes1pos SCLC cells was also higher in mice treated with a longer-term chemotherapy protocol (Extended Data Fig. 9f), suggesting that these cells might play a role in chemo-response. In a cohort of SCLC patients, we found a trend for HES1 positivity in tumors as a negative prognostic factor for overall and progression-free survival (Extended Data Fig. 9g-l and Supplementary Table 5). In a SCLC allograft model (Extended Data Fig. 10a, b), a combination of the Notch2/3 antagonist tarextumab and carboplatin/irinotecan achieved greater tumor inhibition than tarextumab or carboplatin/irinotecan alone (Fig. 4g and Extended Data 10c), despite relatively low number of Hes1pos cells in this specific model (Fig. 4h and Extended Data Fig. 10d, e). We observed similar effects in a patient-derived xenograft (PDX) model, OMP-LU66 (Fig. 4i). Importantly, tarextumab treatment delayed the acquisition of chemoresistance and relapse during chemotherapy in these models (Fig. 4g, i). These effects were generally accompanied by decreased proliferation in non-NE Hes1pos cells and increased apoptosis in NE Ascl1pos cells (Extended Data Fig. 10f-m), as well as a reduction in Hes1pos cells (Fig. 4h and Extended Data Fig. 10 d-e, n-o). Thus, tarextumab treatment can block the generation of non-NE Hes1pos cells and limit their proliferation during tumor development. In combination with chemotherapy, tarextumab treatment can also affect the survival and possibly the proliferation of NE tumor cells.
SCLC tumors, which have few infiltrating stromal cells8, can make their own diverse microenvironment17,29. Here we show that activation of Notch signaling during SCLC progression generates an unexpected level of intratumoral heterogeneity. The amount (duration and strength) of Notch signaling required for the NE to non-NE fate switch is unknown, but a threshold is likely required based on analysis of GFPint cells. Furthermore, although Notch1 is also expressed and active in SCLC, blockade of just Notch2/3 was sufficient to suppress tumor growth and the generation of non-NE cells. Notch activation is likely to be regulated at multiple levels in SCLC. First, our ex vivo data indicate that ligands expressed on neighboring NE SCLC cells are sufficient to maintain Notch signaling in non-NE cells, but may not be sufficient for the generation of new non-NE cells. In primary tumors, Notch activation could be enhanced by signals from the lung microenvironment, as liver metastases (Extended Data Fig. 1a) and subcutaneous allografts grown from Hes1neg/GFPneg cells (Extended Data Fig. 4d) harbor fewer Hes1pos/GFPpos cells compared to primary tumors. The initial generation of non-NE SCLC cells may also promote the generation of more Notch-activated cells via unknown mechanisms. Second, although most of the loss-of-function NOTCH mutations in human SCLC tumors are heterozygous8, they might be sufficient to lower signaling from Notch receptors in NE SCLC cells and impair the NE to non-NE switch in response to ligands.
Notch signaling can be both tumor suppressive (intrinsically to NE cells) and pro-tumorigenic (through the generation of non-NE cells that are more chemoresistant and can promote NE cell growth) in SCLC. In phase 1b clinical trials (Identifier: NCT01859741), tarextumab treatment shows a trend towards an improvement in overall and progression-free survival in SCLC patients with elevated levels of several Notch target genes, including HES130. Our data provide a rationale for combining chemotherapy and Notch inhibition as a first line therapy for SCLC patients whose tumors harbor Notch-active tumor cells (Fig. 4j); expression of HES1 or other Notch targets in tumor biopsies, or even detection in the serum of patients of factors secreted by Notch-active SCLC cells (e.g. midkine), may serve as biomarkers for this personalized therapy. In contrast, relapsed late-stage tumors with fast-growing NE tumor cells might be inhibited by acute activation of the Notch pathway. The dual role of Notch signaling in SCLC illustrates the complex functions of developmental pathways in cancer and should guide the development of novel therapeutic approaches.
Methods
Ethics statement
Mice were maintained and animal experiments performed according to practices prescribed by the NIH at Stanford’s Research Animal Facility (protocol #13565) and by the Institutional Animal Care and Use Committee (IACUC) at OncoMed Pharmaceuticals. Additional accreditation of Stanford and OncoMed Pharmaceuticals animal research facilities was provided by the Association for Assessment and Accreditation of Laboratory Animal Care (AAALAC).
Mouse models and treatment studies
Animal experiments were performed unblinded except for allograft and PDX tumor growth measurements which were performed blinded. Immunostaining of sections from animal experiments were performed blinded.
Mouse SCLC model and adenoviral infections
The triple-knockout (TKO) SCLC mouse model bearing deletions in p53, Rb, and p130 has been described10. Mice were maintained on a mixed genetic background composed of C57BL/6, 129/SvJ and 129/SvOla. Endogenous Notch activity in TKO tumors was assessed through a GFP reporter expressed from the endogenous Hes1 promoter (Hes1GFP/+ allele11). We also bred in the Rosa26lox-stop-lox-tdTomato31 and Rosa26lox-stop-lox-luciferase32,33 Cre-reporter alleles to the TKO model to label tumor cells with tdTomato and luciferase respectively. SCLC tumors were induced in 7 to 10 weeks old mice (with no discrimination by sex of mice) by intratracheal instillation with 4×10⁷ PFU of Adeno-CMV-Cre (Baylor College of Medicine, Houston, TX) or Adeno-CGRP-Cre (University of Iowa). Tumors were collected for analysis after around 5–7 months for Ad-CMV-Cre or 7–8 months for Ad-CGRP-Cre, unless otherwise stated. In accordance with our animal protocol, mice were euthanized when they showed difficulty breathing, regardless of timepoint.
DBZ injections
TKO Hes1GFP/+ mice were treated with the γ-secretase inhibitor dibenzazepine (DBZ; Selleckchem, S2711) as previously described34. Mice were randomized and injected intraperitoneally once per day with 30 μmol/kg of DBZ (or DMSO control) for 5 days and tumors were collected on day 6 for flow cytometry or fixed for histological analyses.
Chemotherapy treatments in TKO mice
TKO or TKO Hes1GFP/+ mice bearing tumors were randomized for treatment. For acute responses, mice were treated with cisplatin (7.5 mg/kg, Teva) on day 1, and a combination of cisplatin and etoposide (15 mg/kg, Novaplus®) on days 2 and 4. Lungs were fixed for histological analyses a few hours after the last injection. For longer-term chemotherapy experiments, as we observed high toxicity with etoposide administration, TKO Rosa26LSL-luciferase mice were treated weekly for 3 weeks with saline or 5 mg/kg cisplatin only.
Subcutaneous tumor implantation
For subcutaneous tumor growth of GFPneg or GFPhigh cells, 2000 cells were FACS sorted and implanted subcutaneously on the lower left and right quadrants of 8–10 week-old immunocompromised Nod.Cg-PrkdcscidIL2rgtm1Wjl/SzJ (NSG) mice (no selection for sex of mice). Mice were euthanized and tumors were collected after approximately two months. The tumors did not exceed the 1.75cm diameter limit permitted by our animal protocol.
For the human PDX and TKO allograft tumor-growth models, NOD.CB17-Prkdcscid/NcrCrl (NOD/SCID, Charles River Laboratories) mice were maintained under pathogen-free conditions and provided with sterile food and water ad libitum. PDX models were established from patient biopsies provided by Molecular Response (San Diego, CA). OMP-LU66 was established at OncoMed Pharmaceuticals. For the subcutaneous xenograft studies, 100,000 OMP-LU66 cells in 100 μL (50% Matrigel (BD Biosciences)/50% Hank’s balanced salt solution supplemented with 2% heat-inactivated fetal bovine serum and 20mM Hepes (Life Technologies) were implanted into the left flank region of 7–8 week-old NOD/SCID mice (no selection for sex of mice) with a 25-gauge needle.
Phage display selection and screening for tarextumab20
Using a human Fab phage display library (HuCAL GOLD®, MorphoSys AG35), functional anti-Notch antibodies were discovered from selections against recombinant Notch2 extracellular domain (EGF1-12) containing the ligand binding site.
Tarextumab treatments
NOD/SCID mice implanted with OMP-LU66 or TKO allografts were randomized and treated with a control antibody or tarextumab (OMP-59R5, 40mg/kg, Q2W) as a single agent or in combination with the chemotherapy agents carboplatin (25 mg/kg, QW, Teva) and irinotecan (25 mg/kg, QW, Pfizer). We used carboplatin and irinotecan (instead of cisplatin and etoposide) for these longer term studies as they are less toxic, better tolerated by the mice, and have been shown to have similar efficacies as cisplatin and etoposide36,37. To avoid the side effects of total Notch pathway inhibition in vivo38,39, we sought to reduce Notch signaling with the Notch2/3 antagonist tarextumab. After approximately four cycles, chemotherapy was discontinued and tarextumab dosing was continued until study completion. Mice with tumor volumes at or exceeding the 2500mm3 limit permitted by the IACUC were sacrificed regardless of timepoint.
Preparation of single cell suspensions from SCLC tumors for flow cytometry
Tumors were dissected from the lungs of TKO Hes1GFP/+ mice approximately 5–7 months after tumor induction and digested as previously described40. The antibodies used were: CD45-PE-Cy7 (eBioscience, clone 30-F11, 1:100), CD31-PE-Cy7 (eBioscience, clone 390, 1:100), TER-119-PE-Cy7 (eBioscience, clone TER-119, 1:100), CD24-APC (eBioscience, clone M1/69, 1:200), Ncam1 (Cedarlane, clone H28-123-16, 1:100), anti-rat-IgG2a-PE (eBioscience, clone r2a-21B2, 1:200), EpCam (eBioscience, clone G8.8, 1:100), CD44-APC-Cy7 (BioLegend, clone IM7, 1:100). 1 μg/mL 7-aminoactinomycin D (Invitrogen) or DAPI was used to label dead cells.
Flow cytometry and sorting of SCLC tumor cells
FACS was performed using a 100μm nozzle on a BD FACSAria II using the FACSDiva software. The sequential gating strategy is outlined in Extended Data Fig. 1d. Fluorophore compensation was performed for each experiment using either unstained cells or BD™ CompBeads (BD Biosciences) stained with individual fluorophore-conjugated antibodies and compensation was calculated by FACSDiva. Data was analyzed using the FlowJo software and gates were set based on unstained samples.
EdU analysis in vivo
TKO Hes1GFP/+ mice were injected intraperitoneally with 100mg/kg EdU (5-ethynyl-2’-deoxyuridine; Life Technologies) 8 hours before euthanasia. GFPneg and GFPhigh tumor cells were sorted by FACS before being fixed and subject to EdU staining using the Click-iT® Plus EdU Pacific Blue™ flow cytometry assay kit (Life Technologies). Propidium iodide was used to stain for total DNA content and percent EdU incorporation of GFPneg and GFPhigh cells were analyzed using a BD FACSAria II.
Purification of soluble Dll4 ligand
The extracellular domain of rat Dll4 containing affinity-enhancing G28S, F107L, L206P N118I, I143F, H194Y and K215E mutations (named Dll4E12 or Dll4 in the manuscript) was cloned into the pAcGp67A vector and modified with a C-terminal 8×His tag19. Dll4E12 was expressed using baculovirus by infecting 1L of Hi-Five cells (Invitrogen) from Trichoplusia ni at a density of 2×10⁶ cells/mL and harvesting cultures after 72 hours. The cultures were centrifuged to remove the cells, and proteins were purified from supernatants by nickel and size-exclusion chromatography.
Plasmids
The MigR1-ires-GFP (Ctrl) and MigR1-N1ICD-ires-GFP retroviral vectors were gifts from Dr. W.S. Pear (University of Pennsylvania, Philadelphia). For doxycycline-inducible expression, we cloned N1ICD into the pLIX-403 vector (gift from Dr. David Root, Addgene 41395). For Rest overexpression, we cloned the Nrsf(Rest) fragment from pHR’-NRSF-CITE-GFP (gift from Dr. Jay Nadeau, Addgene 2131041) into the MigR1-ires-GFP or pLIX-403 vectors. Ascl1 (1: CTCCAACGACTTGAACTCTAT; 2: CCACGGTCTTTGCTTCTGTTT) and Rest (1: GTGTAATCTACAATACCATTT; 2: CCCAAGACAAAGACAAGTAAA) shRNAs were obtained from the MISSION shRNA library (Sigma-Aldrich). Guide RNA (sgRNA) against Rest (CATCATCTGCACGTACACGA) was designed using the sgRNA Designer (Broad Institute) and cloned into the lentiCRISPR v2 backbone (gift from Dr. Feng Zhang, Addgene 5296142).
Cell lines and cell culture assays
Except for 293T cells that were grown in DMEM, all cell lines were grown in RPMI-1640 media supplemented with 10% bovine growth serum (BGS) (Fisher Scientific) and penicillin-streptomycin-glutamine (Gibco). Murine KP1, KP2 and KP3 and human NJH29 SCLC cell lines were generated in the lab and have been described8,33,43. GFPneg and GFPhigh cell lines were isolated by FACS from individual mice. Human NCI-H82 and NCI-H889 cells were purchased from ATCC and authenticated by STR analysis. All cell lines tested negative for mycoplasma.
Transfections, viral infections and CRISPR knockout validation
Transfections and viral infections were performed as previously described40. For acute analysis of gene expression changes, RNA was isolated from GFPhigh cells FACS-sorted 48 hours after transfection with MigR1-N1ICD or Rest-IRES-GFP or the empty vector control. Viral transductions of N1ICD or Rest were used to generate adherent non-NE cells from NE cells, a process which takes about 1–2 weeks. The cells were then expanded and collected for immunoblot analyses. For isolation of Rest-knockout clones, sgRNA-infected cells were selected with puromycin (2 μg/ml) for 4 days and single cells were sorted into individual wells in 96-well plates by FACS. After two weeks, clones were picked and clones with biallelic frameshift mutations resulting in premature truncation of the translated protein were verified by TOPO® PCR cloning (Thermo Fisher Scientific) and Sanger sequencing.
Dll4 ligand assays
Tissue culture plates were coated overnight with 200 nM of purified Dll4 in PBS at 4°C, then washed twice with PBS to remove any unbound ligand before seeding of cells. GFPhigh cell lines were maintained on Dll4-coated dishes. To assay for acute responses to the lost of Notch activation, cells were kept on Dll4-coated plates or seeded on plates without Dll4 and collected 72 hours later for analyses. GFPneg cell lines were maintained on non-Dll4-coated dishes unless otherwise indicated.
To test for Notch ligands expressed by NE SCLC cells, mCherry-labeled NE (KP1 and KP3) cells were co-cultured with GFPhigh cell lines at a 3:1 ratio with 10 μM DBZ or DMSO control without exogenous Dll4. This ratio is based on the average number of GFPneg and GFPhigh cells in TKO Hes1GFP/+ tumors (27.7% GFPhigh cells = ~3:1 ratio). Median GFP fluorescence intensity of mCherry-negative, GFPhigh cells was quantified by flow cytometry after 72 hours.
For Dll4 stimulation of human cell lines (suspension), plates were coated overnight with 400 nM Dll4 in PBS at 4°C. Plates were washed twice with PBS, coated with 0.01% poly-D-lysine (Sigma Aldrich) for an hour at 37°C and then washed twice with PBS before seeding of cells.
For GFPneg ex vivo assays, DBZ was added at a concentration of 10 μM and tarextumab at 100 μg/ml. Cells were analyzed after two weeks by flow cytometry for the generation of GFPhigh cells.
Matrigel growth assay
50,000 GFPneg, GFPhigh or bulk tumor cells (mixture of GFPneg and GFPhigh) were sorted from TKO Hes1GFP/+ tumors, resuspended in 100 μL of modified DMEM/F12 media containing 50% Matrigel as previously described44 and then layered with 200 μL of media. Overall survival was assayed 1 week later by incubating with AlamarBlue® (Thermo Fisher Scientific) for 4 hours. Supernatant was removed and fluorescence of the Matrigel layer was read by a fluorescence plate reader (excitation 560 nm, emission 590 nm). For immunostaining, the Matrigel layer was fixed overnight with 10% formalin in PBS then washed twice with PBS before being embedded in histogel and subject to processing for paraffin embedding.
Co-culture and conditioned media assays
For co-culture cell growth assays, NE murine SCLC cells (KP1, KP2) were labeled with firefly luciferase and eGFP by lentiviral infection. These cells were then mixed with GFPhigh cells at a 3:1 ratio (12,000 NE cells + 4,000 GFPhigh cells) in 96-well white bottom plates. Luciferase activity was assayed 72 hours later by the Steady-Glo® luciferase assay system (Promega) according to the manufacturer’s protocol. For conditioned media assays, 0.5 × 10⁶ GFPhigh cells were seeded overnight in 6 cm dishes. The media was then changed and conditioned media was collected after 24 hours. 12,000 NE cells/well of a 96-well plate were resuspended in conditioned media and luciferase activity was assayed 72 hours later. Conditioned media from NE cells was used as the control, although in preliminary experiments we did not notice any difference in luciferase activity between NE conditioned media and regular media.
For co-culture EdU assays, unlabeled KP1 and KP2 were co-cultured with GFPhigh cells at a 3:1 ratio (150,000 NE cells + 50,000 GFPhigh cells) in 12-well plates for 72 hours and then incubated with 10 μM EdU (Life Technologies) for 3 hours. Both floating and adherent populations were collected and subject to EdU staining using the Click-iT® Plus EdU Pacific Blue™ flow cytometry assay kit (Life Technologies).
Cisplatin and etoposide treatments
20,000 NE or 4,000 GFPhigh cells were seeded per well of a 96-well plate in RPMI media with 2% BGS. 1 μL of drug solution was added per well the next day at the appropriate concentration and cell viability was assayed 48 hours later by the MTT assay (Roche).
Growth assay with recombinant proteins
20,000 NE cells were seeded per well of a 96-well plate in RPMI media with 2% BGS in the presence of the recombinant proteins. Cell viability was assayed after 72 hours by the AlamarBlue® assay. The following recombinant proteins were used: Midkine (OriGene TP723299, 50ng/ml), Betacellulin (BioLegend 551302, 5ng/ml), Gdf15 (MyBioSource MBS205834, 25ng/ml), Bmp4 (BioLegend 595301, 50ng/ml), Ephrin A1 (BioLegend 755002, 50ng/ml), SCF (BioLegend 579702, 50ng/ml), Fstl1 (R&D Systems 1738-FN-050, 200ng/ml).
Midkine ELISA assay
1.5×10⁶ NE cells or 0.5 ×10⁶ GFPhigh cells were seeded per well of a 12-well plate in RPMI media with 2% BGS. Supernatant was collected after 24 hours, centrifuged at 1,500 rpm for 10 minutes and assessed for the presence of midkine by an ELISA (LifeSpan Biosciences, Inc, LS-F5765) according to the manufacturer’s instructions. Data was analyzed using elisaanalysis.com.
Immunostaining
Tissues were fixed overnight with 10% formalin in PBS prior to processing for paraffin embedding. For immunohistochemistry (IHC), paraffin sections were stained as previously described8. Briefly, a citrate-based solution (Vector Laboratories) was used for antigen retrieval. DAB (Vector Laboratories) and hematoxylin were used for staining development and counterstaining, respectively. The primary antibodies used were: Hes1 (CST 11988, 1:200), Notch2 (CST 5732, 1:200), GFP (Invitrogen A-11122, 1:400), cleaved caspase-3 (CST 9664, 1:200), Ki-67 (BD Biosciences 550609, 1:200), Ascl1/Mash1 (BD Biosciences, 556604, 1:200). For staining of allograft and xenograft models treated with tarextumab, tissue sections were stained on a Ventana Discovery Ultra instrument (Roche) using Ventana reagents. Sections were treated with Cell Conditioning 1 before addition of antibodies. Antibodies were detected with UltraMap HRP kit and ChromoMAP DAB, then counterstained with hematoxylin. Antibodies used were the same as listed above except Ascl1 (eBioscience 1405794) and Ki67 (Abcam ab16667).
For immunofluorescence, paraffin sections were deparaffinized, rehydrated and unmasked by boiling in Trilogy™ (Cell Marque #920P-10) for 15 minutes, then blocked and stained with primary antibodies overnight, or subject to EdU staining (Life Technologies) prior to blocking and antibody staining. Nuclei were stained with DAPI (Sigma). The following primary antibodies were used: GFP (Rockland 600-101-215, 1:500), Uchl1 (Sigma HPA005993, 1:500), CGRP (Sigma C8198, 1:2000), synaptophysin (Syp, Neuromics MO20000, 1:100), RFP/Tomato (Rockland 600-401-379, 1:500), phospho-histone H3 (EMD Millipore 06-570, 1:500), cleaved caspase-3 (CST 9664, 1:100).
Quantification of immunostaining
Quantification of all immunostaining was performed blinded. Hes1pos cells in TKO lung or liver sections or in human tissue microarrays were scored based on the frequency and intensity of Hes1 staining and assigned scores of 0 (no staining), 1 (staining in 1–20% of cells), 2 (staining in 20–60% of cells or strong intense staining in <20% of cells) or 3 (>60% staining). Human SCLC tissue microarrays were purchased from US Biomax (LC245, LC802a, LC818), containing a total of 172 cores from 139 patients. H-scores were calculated as the summation of (1+i)pi where i is the intensity score and pi is the percent of the cells with that intensity.
Frequency of Hes1pos cells in TKO sections after chemotherapy was quantified from IHC staining using the ImageJ plugin, ImmunoRatio45. Percent of CC3pos cells in GFPneg or GFPhigh cells after acute chemotherapy of TKO Hes1GFP/+ mice was quantified from immunofluorescence images by ImageJ. For studies with human PDX and allograft tumor models performed at OncoMed Pharmaceuticals, slides were scanned using an Aperio AT scanner, then analyzed using Definiens Tissue Studio image analysis software. Positively stained cells within tumors were identified and quantitated for staining intensity and frequency. For quantification in Extended Data Fig. 10f-m, some samples were excluded because the paraffin blocks did not have any tissue samples left to be cut (since the tumors were harvested at or close to minimum residual disease, the amount of tissue obtained was small). This exclusion due to unforeseen experimental limitations was not pre-established.
Patient survival data
The study was approved by the institutional review board of the East Paris University Hospitals Tumor Bio-bank, AP-HP, Tenon Hospital, Paris, France (AP-HP – GH-HUEP Tumorothèque biobank platform). 73 patients diagnosed with small cell lung cancer at Hôpital TENON, Assistance Publique-Hôpitaux de Paris, France, from January 2010 to January 2013 were first identified. Tumor samples were obtained after getting written informed consent. We performed HES1 IHC for 68 of the patients from whom formaldehyde-fixed and paraffin-embedded tumor tissue was available. The tumor samples were first reviewed by at least two independent expert pathologists and the diagnosis of SCLC was histomorphologically confirmed by H&E staining and IHC for chromogranin A, synaptophysin, NCAM and TTF1. Clinical and biological characteristics of the patients are provided in Supplementary Methods. For survival analysis, the patients were separated into two groups based on the absence (Hes1-negative) or presence (Hes1-positive) of HES1 immunostaining in their tumors.
Luminex assay for midkine protein in human plasma
Human plasma samples from cancer-free normal donors were purchased from BioreclamationIVT. SCLC donor plasma was sourced from Conversant Biologics (Conversant Bio). The samples were collected, processed and distributed in accordance with IRB approval following informed patient consent. Plasma samples were assayed by following the Luminex assay protocol with adaption of the Drop Array system (Curiox Biosystems, Luminex, Austin, TX). Briefly, wells in the DropArray assay plate were blocked with 10 μL 1% BSA/PBS for 30 minutes at room temperature. Standards were prepared according to manufacturer’s instructions. 5 μL bead mix was added to all wells. 5 μL standards or diluted samples were then added to the plate, all standard and human plasma samples were tested in duplicate wells. The plate was shaken for 10 seconds at 1,000 RPM then placed on a magnetic stand in a humidified chamber and shaken overnight at 4°C. The plate was washed 3 times with the DropArray LT washing station MX96 (Curiox Biosystems). The detection antibody was added at 5μL/well and the plate was incubated for 60 minutes. Five μL/well of the streptavidin-PE substrate was added to each well and incubated for 30 minutes with shaking. The plate was washed 3 times prior to reading by Luminex 200 instrument. Data was analyzed using the EMD Millipore’s Milliplex Analyst software. The standard curve readings were back calculated and evaluated for accuracy (80–120%) and precision (%CV of duplicates <30%).
Immunoblot analysis
Cells were lysed in a modified RIPA buffer (1% NP40, 0.3% SDS, 50mM Tris-HCl pH 8.0, 150mM NaCl, 2mM EDTA, 1% sodium deoxycholate, 30mM NaF, 20mM Na4P2O7, 1mM NaVO3, 1mM DTT, 60mM β-glycerophosphate) supplemented with protease inhibitors aprotinin (10 μg/mL), leupeptin (10 μg/mL) and PMSF (1mM). Protein concentration was measured with the Pierce™ BCA protein assay kit (Thermo Scientific). The antibodies used were Notch1 (Cell Signaling Technology (CST) 4380), cleaved Notch1 (CST 4147), Notch2 (CST 5732), Hes1 (CST 11988), GFP (Invitrogen A-11122), Rest (Abcam 21635), alpha-tubulin (Sigma T9026) and HSP90 (CST 4877).
DNA and RNA extraction and gene expression analyses
For analysis of primary tumor cells, cells were sorted from pooled tumors from individual TKO Hes1GFP/+ mice by FACS. DNA and RNA were isolated using the Qiagen Allprep DNA/RNA micro kit or the RNeasy mini kit according to the manufacturer’s protocol. Quantitative real-time PCR (qRT-PCR) analysis was performed on the Applied Biosystems™ 7900HT Fast Real-Time PCR System using the PerfeCTa® SYBR® Green FastMix® (Quanta BioSciences 95073). Genes that had Ct values that were high (>34) or undetermined (e.g. Notch4) were removed from the graphical analyses. Data was normalized to Rplp0 as a housekeeping gene, unless otherwise stated. Primer sequences are available in Supplementary Methods.
Microarray analysis
RNA from cells isolated by FACS from 3 TKO Hes1GFP/+ mice (independent of the samples used for qRT-PCR) was subjected to quality assessment and microarray analysis by the Stanford Protein and Nucleic Acid (PAN) facility as previously described8. The microarray was performed using the GeneChip® Mouse Gene 2.0 ST Array (Affymetrix) and the Robust Multichip Average (RMA) Express 1.1.0 program was used for background adjustment and quantile RMA normalization of the 41,345 probe sets encoding mouse genome transcripts. Linear Models for Microarray data (LIMMA) was used to compare GFPneg and GFPhigh cells on RMA normalized signal intensities. The command prcomp in R was used for principal component analysis. Probe IDs were annotated with gene symbols from mouse gene 2.0 ST transcript cluster database (mogene20sttranscriptcluster.db). Of the 41,345 probe sets, 25,349 were annotated to genes, which were then used for gene set enrichment analysis, GSEA46,47. Default parameters were used except that we performed gene set permutation instead of phenotype permutation because there were less than 7 samples per phenotype. Probes with an adjusted p-value of 0.05 or less were considered as significantly differentially expressed. 7096 probes annotated to 5437 genes (5289 unique) were significant and a heatmap for these genes was generated using the heatmap.2 function in R.
Significanty differentially expressed genes were also analyzed by Enrichr48,49. To identify candidate transcription factors that might mediate the NE to non-NE switch, we used genes significantly downregulated in GFPhigh cells to search for enriched ENCODE and ChEA consensus transcription factors from the ChIP-X database. To identify a list of secreted factors, we first looked at genes that were classified in the ‘extracellular space’ gene signature and, by literature search, picked out the genes that are known to be secreted. We also input all significant genes into the ontology search tool in the BIOBASE Knowledge Library50,51 and the output ontologies and gene descriptions were manually screened for secreted factors. We do not exclude that we might have missed some secreted factors that are not yet well curated in public databases. Candidates for testing in a NE cell growth assay were selected based on expression fold changes and known biology.
Single cell Fluidigm qRT-PCR
Single cells were sorted into individual wells in a 96-well PCR plate containing 5 μL of 2× reaction mix (CellsDirect™ One-Step qRT-PCR kit, Invitrogen) with 2 units of SUPERase In RNase Inhibitor (Thermo Fisher Scientific). Primers were designed and purchased from Fluidigm through the D3 assay design system. Primers were pooled and reverse transcription and pre-amplification was performed at a final concentration of 50 nM for each primer pair using the following PCR protocol: 15min 50°C, 2min 95°C, 20 cycles of 15sec 95°C and 4min 60°C, 15min 4°C. The cDNA products were treated with Exonuclease I (New England Biolabs) to remove unincorporated primers and then diluted 5-fold for the final reaction. 2.25 μL cDNA, 2.5 μL 2× SsoFast EvaGreen Supermix with low ROX (Bio-Rad 172-5211) and 0.25 μL 20× DNA Binding Dye sample loading reagent (Fluidigm 100-3738) was mixed and loaded into a 48.48 or 96.96 Dynamic Array™ integrated fluidic circuit (IFC) chip. 0.25 μL of each 100 μM primer pair was mixed with 2.5 μL 2× Assay Loading reagent (Fluidigm 85000736) and 2.25 μL TE with low EDTA (Affymetrix 75793) and loaded into the IFC. The chip was run on a Biomark™ machine according to the manufacturer’s protocol for EvaGreen probes. As established before the experiment, cells with high or undetectable CT values (i.e. low expression) for the housekeeping genes (Gapdh, Hsp90ab1, Actb) were excluded from the heatmaps.
Genotyping
1 ng of DNA was used for each multiplex PCR reaction for detection of the unrecombined (floxed) and recombined (delta, Δ) Rb, p53 and p130 alleles. A Rb/p53/p130 (TKO) knockout cell line was a positive control for recombined alleles; DNA isolated from a mouse tail was a negative control. The reverse is true for the unrecombined alleles. Primer sequences are provided in Supplementary Methods.
Chromatin immunoprecipitation (ChIP)
Cells were fixed and ChIP was performed as previously described52. Briefly, doxycycline-inducible cells were fixed after 48 hours of doxycycline treatment. For N1ICD ChIP, KP1-pLIX-N1ICD cells were induced with 0.125 μg/ml of doxycycline and fixed with 2 mM disuccinimidyl glutarate (Thermo Scientific) in PBS for 30 min before formaldehyde fixation. For Rest ChIP, KP1-pLIX-Rest cells were induced with 0.5 μg/ml of doxycycline. The antibodies used were Notch1 (CST 3608), rabbit IgG (CST 2729) and Rest (Millipore 17-641). Primer sequences are provided in Supplementary Methods.
Image analysis and statistics
Sample sizes were chosen based on our experience with similar experiments (a minimum of 3-5 mice for animal studies, or 2-4 biological replicas for in vitro / ex vivo assays usually ensures statistical significance if the phenotypes are robust). Statistical significance was assayed by Student’s t-test with the GraphPad Prism (two-tailed unpaired or paired t-test depending on the experiment). *: P<0.05; **: P<0.01; ***: P<0.001; ****: P<0.0001; ns: not significant. Variance was examined by an F-test. Data are represented as mean+/−SD unless otherwise stated. For analysis of patient survival data, we used a weighted log-rank test in the OASIS web-based tool53 with greater emphasis on late time point differences (rho: 0, gamma: 1).
Data Availability
Microarray data is available at the NCBI Gene Expression Omnibus (GEO), accession number GSE81170. Normalized values for significantly differentially expressed genes are provided in Supplementary Table 1; GSEA analyses are in Supplementary Tables 2-4. HES1 immunostaining and survival data of SCLC patients are provided in Supplementary Table 5. For immunoblot source data, see Supplementary Fig. 1. Source data is provided for Figures 1b, 1d, 2a, 4g-i and Extended Data Figures 4c, 5j, 6c, 8s, 9c-d, 9f, 10c, 10f-m, 10o.
Extended Data
Extended Data Figure 1. SCLC tumors harbor a population of Hes1-positive tumor cells.
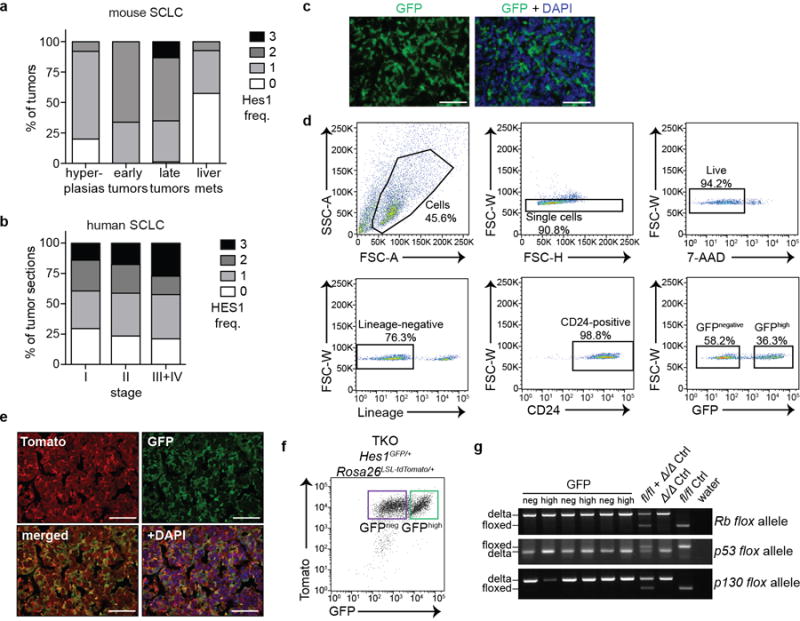
a, Quantification of the frequency (Freq.) of Hes1pos cells in TKO tumors at different stages of tumor development. Scores: 0 (0%), 1 (1-20%), 2 (20-60%), 3 (>60%). Hyperplasias (n=26, from 5 mice, defined by area < 16,600 μm2) and early tumors (n=69, from 5 mice) were analyzed 3 months after Ad-CMV-Cre); late tumors (n=83, from 5 mice) and liver metastases (n=54, from 5 mice) were analyzed 6-7 months after Ad-CMV-Cre (data for the late tumors are shown for comparison and are the same as in Fig. 1b).
b, As in a, for human SCLC tumor microarray sections and segregated by clinical stage. H-scores: stage I (123.9; n=71 sections), stage II (135.3; n=68 sections), stages III+IV (148.5; n=33 sections).
c, Representative immunofluorescence (IF) for GFP in TKO Hes1GFP/+ SCLC tumors.
d, Representative flow cytometry plots of cells isolated from pooled tumors from a TKO Hes1GFP/+ mouse. Arrows depict the sequential gating strategy for enriching for single, live (by exclusion of 7-aminoactinomycin D (7-AAD)) and lineage (CD45, CD31, TER-119)-negative cells. CD24 labels >98% of Cre-recombined cells and thus further enriches for tumor cells40.
e, IF of a TKO Rosa26lox-stop-lox-tdTomato;Hes1GFP/+ tumor section showing co-localization of GFP and Tomato signals.
f, Flow cytometry shows that GFPhigh cells in pooled tumors from a TKO Rosa26lox-stop-lox-tdTomato;Hes1GFP/+ mouse infected with Ad-CMV-Cre are positive for Tomato expression (representative of n=2 mice).
g, Genotyping PCR analysis for recombination (Δ) or the unrecombined (floxed) alleles at the Rb, p53 and p130 loci in GFPneg and GFPhigh tumor cells sorted from 3 TKO Hes1GFP/+ mice. DNA from fl/fl and/or Δ/Δ cells serve as controls.
Scale bars, 50 μm.
Extended Data Figure 2. Hes1-positive SCLC cells are Notch-pathway-active, epithelial, and do not express neuroendocrine markers.
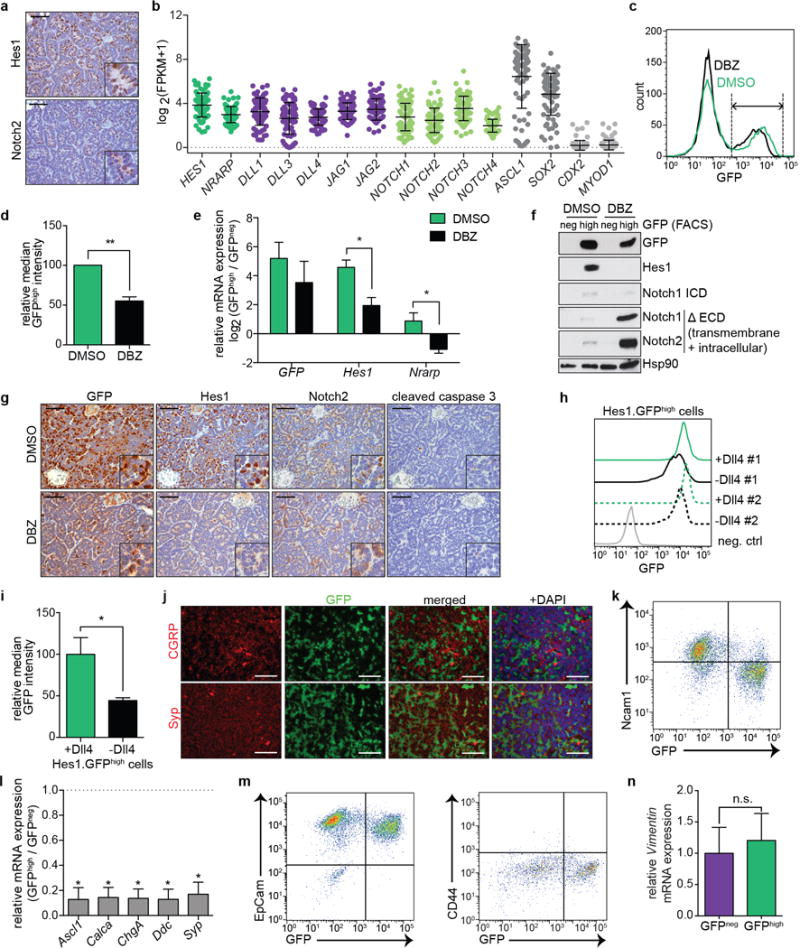
a, Representative IHC for Hes1 and Notch2 in serial TKO tumor sections.
b, RNA-sequencing data of human SCLC tumors (from8), with positive (ASCL1 and SOX2) and negative (CDX2, MYOD1) controls for expression in SCLC (n=81 tumors).
c-g, TKO Hes1GFP/+ mice were treated with DMSO control (n=5 mice) or DBZ (n=4 mice). c, Representative flow cytometry of GFP in pooled tumors from one mouse per condition. Dotted lines delineate the GFPhigh population. d, Quantification of relative median GFP intensity of GFPhigh cells. e, qRT-PCR of sorted GFPneg and GFPhigh cells. f, Immunoblot analysis of sorted GFPneg and GFPhigh cells. At these exposure levels, GFP is detected but not Hes1 in DBZ-treated GFPhigh cells, possibly due to different half lives of the proteins (>24 hours for GFP54 compared to <1 hour for Hes155,56). For Notch, an antibody that detects Notch1 cleaved specifically before V1744 (Notch1 ICD) or antibodies that detect the transmembrane+intracellular (excluding the extracellular region, ΔECD) regions of Notch1 or Notch2 were used. g, Representative IHC in treated tumors.
h, Flow cytometry of two GFPhigh cell lines (n=2 biological replicas) grown on dishes coated with Dll4 or 72 hours after removal from Dll4. Negative control: GFPneg cell line.
i, Quantification of relative median GFP intensity from (h) (n=2 biological replicas).
j, Immunofluorescence for GFP and NE markers (CGRP and Syp) in TKO Hes1GFP/+ tumors.
k, Flow cytometry of the NE marker Ncam1 and GFP in a TKO Hes1GFP/+ tumor (representative of n=3 biological replicas). The quadrants delineate the negative gates for the GFP and Ncam1 signals and show that GFPhigh cells are mostly negative for Ncam1 expression.
l, qRT-PCR analysis of NE genes in GFPhigh cells relative to GFPneg cells (sorted from pooled tumors from n=3 mice, with n=3 technical replicas each).
m, Flow cytometry analysis of the epithelial marker EpCAM and GFP (left) or CD44 and GFP (right) in a TKO Hes1GFP/+ tumor (representative of n=3 biological replicas).
n, qRT-PCR of Vimentin in GFPneg and GFPhigh cells (n=4 mice).
*P < 0.05; **P < 0.01. Statistical significance was determined by two-tailed unpaired (d,e) or paired (i,l,n) Student’s t-test. Data are represented as mean ± s.d. Scale bars, 50 μm.
Extended Data Figure 3. Notch-active SCLC cells have switched to a non-neuroendocrine fate.
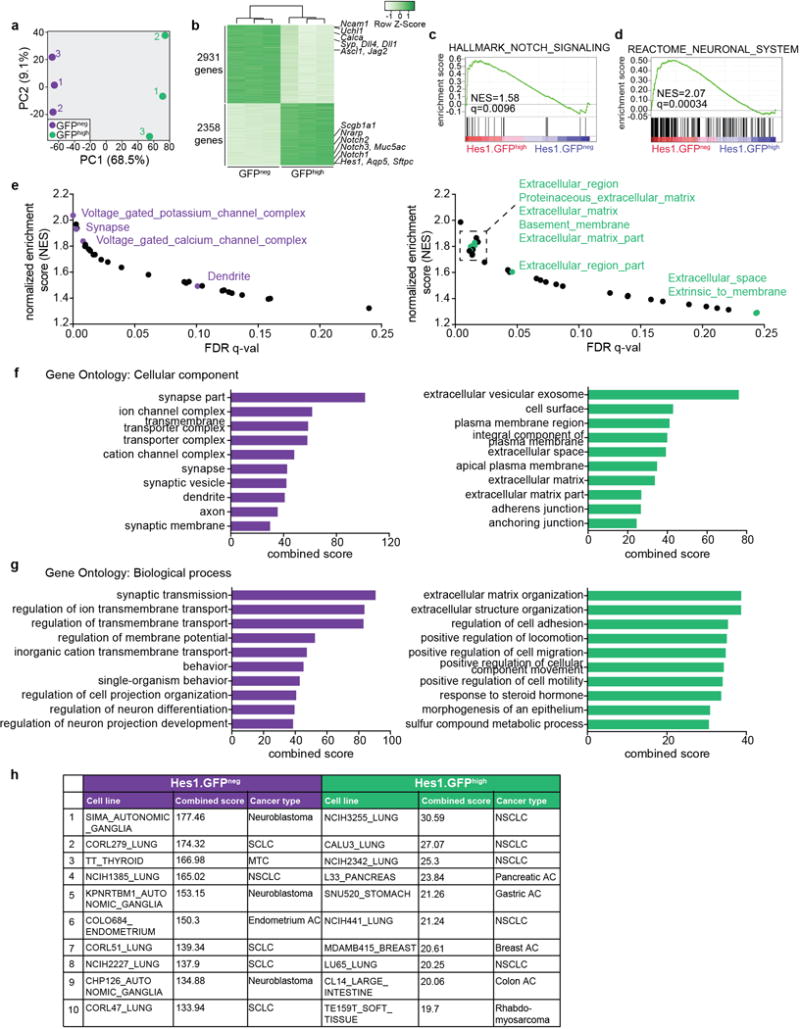
a, Principal component analysis of normalized microarray gene expression values of GFPneg and GFPhigh tumor cells sorted from 3 TKO Hes1GFP/+ mice. The first two principal components accounting for 77.6% of the total variance are shown.
b, Heatmap for differentially expressed genes in GFPneg and GFPhigh tumor cells by microarray.
c, Gene set enrichment analysis (GSEA) for a Notch pathway signature enriched in GFPhigh cells.
d, GSEA for a neuronal gene set (from the MSigDB C2 curated gene sets collection) enriched in GFPneg cells.
e, GSEA of differentially expressed genes in GFPneg and GFPhigh cells. Gene sets enriched at FDR q-value <0.25 in the MSigDB C5 cellular component ontology are plotted as a function of normalized enrichment score (NES) against the q-value. Left: Gene sets enriched in GFPneg cells; gene sets related to neuronal signatures are highlighted in purple. Right: Gene sets enriched in GFPhigh cells; gene sets related to the extracellular region are highlighted in green.
f,g, Enrichr analysis for cellular component (f) or biological process (g) gene ontology (GO) terms significantly enriched in GFPneg or GFPhigh cells. The top ten GO terms ranked by combined score are shown.
h, Enrichr analysis for cell lines in the Cancer Cell Line Encyclopedia (CCLE) that closely resemble GFPneg or GFPhigh cells. The top ten GO terms ranked by combined score are shown. MTC: medullary thyroid carcinoma, a NE tumor of the thyroid; AC: adenocarcinoma.
Extended Data Figure 4. Non-neuroendocrine, Notch-active cells in SCLC tumors are slower-growing than the neuroendocrine cells.
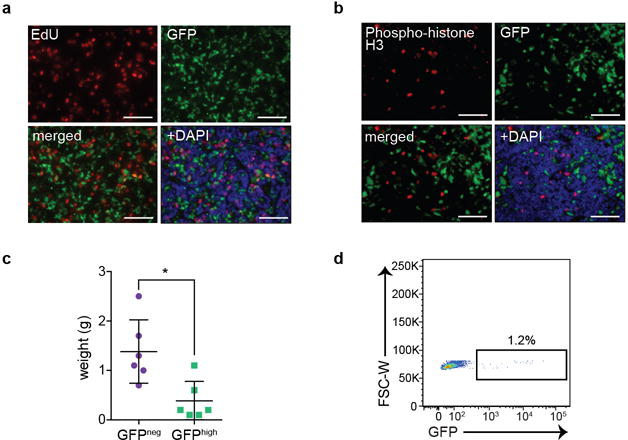
a,b, Co-immunofluorescence for GFP and EdU (a) or phospho-histone H3 (b) in TKO Hes1GFP/+ tumors.
c, Weight of tumors formed from freshly sorted GFPneg and GFPhigh tumor cells implanted subcutaneously in immunocompromised NSG mice (n=6 tumors each; two-tailed unpaired Student’s t-test).
d, Flow cytometry of GFP in a tumor formed from freshly sorted GFPneg cells implanted subcutaneously in immunocompromised NSG mice (representative of n=6 biological replicas).
*P < 0.05. Data are represented as mean ± s.d. Scale bars, 50 μm.
Extended Data Figure 5. Non-neuroendocrine, Notch-active cells in SCLC tumors are generated from neuroendocrine tumor cells.
a, Representative IHC for Hes1 and cleaved caspase-3 (CC3) in serial TKO tumor sections. Inset: higher magnification of a positive control for CC3 (tumor from a mouse treated with chemotherapy).
b, Predicted numbers and ratio of GFPneg and GFPhigh tumor cells if the two populations divide independently of each other, and GFPneg cells cycle approximately 3 times faster than GFPhigh cells.
c, Representative IHC in serial sections from TKO Hes1GFP/+ tumors initiated by Adeno-CGRP-Cre.
d, Quantification of the frequency (Freq.) of Hes1pos cells in TKO hyperplasias (n=23, from 5 mice) and tumors (n=50, from 7 mice) induced by Adeno-CGRP-Cre. Scores: 0 (0%), 1 (1-20%), 2 (20-60%) 3 (>60%).
e, Flow cytometry of %GFPhigh cells in pooled tumors from TKO Hes1GFP/+ mice (n=4) infected with Ad-CGRP-Cre.
f, Images of freshly isolated GFPneg cells grown on dishes coated with Dll4 or PBS control (representative of n=3 biological replicas).
g,h, Freshly isolated GFPneg cells that remained GFPneg after culture on Dll4-coated dishes were replated on dishes coated with Dll4 ligand (+Dll4) or PBS control (-Dll4). g, Flow cytometry and images (representative of n=2 biological replicas). h, GFPneg and GFPhigh cells that formed after this second round of Dll4 stimulation were sorted and analyzed by immunoblot. Control: GFPhigh cell line.
i, Relative number of GFPhigh cells formed from freshly isolated GFPneg cells grown on Dll4 after two weeks of tarextumab treatment (n=3 biological replicas each).
j, Single cell qRT-PCR (n=45 each) of H29, H82 and H889 human SCLC cell lines. Heatmap was generated by unsupervised clustering of each cell line. Dark blue regions indicate undetectable expression.
k, qRT-PCR for HES1 after 72 hours of culture with or without Dll4. Data is normalized to GAPDH (n=3 biological replicas with n=3 technical replicas each).
l,m, GFPhigh cell lines were treated with DMSO or DBZ while grown with or without Dll4 or co-cultured with 3 individual NE cell lines in the absence of Dll4. GFP expression was analyzed by flow cytometry after 72 hours. l, Flow cytometry of GFPhigh cell line #1 (representative of n=3 biological replicas; GFP intensity quantified in Fig. 2e). m, Quantification of GFP intensity in GFPhigh cell line #2; relative median GFP intensity normalized to the DMSO -Dll4 condition (n=3 biological replicas).
n,o, Representative images (n) and qRT-PCR (o) of GFPhigh cell lines cultured in the presence of absence of Dll4 for more than a month (n=3 biological replicas with n=3 technical replicas).
p, Freshly isolated GFPneg cells that became GFPhigh after culture on Dll4 were replated on dishes coated with Dll4 ligand or PBS control and analyzed by immunoblot after a month. GFPneg cell lysate: positive control for Ascl1.
*P < 0.05; **P < 0.01. Statistical significance was determined by two-tailed paired Student’s t-test. Data are represented as mean ± s.d. Scale bars, 50 μm.
Extended Data Figure 6. Analysis of SCLC cells with intermediate levels of activation of the Notch pathway.
a, Flow cytometry showing gates used to sort for tumor cells with negative (neg), intermediate (int), and high levels of GFP from a TKO Hes1GFP/+ mouse (representative of n=4 biological replicas).
b, qRT-PCR for Notch pathway genes and NE genes in sorted cells (n=4 biological replicas with n=3 technical replicas each).
c-e, Single cell qRT-PCR of GFPneg, GFPint and GFPhigh cells sorted from one TKO Hes1GFP/+ tumor (n=32 cells sorted per group; 20 cells with low expression of housekeeping genes were excluded from the heatmaps). (c) Unsupervised clustering segregates the cells into two main groups. (d) Supervised clustering and (e) analysis of Hes1 mRNA (normalized to Gapdh) shows that the number of GFPint cells with detectable Hes1 levels is intermediate between GFPneg and GFPhigh cells.
f, Representative images of freshly isolated cells in culture (without Dll4). Scale bars, 50 μm.
*P < 0.05; **P < 0.01; ***P < 0.001; ****P < 0.0001. Statistical significance was determined by two-tailed paired Student’s t-test. Data are represented as mean ± s.d.
Extended Data Figure 7. Upregulation of Rest is required for the NE to non-NE transition.
a,b, Images (a) and immunoblot analysis (b) of a murine NE SCLC cell line (KP1) ~1 month after N1ICD transduction (representative of n=2 biological replicas).
c, Immunoblot of KP1 cells transduced with Ascl1 shRNAs or a shGFP control. Note that the level of Ascl1 downregulation is similar to that achieved by N1ICD overexpression at a similar time point (not shown).
d, qRT-PCR of NE genes in KP1 cells transduced with Ascl1 shRNAs (n=3 biological replicas with n=3 technical replicas each).
e, Representative images of KP1 cells approximately one month after Ascl1 knockdown.
f, qRT-PCR for Rest in GFPneg (n=3) and GFPhigh (n=4) cell lines (n=3 technical replicas each).
g, qRT-PCR of freshly isolated GFPneg cells two weeks after culture in the absence or presence of Dll4 (n=2 biological replicas with n=3 technical replicas each).
h, Sanger sequencing verification of n=4 Rest-knockout (KO) KP1 clones, with the sequence of both alleles shown.
i, qRT-PCR for NE genes in Rest-WT (n=3) and Rest-KO (n=4) clones (n=3 technical replicas each).
j, Schematic for assay to assess the ability of N1ICD to induce adherent non-NE cells from NE SCLC cells. NE SCLC cells (KP1) were transduced with a N1ICD retrovirus or an empty vector control. 72 hours later, 1200 cells were seeded per well of a 96-well plate. The number of adherent cells per well was counted after two weeks.
k, KP1 cells stably integrated with Rest shRNAs or an shGFP control were transducted with a N1ICD retrovirus and the number of adherent cells counted after two weeks (see schematic in Extended Data Fig. 7j) (n=3 biological replicas with n=3 technical replicas each).
l, qRT-PCR for NE genes in KP1 cells 48 hours after Rest overexpression (n=3 biological replicas with n=3 technical replicas each).
*P < 0.05; **P < 0.01; ***P < 0.001; ****P < 0.0001. Statistical significance was determined by two-tailed paired (d,k,l) or unpaired (f) Student’s t-test. Data are represented as mean ± s.d. Scale bars, 50 μm.
Extended Data Figure 8. Notch-active SCLC cells promote the survival of neuroendocrine SCLC cells.
a, GSEA signatures enriched in GFPhigh (astroglial signature) and GFPneg (neuronal signature) tumor cells based on microarray data of tumors from n=3 mice.
b, Images of GFPneg, GFPhigh or bulk tumor cells (mixture of GFPneg and GFPhigh) 7 days after isolation from TKO Hes1GFP/+ mice and seeded at equal numbers in 50% Matrigel (representative of n=3 biological replicas).
c, Immunofluorescence for Uchl1 (NE marker) and GFP 10 days after the cells were sorted from TKO Hes1GFP/+ tumors and in 50% Matrigel. Note: Most of the spheroids in the bulk culture were composed of only one type of cell (Uchl1posGFPneg or Uchl1negGFPpos; the mixed spheroid shown here are the minority.
d, Quantification of the number of each type of spheroids in each culture condition from (c) (n=3 mice, 2 sections each for immunostaining).
e-g, Relative luciferase activity of a luciferase-labeled mouse SCLC NE cell line seeded alone or co-cultured with GFPhigh cell lines (n=2 (e) or n=3 (f,g) biological replicas with n=3 technical replicas each). e, 2% serum, KP2 NE cell line. f,g, 10% serum, KP1 (f) and KP2 (g) cell lines.
h-j, As in e-g, but the cells were fixed and collected for EdU analysis by flow cytometry (n=2 (h) or n=3 (i,j) biological replicas).
k, Representative images of KP1 cells seeded in conditioned media (CM) (2% serum) from KP1 cells or from GFPhigh cell lines.
l, Relative luciferase activity of luciferase-labeled KP2 cells 72 hours after seeding in CM (2% serum) from KP2 cells or from GFPhigh cell lines (n=3 biological replicas with n=3 technical replicas each).
m, As in l, but the cells were fixed and collected for EdU analysis by flow cytometry (n=3 biological replicas).
n,o, As in l, but with KP1 (n) or KP2 cells (o) in 10% serum (n=3 biological replicas with n=3 technical replicas each).
p,q, AlamarBlue cell viability assay for NE SCLC cell lines 72 hours after culture with the indicated recombinant proteins (n=3 biological replicas with n=3 technical replicas each).
r, ELISA assay for midkine in supernatant from NE (n=4) and GFPhigh (n=4) cell lines (n=2 biological replicas each).
s, Luminex assay for midkine in serum plasma from normal (control; n=11) and SCLC (n=15) patients.
t, Relative luciferase activity of luciferase-labeled mouse SCLC NE cell lines (n=4) 72 hours after seeding alone or co-cultured with GFPhigh cell lines and treated with 10 μM DBZ or DMSO control. Data are normalized to NE-monoculture with DMSO (n=3 biological replicas with n=3 technical replicas each).
*P < 0.05; **P < 0.01; ***P < 0.001. Statistical significance was determined by two-tailed paired Student’s t-test, except for (r,s: two-tailed unpaired Student’s t-test). Data are represented as mean ± s.d. Scale bars, 50 μm.
Extended Data Figure 9. Notch-active SCLC cells are more resistant to chemotherapy than neuroendocrine SCLC cells.
a,b, Average cell viability (MTT assay) of NE (n=4) and GFPhigh (n=3) cell lines 48 hours after cisplatin (a) or etoposide (b) treatment (n=3 biological replicas with n=3 technical replicas each).
c,d, Quantification of cells expressing cleaved caspase-3 (CC3) (c) and Hes1 (d) in tumors in TKO mice acutely treated with cisplatin and etoposide (CC3: n=49; Hes1: n=41 tumors) or a vehicle control (CC3: n=48; Hes1: n=67 tumors) (data from 2 groups of 3 mice previously described in Fig. 4a,b in40 but analyzed as number of CC3pos per tumor, not per mouse).
e, Representative immunofluorescence of tumors from TKO Hes1GFP/+ mice acutely treated with acutely treated with cisplatin and etoposide. Scale bars, 50 μm.
f, Quantification of Hes1pos cells in the tumors of TKO Rosa26lox-stop-lox-Luciferase mice after 3 weeks of weekly saline (n=190 tumors, from 7 mice) or cisplatin (n=217 tumors, from 8 mice) treatments.
g-i, Overall survival of all (g; n=65, 49 HES1neg, 16 HES1pos), stages I-III (h; n=26, 19 HES1neg, 7 HES1pos) or stage IV (i; n=39, 30 HES1neg, 9 HES1pos) SCLC patients with HES1-negative or HES1-positive tumors.
j-l, Progression-free survival of all (j; n=67, 51 HES1neg, 16 HES1pos), stages I-III (k; n=28, 21 HES1neg, 7 HES1pos) or stage IV (l; n=39, 30 HES1neg, 9 HES1pos) SCLC patients with HES1-negative or HES1-positive tumors.
*P < 0.05; **P < 0.01; ***P < 0.001; ****P < 0.0001. Statistical significance was determined by two-tailed paired (a,b) or unpaired (c,d,f) Student’s t-test. For g-l, probability was calculated using a weighted log-rank test with emphasis on later time points (see methods). Data are represented as mean ± s.d.
Extended Data Figure 10. Notch2/3 inhibition in vivo reduces the Notch-active cell population in SCLC and improves anti-tumor response in combination with chemotherapy.
a, Schematic for the generation of TKO allografts. A TKO tumor was isolated, digested to form single cells and implanted subcutaneously in NSG mice.
b, Representative hematoxylin and eosin (H&E) staining and IHC for Ascl1 in allograft tumor sections.
c, Tumor volumes of TKO allografts treated with the indicated drugs (n=16 tumors per group, 1 experiment). The experiment was stopped at day 18 and samples were collected for analysis.
d,e, Representative IHC for Hes1 (d) or double IHC for Hes1 (brown) and Ascl1 (pink) (e) in TKO allograft tumors collected 18 days after the start of treatment.
f,g, IHC staining quantification for the frequency of Hes1posCC3pos (f) and Hes1posKi67pos (g) cells in murine TKO allografts after 18 days of treatment (n=8 tumors per group, except for C/I and tarex in (f) (n=7 tumors each).
h,i, IHC staining quantification for the frequency of HES1posCC3pos (h) and HES1posKI67pos (i) cells in xenograft tumors after 31 days of treatment (for h, control/tarex groups: n=4 tumors each; C/I: n=3 tumors; tarex+C/I: n=2 tumors; for i, control/tarex groups: n=4 tumors each; C/I and tarex+C/I groups: n=5 tumors each).
j,k, IHC staining quantification for the frequency of Ascl1posCC3pos (j) and Ascl1posKi67pos (k) cells in murine TKO allografts after 18 days of treatment (n=8 tumors per group, except for the C/I group in (j) (n=7 tumors).
l,m, IHC staining quantification for the frequency (%) of ASCL1posCC3pos (l) and ASCL1posKI67pos (m) cells in xenograft tumors after 31 days of treatment (n=4 tumors per group, except for control and tarex groups in (l) (n=2 tumors) and the tarex+C/I group in (m) (n=3 tumors).
n,o, Representative IHC (n) and quantification of HES1pos (o) cells in LU66 PDX tumors collected 56 days after the start of treatment (control: n=3 tumors; tarex: n=4 tumors; C/I and tarex+C/I: n=5 tumors per group).
*P < 0.05; **P < 0.01; ***P < 0.001; ****P < 0.0001. Statistical significance was determined by two-tailed unpaired Student’s t-test. Data are represented as mean ± SEM. Scale bars, 50 μm.
Supplementary Material
Acknowledgments
We thank Dr. Berns for Trp53lox mice, Drs. Fre and Artavanis-Tsakonas for Hes1GFP mice, Drs. Winslow, Krasnow, Rando, and Sweet-Cordero, Sage lab members, and Y. Ouadah for suggestions on the manuscript, and P. Lovelace and J. Ho (FACS), P. Chu (histology), S. Sim and Stanford PAN facility for technical support. We thank the Tumorothèque HUEP (Paris) for SCLC samples and N. Rabbe-Mathiot for immunostaining support. This work was supported by the HHMI (K.C.G.), the NIH (J.S. R01 CA201513), A*STAR Singapore (J.S.L.), Soutien à la Recherche Clinique (Fondation du Souffle and FRSR, M.W.), and the Legs Poix (Chancellerie des Universités de Paris, M.W.). J.S. is the Harriet and Mary Zelencik Scientist in Children’s Cancer and Blood Diseases.
Footnotes
Supplementary Information is available in the online version of the paper.
Author Contributions
J.S.L., M.W., K.C.G., T.H., C.L.M., and J.S. conceptualized the study. J.S.L. designed and performed cell culture assays and experiments using the mouse model. A.I. contributed to immunoblotting and immunostaining. M.M.F, B.C., G.O., J.C., A.M.K. and C.L.M. performed tarextumab and chemotherapy treatments and analysis. S.C. generated TKO allografts. V.L. and K.C.G. provided recombinant Dll4. D.Y. and N.S.J. contributed reagents and to data interpretation. C.H., M.A., M.W. and C.K. performed and analyzed HES1 immunostaining on patient samples. Y.W.L. contributed to Luminex assays. J.S.L., T.H., C.L.M. and J.S. wrote the manuscript with input from all authors. J.S. supervised the study, data interpretation and manuscript preparation.
Microarray data is accessible through NCBI GEO GSE81170.
M.M.F., B.C., G.O., J.C., Y.W.L., A.M.K., T.H., and C.L.M. are employees of OncoMed Pharmaceuticals, a privately held and financed company, and declare competing financial interests.
References
- 1.Hori K, Sen A, Artavanis-Tsakonas S. Notch signaling at a glance. Journal of cell science. 2013;126:2135–2140. doi: 10.1242/jcs.127308. [DOI] [PMC free article] [PubMed] [Google Scholar]
- 2.Ntziachristos P, Lim JS, Sage J, Aifantis I. From fly wings to targeted cancer therapies: a centennial for notch signaling. Cancer Cell. 2014;25:318–334. doi: 10.1016/j.ccr.2014.02.018. [DOI] [PMC free article] [PubMed] [Google Scholar]
- 3.Koch U, Radtke F. Notch and cancer: a double-edged sword. Cell Mol Life Sci. 2007;64:2746–2762. doi: 10.1007/s00018-007-7164-1. [DOI] [PMC free article] [PubMed] [Google Scholar]
- 4.Ito T, et al. Basic helix-loop-helix transcription factors regulate the neuroendocrine differentiation of fetal mouse pulmonary epithelium. Development. 2000;127:3913–3921. doi: 10.1242/dev.127.18.3913. [DOI] [PubMed] [Google Scholar]
- 5.Morimoto M, Nishinakamura R, Saga Y, Kopan R. Different assemblies of Notch receptors coordinate the distribution of the major bronchial Clara, ciliated and neuroendocrine cells. Development. 2012;139:4365–4373. doi: 10.1242/dev.083840. [DOI] [PMC free article] [PubMed] [Google Scholar]
- 6.Tsao PN, et al. Notch signaling controls the balance of ciliated and secretory cell fates in developing airways. Development. 2009;136:2297–2307. doi: 10.1242/dev.034884. [DOI] [PMC free article] [PubMed] [Google Scholar]
- 7.Pietanza MC, Byers LA, Minna JD, Rudin CM. Small cell lung cancer: will recent progress lead to improved outcomes? Clin Cancer Res. 2015;21:2244–2255. doi: 10.1158/1078-0432.CCR-14-2958. [DOI] [PMC free article] [PubMed] [Google Scholar]
- 8.George J, et al. Comprehensive genomic profiles of small cell lung cancer. Nature. 2015;524:47–53. doi: 10.1038/nature14664. [DOI] [PMC free article] [PubMed] [Google Scholar]
- 9.Sriuranpong V, et al. Notch signaling induces cell cycle arrest in small cell lung cancer cells. Cancer Res. 2001;61:3200–3205. [PubMed] [Google Scholar]
- 10.Schaffer BE, et al. Loss of p130 accelerates tumor development in a mouse model for human small-cell lung carcinoma. Cancer Res. 2010;70:3877–3883. doi: 10.1158/0008-5472.CAN-09-4228. doi:0008-5472.CAN-09-4228 [pii] 10.1158/0008-5472.CAN-09-4228. [DOI] [PMC free article] [PubMed] [Google Scholar]
- 11.Fre S, et al. Notch lineages and activity in intestinal stem cells determined by a new set of knock-in mice. PLoS ONE. 2011;6:e25785. doi: 10.1371/journal.pone.0025785. [DOI] [PMC free article] [PubMed] [Google Scholar]
- 12.Krebs LT, Deftos ML, Bevan MJ, Gridley T. The Nrarp gene encodes an ankyrin-repeat protein that is transcriptionally regulated by the notch signaling pathway. Developmental biology. 2001;238:110–119. doi: 10.1006/dbio.2001.0408. [DOI] [PubMed] [Google Scholar]
- 13.Borges M, et al. An achaete-scute homologue essential for neuroendocrine differentiation in the lung. Nature. 1997;386:852–855. doi: 10.1038/386852a0. [DOI] [PubMed] [Google Scholar]
- 14.Jiang T, et al. Achaete-scute complex homologue 1 regulates tumor-initiating capacity in human small cell lung cancer. Cancer Res. 2009;69:845–854. doi: 10.1158/0008-5472.CAN-08-2762. [DOI] [PMC free article] [PubMed] [Google Scholar]
- 15.Kaur G, et al. Bromodomain and hedgehog pathway targets in small cell lung cancer. Cancer Lett. 2016;371:225–239. doi: 10.1016/j.canlet.2015.12.001. [DOI] [PMC free article] [PubMed] [Google Scholar]
- 16.Milano J, et al. Modulation of notch processing by gamma-secretase inhibitors causes intestinal goblet cell metaplasia and induction of genes known to specify gut secretory lineage differentiation. Toxicological sciences : an official journal of the Society of Toxicology. 2004;82:341–358. doi: 10.1093/toxsci/kfh254. [DOI] [PubMed] [Google Scholar]
- 17.Calbo J, et al. A functional role for tumor cell heterogeneity in a mouse model of small cell lung cancer. Cancer cell. 2011;19:244–256. doi: 10.1016/j.ccr.2010.12.021. [DOI] [PubMed] [Google Scholar]
- 18.Sutherland KD, et al. Cell of origin of small cell lung cancer: inactivation of Trp53 and rb1 in distinct cell types of adult mouse lung. Cancer Cell. 2011;19:754–764. doi: 10.1016/j.ccr.2011.04.019. doi:S1535-6108(11)00167-X [pii] 10.1016/j.ccr.2011.04.019. [DOI] [PubMed] [Google Scholar]
- 19.Luca VC, et al. Structural biology. Structural basis for Notch1 engagement of Delta-like 4. Science. 2015;347:847–853. doi: 10.1126/science.1261093. [DOI] [PMC free article] [PubMed] [Google Scholar]
- 20.Yen WC, et al. Targeting Notch signaling with a Notch2/Notch3 antagonist (tarextumab) inhibits tumor growth and decreases tumor-initiating cell frequency. Clin Cancer Res. 2015;21:2084–2095. doi: 10.1158/1078-0432.CCR-14-2808. [DOI] [PubMed] [Google Scholar]
- 21.Morrison SJ, et al. Transient Notch activation initiates an irreversible switch from neurogenesis to gliogenesis by neural crest stem cells. Cell. 2000;101:499–510. doi: 10.1016/s0092-8674(00)80860-0. [DOI] [PubMed] [Google Scholar]
- 22.Ball DW. Achaete-scute homolog-1 and Notch in lung neuroendocrine development and cancer. Cancer Lett. 2004;204:159–169. doi: 10.1016/S0304-3835(03)00452-X. doi:10.1016/S0304-3835(03)00452-X S030438350300452X [pii] [DOI] [PubMed] [Google Scholar]
- 23.Mori N, Schoenherr C, Vandenbergh DJ, Anderson DJ. A common silencer element in the SCG10 and type II Na+ channel genes binds a factor present in nonneuronal cells but not in neuronal cells. Neuron. 1992;9:45–54. doi: 10.1016/0896-6273(92)90219-4. [DOI] [PubMed] [Google Scholar]
- 24.Chong JA, et al. REST: a mammalian silencer protein that restricts sodium channel gene expression to neurons. Cell. 1995;80:949–957. doi: 10.1016/0092-8674(95)90298-8. [DOI] [PubMed] [Google Scholar]
- 25.Ballas N, Mandel G. The many faces of REST oversee epigenetic programming of neuronal genes. Curr Opin Neurobiol. 2005;15:500–506. doi: 10.1016/j.conb.2005.08.015. [DOI] [PubMed] [Google Scholar]
- 26.Pietras K, Ostman A. Hallmarks of cancer: interactions with the tumor stroma. Experimental cell research. 2010;316:1324–1331. doi: 10.1016/j.yexcr.2010.02.045. [DOI] [PubMed] [Google Scholar]
- 27.Banker GA. Trophic interactions between astroglial cells and hippocampal neurons in culture. Science. 1980;209:809–810. doi: 10.1126/science.7403847. [DOI] [PubMed] [Google Scholar]
- 28.Kadomatsu K, Muramatsu T. Midkine and pleiotrophin in neural development and cancer. Cancer Lett. 2004;204:127–143. doi: 10.1016/S0304-3835(03)00450-6. [DOI] [PubMed] [Google Scholar]
- 29.Williamson SC, et al. Vasculogenic mimicry in small cell lung cancer. Nat Commun. 2016;7:13322. doi: 10.1038/ncomms13322. [DOI] [PMC free article] [PubMed] [Google Scholar]
- 30.Chiang AC, Rudin CM, Spira AI, Jotte RM, Gadgeel SM, Mita AC, Hart LL, Gluck WL, Liu SV, Kapoun AM. Updated results of phase 1b of tarextumab (TRXT, OMP-59R5, anti-Notch 2/3) in combination with etoposide and platinum therapy (EP) in patients (pts) with untreated extensive-stage small cell lung cancer (ED-SCLC) Journal of Clinical Oncology. 2016;34 [Google Scholar]
- 31.Madisen L, et al. A robust and high-throughput Cre reporting and characterization system for the whole mouse brain. Nature neuroscience. 2010;13:133–140. doi: 10.1038/nn.2467. [DOI] [PMC free article] [PubMed] [Google Scholar]
- 32.Cheung AF, Dupage MJ, Dong HK, Chen J, Jacks T. Regulated expression of a tumor-associated antigen reveals multiple levels of T-cell tolerance in a mouse model of lung cancer. Cancer Res. 2008;68:9459–9468. doi: 10.1158/0008-5472.CAN-08-2634. [DOI] [PMC free article] [PubMed] [Google Scholar]
- 33.Jahchan NS, et al. A drug repositioning approach identifies tricyclic antidepressants as inhibitors of small cell lung cancer and other neuroendocrine tumors. Cancer Discov. 2013;3:1364–1377. doi: 10.1158/2159-8290.CD-13-0183. [DOI] [PMC free article] [PubMed] [Google Scholar]
- 34.Demitrack ES, et al. Notch signaling regulates gastric antral LGR5 stem cell function. The EMBO journal. 2015;34:2522–2536. doi: 10.15252/embj.201490583. [DOI] [PMC free article] [PubMed] [Google Scholar]
- 35.Rothe C, et al. The human combinatorial antibody library HuCAL GOLD combines diversification of all six CDRs according to the natural immune system with a novel display method for efficient selection of high-affinity antibodies. J Mol Biol. 2008;376:1182–1200. doi: 10.1016/j.jmb.2007.12.018. [DOI] [PubMed] [Google Scholar]
- 36.Brahmer JR, Ettinger DS. Carboplatin in the Treatment of Small Cell Lung Cancer. The oncologist. 1998;3:143–154. [PubMed] [Google Scholar]
- 37.Shi Y, et al. Cisplatin combined with irinotecan or etoposide for untreated extensive-stage small cell lung cancer: A multicenter randomized controlled clinical trial. Thoracic cancer. 2015;6:785–791. doi: 10.1111/1759-7714.12303. [DOI] [PMC free article] [PubMed] [Google Scholar]
- 38.Wu Y, et al. Therapeutic antibody targeting of individual Notch receptors. Nature. 2010;464:1052–1057. doi: 10.1038/nature08878. [DOI] [PubMed] [Google Scholar]
- 39.Riccio O, et al. Loss of intestinal crypt progenitor cells owing to inactivation of both Notch1 and Notch2 is accompanied by derepression of CDK inhibitors p27Kip1 and p57Kip2. EMBO reports. 2008;9:377–383. doi: 10.1038/embor.2008.7. [DOI] [PMC free article] [PubMed] [Google Scholar]
- 40.Jahchan NS, et al. Identification and Targeting of Long-Term Tumor-Propagating Cells in Small Cell Lung Cancer. Cell reports. 2016;16:644–656. doi: 10.1016/j.celrep.2016.06.021. [DOI] [PMC free article] [PubMed] [Google Scholar]
- 41.Nadeau H, Lester HA. NRSF causes cAMP-sensitive suppression of sodium current in cultured hippocampal neurons. J Neurophysiol. 2002;88:409–421. doi: 10.1152/jn.2002.88.1.409. [DOI] [PubMed] [Google Scholar]
- 42.Sanjana NE, Shalem O, Zhang F. Improved vectors and genome-wide libraries for CRISPR screening. Nature methods. 2014;11:783–784. doi: 10.1038/nmeth.3047. [DOI] [PMC free article] [PubMed] [Google Scholar]
- 43.Park KS, et al. A crucial requirement for Hedgehog signaling in small cell lung cancer. Nature medicine. 2011;17:1504–1508. doi: 10.1038/nm.2473. [DOI] [PMC free article] [PubMed] [Google Scholar]
- 44.Zheng Y, et al. A Rare Population of CD24(+)ITGB4(+)Notch(hi) Cells Drives Tumor Propagation in NSCLC and Requires Notch3 for Self-Renewal. Cancer Cell. 2013;24:59–74. doi: 10.1016/j.ccr.2013.05.021. [DOI] [PMC free article] [PubMed] [Google Scholar]
- 45.Tuominen VJ, Ruotoistenmaki S, Viitanen A, Jumppanen M, Isola J. ImmunoRatio: a publicly available web application for quantitative image analysis of estrogen receptor (ER), progesterone receptor (PR), and Ki-67. Breast cancer research : BCR. 2010;12:R56. doi: 10.1186/bcr2615. [DOI] [PMC free article] [PubMed] [Google Scholar]
- 46.Mootha VK, et al. PGC-1alpha-responsive genes involved in oxidative phosphorylation are coordinately downregulated in human diabetes. Nat Genet. 2003;34:267–273. doi: 10.1038/ng1180. [DOI] [PubMed] [Google Scholar]
- 47.Subramanian A, et al. Gene set enrichment analysis: a knowledge-based approach for interpreting genome-wide expression profiles. Proc Natl Acad Sci U S A. 2005;102:15545–15550. doi: 10.1073/pnas.0506580102. doi:0506580102 [pii] 10.1073/pnas.0506580102. [DOI] [PMC free article] [PubMed] [Google Scholar]
- 48.Kuleshov MV, et al. Enrichr: a comprehensive gene set enrichment analysis web server 2016 update. Nucleic acids research. 2016;44:W90–97. doi: 10.1093/nar/gkw377. [DOI] [PMC free article] [PubMed] [Google Scholar]
- 49.Chen EY, et al. Enrichr: interactive and collaborative H™L5 gene list enrichment analysis tool. BMC bioinformatics. 2013;14:128. doi: 10.1186/1471-2105-14-128. [DOI] [PMC free article] [PubMed] [Google Scholar]
- 50.Hodges PE, et al. Annotating the human proteome: the Human Proteome Survey Database (HumanPSD) and an in-depth target database for G protein-coupled receptors (GPCR-PD) from Incyte Genomics. Nucleic acids research. 2002;30:137–141. doi: 10.1093/nar/30.1.137. [DOI] [PMC free article] [PubMed] [Google Scholar]
- 51.Matys V, et al. TRANSFAC and its module TRANSCompel: transcriptional gene regulation in eukaryotes. Nucleic acids research. 2006;34:D108–110. doi: 10.1093/nar/gkj143. [DOI] [PMC free article] [PubMed] [Google Scholar]
- 52.Denny SK, et al. Nfib Promotes Metastasis through a Widespread Increase in Chromatin Accessibility. Cell. 2016;166:328–342. doi: 10.1016/j.cell.2016.05.052. [DOI] [PMC free article] [PubMed] [Google Scholar]
- 53.Yang JS, et al. OASIS: online application for the survival analysis of lifespan assays performed in aging research. PLoS One. 2011;6:e23525. doi: 10.1371/journal.pone.0023525. [DOI] [PMC free article] [PubMed] [Google Scholar]
- 54.Corish P, Tyler-Smith C. Attenuation of green fluorescent protein half-life in mammalian cells. Protein engineering. 1999;12:1035–1040. doi: 10.1093/protein/12.12.1035. [DOI] [PubMed] [Google Scholar]
- 55.Hirata H, et al. Oscillatory expression of the bHLH factor Hes1 regulated by a negative feedback loop. Science. 2002;298:840–843. doi: 10.1126/science.1074560. [DOI] [PubMed] [Google Scholar]
- 56.Kobayashi T, et al. The cyclic gene Hes1 contributes to diverse differentiation responses of embryonic stem cells. Genes & development. 2009;23:1870–1875. doi: 10.1101/gad.1823109. [DOI] [PMC free article] [PubMed] [Google Scholar]
Associated Data
This section collects any data citations, data availability statements, or supplementary materials included in this article.
Supplementary Materials
Data Availability Statement
Microarray data is available at the NCBI Gene Expression Omnibus (GEO), accession number GSE81170. Normalized values for significantly differentially expressed genes are provided in Supplementary Table 1; GSEA analyses are in Supplementary Tables 2-4. HES1 immunostaining and survival data of SCLC patients are provided in Supplementary Table 5. For immunoblot source data, see Supplementary Fig. 1. Source data is provided for Figures 1b, 1d, 2a, 4g-i and Extended Data Figures 4c, 5j, 6c, 8s, 9c-d, 9f, 10c, 10f-m, 10o.