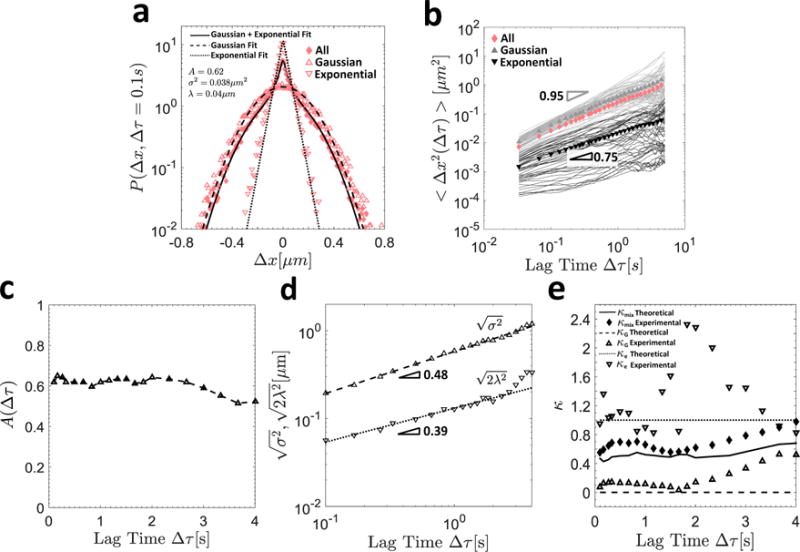
Figure 5.

In (a), the van Hove distribution for all particles is shown by the diamond symbols, and the thick solid line indicates the composite Gaussian and exponential fit defined in Equation (9). The hollow triangles and inverted triangles denote the van Hove distributions of the Gaussian and exponential particles, respectively, and their respective Gaussian (dashed) and exponential (dotted) fits are also shown. In (b), the individual particle MSDs sorted into Gaussian (gray) and exponential (black) trajectories are shown, as well as their ensemble averages (filled symbols of the same color) and that of the aggregate population (solid pink diamonds). In (c), the fraction of Gaussian particles A(∆τ) is shown as a function of the lag time ∆τ. In (d), the characteristic Gaussian and exponential length scales and , respectively, are plotted as a function of the lag time, and the slope of the resulting power-law fit is indicated. In (e), the experimental (symbols) and theoretical (lines) values of the non-Gaussian parameters κ (Equation (7)) for the exponential (dotted lines and hollow inverted triangles), Gaussian (dashed lines and hollow triangles), and aggregate (solid lines and solid diamonds) populations are shown as a function of lag time ∆τ.
