Abstract
Background
Estimation of diffuse myocardial fibrosis, substrate for adverse events such as heart failure and arrhythmias in patients with various cardiac disorders, is presently done by histopathology or cardiac magnetic resonance. We sought to develop a non-contrast method to estimate the amount of diffuse myocardial fibrosis leveraging dual energy computed tomography (DECT) in phantoms and a suitable small animal model.
Methods
Phantoms consisted of homogenized bovine myocardium with varying amounts of type 1 collagen. Fifteen mice underwent sham surgery, no procedure, or transverse aortic constriction (TAC) for 5 or 8 weeks to produce moderate or severe fibrosis, respectively. Phantoms and ex vivo mouse hearts were imaged on a single source, DECT scanner equipped with kVp switching. Monochromatic images were reconstructed at 40 to 140 keV. Linear discriminant analysis (LDA) was performed on mean myocardial CT numbers derived from single energy (70 keV) images as well as images reconstructed across multiple energies.
Results
Classification of myocardial fibrosis severity as low, moderate or severe was more often correct using the multi-energy CT/LDA approach vs. single energy CT/LDA in both phantoms (80.0% vs. 70.0%) and mice (93.3% vs. 33.3%).
Conclusions
DECT myocardial imaging with multi-energy analysis better classifies myocardial fibrosis severity compared to a single energy-based approach. Non-contrast DECT can accurately and non-invasively estimate the extent of diffuse myocardial fibrosis in phantom and animal models. These data support further evaluation of this approach for in vivo myocardial fibrosis estimation.
Keywords: Dual energy computed tomography, myocardial fibrosis
Subject codes: Imaging, Computerized Tomography, Fibrosis, Animal Models of Human Disease
1. Introduction
Myocardial fibrosis, a pathologic accumulation of collagen in cardiac muscle, contributes to heart failure, arrhythmias, and death across a broad range of ischemic and non-ischemic heart disease.1, 2 Detection and quantification of left ventricular (LV) myocardial fibrosis aids in diagnosis and treatment planning for patients with heart failure and cardiomyopathies or those at-risk for arrhythmias3, and can be determined by direct histopathological examination of myocardial tissue or contrast-enhanced magnetic resonance techniques.4 Histological analysis requires invasive biopsy to obtain tissue samples, and may be limited by sampling error and high morbidity.5 Recent advances in quantitative cardiac magnetic resonance imaging (CMR) mapping techniques offer non-invasive computation of the myocardial extracellular volume fraction (ECV), and have been correlated with the extent of myocardial fibrosis.6 However, claustrophobia, non-MR compatible implants and other limitations preclude CMR-based estimates of myocardial fibrosis in a number of patients with known or suspected myocardial disease.
Computed tomography (CT) holds appeal as a potential alternative to CMR for such patients. Dual energy CT (DECT) offers greater material discrimination capabilities compared to single energy CT due to inherent differences in attenuation at multiple x-ray energies, even without exposure to an exogenous contrast agent. Effective and reliable material differentiation is a critical requirement for quantification of collagen deposition in fibrotic myocardium that could make cardiac CT a useful alternative to CMR when needed. Recent observational data suggest that DECT may be able to differentiate collagen from other tissues.7,8
Several recent studies have utilized both single and dual-energy, contrast-enhanced CT techniques to estimate ECV.9–11 While potentially useful, it requires exposure to iodinated contrast. We sought to develop and validate a novel DECT-based approach to estimate myocardial collagen content, taking advantage of multi-energy information and statistical classifiers to differentiate between increasing severity of fibrosis from a single non-contrast scan. We hypothesized that a multi-energy approach would perform better than currently available single energy strategies for fibrosis classification.
2. Methods
2.1 Phantom Studies
Type I collagen tablets (GNC, New York) were crushed, the coating removed and the remaining contents dissolved in saline to produce a 500 mg/ml stock solution. Bovine myocardium was divided into 5 mm thick slices. Epicardial fat was removed and myocardium was homogenized using a Kinematica (Luzern, Switzerland) tissue homogenizer. Varying concentrations of stock collagen solution were added to 5 ml of homogenized tissue to obtain 0, 7, 10, 15, 20, 30, 40 and 62% collagen phantoms by mass. Collagen concentrations were chosen to encompass the range of fibrosis observed in a small animal model, and to include values outside of the established range to evaluate the sensitivity of the DECT quantification method.12
2.2 Animal Model
All animal experiments were approved by Ohio State University’s Institutional Animal Care and Use Committee and performed only by staff experienced in all aspects of the procedures. Fibrosis in murine myocardium was induced in C57Bl/6 mice using transverse aortic constriction (TAC)13 surgery, which reliably produces myocardial remodeling with diffuse fibrosis enriched for type I collagen in hypertrophied left ventricular myocardium. The extent of fibrosis in this model increases with time after surgery, thus the mice were stratified into three groups based on the time elapsed post-surgery. The three experimental groups were: i) control (sham procedure, n=7), ii) developing fibrosis (5 weeks of TAC,n=4), and iii) significant fibrosis (8 weeks of TAC, n=4).14 Echocardiography was performed on lightly anesthetized (1.5% isoflurane), 5-week TAC and sham mice using a VEVO 2100 Visual Sonics system (Visual Sonics, Toronto). Left ventricular ejection fraction (EF) and fractional shortening were recorded to confirm TAC surgery was effective and to monitor the progression of remodeling. Animals were sacrificed immediately prior to ex vivo DECT imaging on freshly harvested hearts. Heart weight, lung weight and tibial length were measured.
2.3 Histology
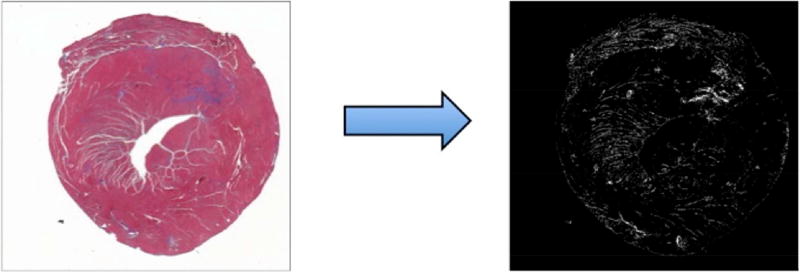
Following DECT imaging, harvested hearts were sectioned for histological analysis. Sections reserved for histology were fixed in 10% buffered formalin, embedded in paraffin, and sliced into five-micron sections. Slices were stained with hematoxylin/eosin (H&E) and Masson’s trichrome. Images were acquired with a PathScan Enabler IV pathology slide scanner (Meyer Instruments). Collagen volume fraction (CVF) was obtained from whole slice images; positively stained pixels were calculated as a fraction of total pixels using available image processing tools (Matlab, The Mathworks, Natick, MA; Fig 1).
Figure 1.
Histology tissue section with trichrome stain (left) and post-processed histology image (right) are shown. Matlab color thresholding tools allow calculation of total myocardial pixels as the sum of non-white (e.g. red-myocardium and blue-collagen) pixels on the original image (left). Blue-staining collagen is rendered as white pixels on the thresholded image (right). Collagen volume fraction (CVF) is computed ratio of collagen-stained pixels to the total pixels.
2.4 Dual Energy CT
All imaging was performed on a 64-slice multi-detector, single source scanner with kVp switching capabilities (750HD, GE Healthcare, Waukesha, WI). Dual energy imaging was performed using an interleaved acquisition with tube voltages 80 and 140 kVp, tube current 640 mA, switching time of 0.2 s and a gantry rotation time of 0.35 s. Images were acquired with detector coverage of 40 mm, slice thickness of 0.625 mm and matrix size of 51215. Gated DECT acquisition involves prospective electrocardiographic (ECG) triggering i.e. acquisition at a fixed point in the cardiac cycle based on detection of an ECG signal that is not present in phantoms or postmortem hearts. Therefore, a simulated ECG waveform at 70 bpm was used to trigger both phantom and ex vivo animal DECT acquisitions. Phantom and ex vivo samples were scanned in 2 ml screw-top tubes (ThermoFisher Scientific, Waltham,MA) without any additional fluid; the samples were scanned in air.
2.5 Post-Processing
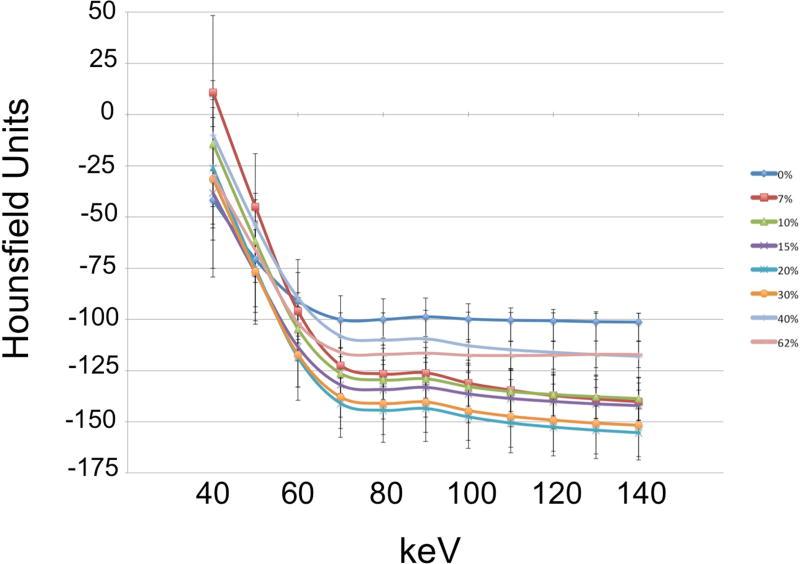
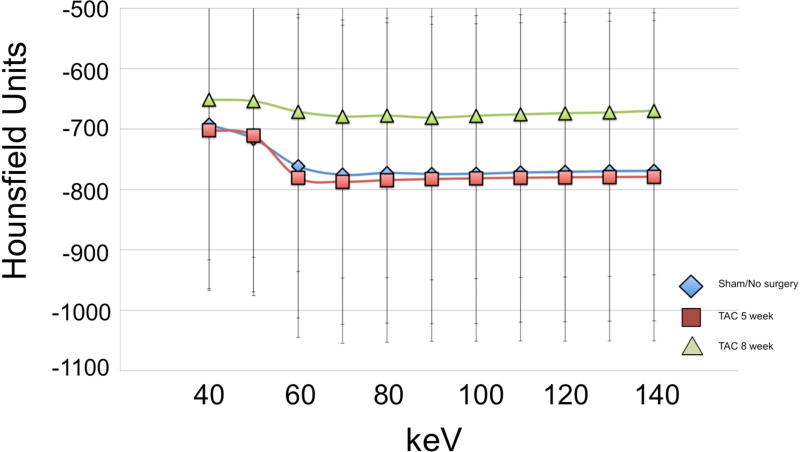
Dual energy acquisitions were reconstructed into monochromatic images in the range of 40–140 keV with increments of 10 keV, using GE AW software (GE Healthcare; Waukesha, WI). Monochromatic reconstructions were generated using the material decomposition method. The material decomposition method utilizes basis materials, iodine and water, for which the relationship between material density and attenuation is known15. By transforming the attenuation of each acquired pixel at high and low kVp acquisitions into the corresponding density of basis materials, behavior at any energy level can be approximated to render monochromatic reconstructions. Reconstructions were generated with a slice thickness of 0.625 mm. Regions of interest (ROIs) of approximately 200 mm2 were drawn to encompass the entire phantom volume or explanted myocardium. Edges of the plastic tube were avoided, though the ROI may have included air. CT attenuation values (Hounsfield units, HU) for each pixel at all monochromatic energy levels within the ROI were exported. Attenuation values were then post-processed to remove pixels containing only air (HU<−1000) and artifacts from tube edges (HU > 3000). Mean and standard deviation of attenuation values at each energy level were calculated for all phantoms (Table 1, Fig.5) and ex vivo samples (Table 2, Fig.6).
Table 1.
Mean attenuation values ± standard deviation (HU) at every reconstructed energy level for each collagen phantom are shown.
| Collagen Concentration (%) |
40 keV | 50 keV | 60 keV | 70 keV | 80 keV | 90 keV | 100 keV | 110 keV | 120 keV | 130 keV | 140 keV |
|---|---|---|---|---|---|---|---|---|---|---|---|
| 0 | −256.8 ± 21.7 | −291.0 ± 35.2 | −347.8 ± 49.9 | −391.6 ± 53.6 | −393.5 ± 53.8 | −392.9 ± 53.3 | −397.8 ± 53.0 | −401.6 ± 51.6 | −403.7 ± 51.3 | −404.8 ± 50.9 | −405.5 ± 50.8 |
| 7 | −345.9 ± 137.6 | −419.2 ± 114.7 | −513.7 ± 90.8 | −596.3 ± 66.8 | −611.1 ± 62.1 | −612.8 ± 62.1 | −623.0 ± 60.6 | −628.6 ± 59.7 | −631.8 ± 59.9 | −634.2 ± 60.2 | −635.6 ± 60.6 |
| 10 | −325.0 ± 105.2 | −383.2 ± 94.3 | −463.0 ± 83.3 | −535.1 ± 86.5 | 547.5 ± 73.3 | −549.2 ± 73.9 | −560.3 ± 75.1 | 566.5 ± 75.5 | −570.6 ± 75.7 | −573.7 ± 76.0 | 575.6 ± 76.2 |
| 15 | −375.2 ± 136.4 | −434.4 ± 114.3 | −510.6 ± 95.2 | −581.0 ± 86.5 | −592.8 ± 82.3 | −593.9 ± 81.5 | −604.3 ± 79.2 | −610.5 ± 77.5 | −614.0 ± 76.8 | −616.5 ± 76.2 | −617.7 ± 76.1 |
| 20 | −417.5 ± 77.0 | −486.2 ± 52.0 | −570.0 ± 30.2 | −643.4 ± 12.7 | −654.7 ± 14.3 | −656.1 ± 15.1 | −666.7 ± 16.2 | −671.9 ± 17.6 | −675.1 ± 18.3 | −677.0 ± 19.2 | −678.3 ± 19.6 |
| 30 | −327.4 ± 33.0 | −385.6 ± 31.7 | −460.7 ± 35.4 | −523.1 ± 33.7 | −532.4 ± 31.8 | −533.8 ± 30.9 | −542.2 ± 31.2 | −547.2 ± 31.1 | −549.8 ± 31.2 | −552.1 ± 31.1 | −553.3 ± 31.0 |
| 40 | −321.9 ± 77.0 | −378.7 ± 51.9 | −449.8 ± 30.2 | −523.0 ± 12.7 | −535.9 ± 14.3 | −538.8 ± 15.1 | −549.5 ± 16.2 | −555.9 ± 17.6 | −559.7 ± 18.3 | −562.0 ± 19.2 | −563.7 ± 19.6 |
| 62 | −325.6 ± 64.3 | −380.5 ± 47.0 | −455.6 ± 30.7 | −533.9 ± 21.6 | −547.3 ± 23.2 | −549.4 ± 24.1 | −560.6 ± 24.5 | −567.2 ± 25.6 | −570.8 ± 26.3 | −573.4 ± 26.8 | −575.2 ± 27.1 |
Figure 5.
Mean attenuation-energy curves are shown for the phantom experiments. Note the overlap of error bars, representing standard deviation, across collagen concentration groups.
Table 2.
Mean attenuation values ± standard deviation (HU) at every reconstructed energy level for the TAC fibrosis model are shown.
| TAC Week | 40 keV | 50 keV | 60 keV | 70 keV | 80 keV | 90 keV | 100 keV | 110 keV | 120 keV | 130 keV | 140 keV |
|---|---|---|---|---|---|---|---|---|---|---|---|
| 0 week | −692.5 ± 271.6 | −716.0 ± 259.7 | −761.4 ± 251.3 | −775.5 ± 247.7 | −772.5 ± 248.6 | −774.3 ± 248.0 | −773.8 ± 248.2 | −771.8 ± 248.0 | −770.8 ± 248.1 | −769.6 ± 248.2 | −769.0 ± 248.6 |
| 5 week | −702.0 ± 251.4 | −710.6 ± 256.6 | −780.4 ± 261.3 | −787.0 ± 261.1 | −784.4 ± 260.5 | −782.7 ± 261.4 | −781.4 ± 262.4 | −780.5 ± 263.1 | −779.8 ± 263.7 | −779.3 ± 264.1 | −778.9 ± 264.4 |
| 8 week | −651.2 ± 265.5 | −653.6 ± 258.9 | −671.2 ± 264.6 | −679.0 ± 267.6 | −677.8 ± 268.2 | −681.0 ± 268.5 | −677.9 ± 269.6 | −675.6 ± 270.2 | −673.7 ± 271.7 | −672.5 ± 271.4 | −669.6 ± 271.6 |
Figure 6.
Mean attenuation-energy curves are shown for the ex vivo animal experiments. Note the large overlap of error bars across the three groups.
2.6 Analysis
All statistical analysis was performed with STATA v12.0 (College Station, TX). Multivariate analysis of variance (MANOVA) was performed to test whether the mean CT attenuation values were significantly different between concentration groups (phantom) or disease severity groups (length of TAC exposure, animal).
Multivariate regression analysis was performed using animal data to examine the associations of multi-energy CT attenuation values with hypertrophy measured by heart weight to tibia length ratio, and collagen content measured by CVF.
Linear discriminant analysis (LDA) was a commonly used statistical tool for classification of collagen content16. Briefly, the distances between multi-dimensional data points (multi-energy attenuation values in our application) were calculated. Sets of points that fell close together in the multi-dimensional space might share a particular identifying characteristic and were classified as clusters.
LDA was performed using the post-processed mean attenuation values. Data were separated using one energy (70 keV) vs. all eleven energies (40–140 keV) as grouping variables, described as single vs. multi-energy analysis, respectively. Single energy reconstructions were generated at 70 keV to most closely resemble 120 kVp single-energy acquisitions.17 Three- and eight-class LDA was performed as follows. For three-class LDA, phantoms were grouped into low (0–7%), moderate (10–20%) and significant (30–62%) collagen concentration categories.12 Eight-class LDA was performed by setting each collagen concentration as a separate group. Single and multi-energy three-class LDA was performed with murine heart data grouped according to length of TAC exposure (0, 5, or 8 weeks). Prospective LDA returned a predicted grouping based on CT characteristics for each phantom and animal sample. Correct and incorrect classification rates were calculated as a proportion of total samples.
3. Results
3.1 Phantom Experiments
The MANOVA result indicated a significant difference in mean CT attenuation between collagen concentration groups (p=0.0039).
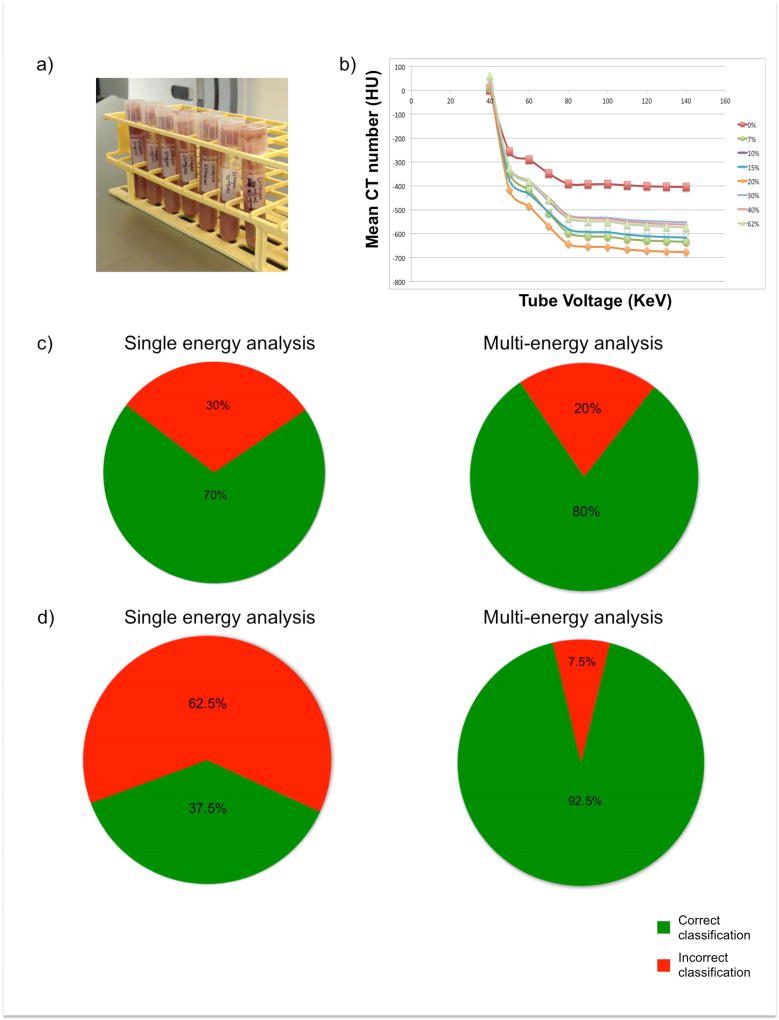
The LDA approach described to classify phantoms into one of 3 classes of collagen content (low, moderate, or severe) yielded a correct classification rate of 70% using single energy image analysis; this increased to 80.0% with multi-energy analysis (Fig 2). While 8-class LDA decreased the overall correct classification rate of single-energy analysis to 37.5%, it improved multi-energy analysis accuracy to 92.5%.
Figure 2.
Phantoms consist of homogenized bovine myocardium and collagen solution (a). Mean ROI attenuation of each phantom is plotted across reconstructed energies (b). Results of single and multi-energy 3-class LDA analysis are shown (c). Results of single and multi-energy 8-class LDA analysis are shown (d).
3.2 Animal Experiments
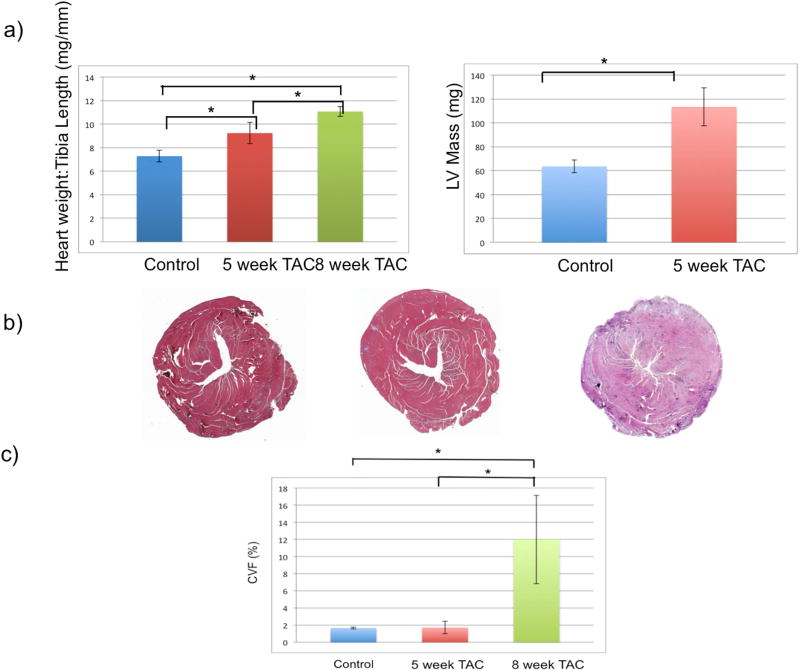
Echocardiography confirmed progressive cardiac dysfunction with TAC, and LV mass also increased (Fig 3a). Increased CVF (Fig 3b) by histology confirmed the development of myocardial fibrosis following TAC.
Figure 3.
Results of TAC procedures are shown. Post-TAC animals demonstrate an exposure dependent increase in heart weight to tibia length ratio (a, left), LV mass (a, right) and collagen content (b, c). Asterisks indicate a statistically significant difference (p<0.05).
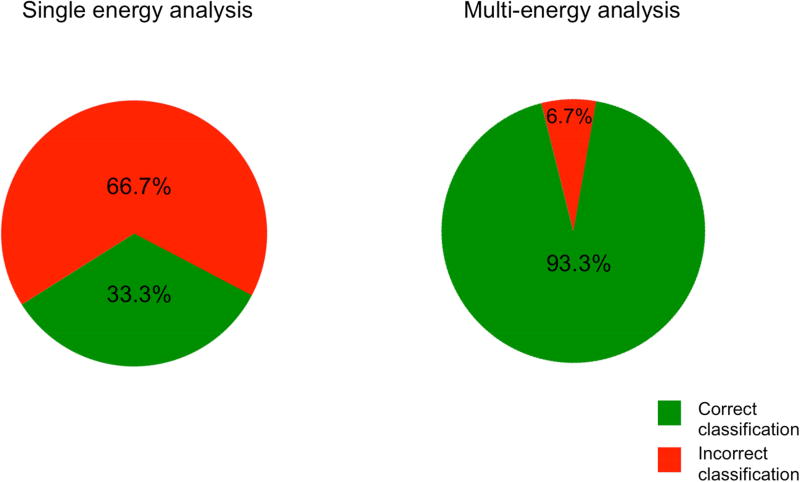
The MANOVA result indicated that there was no significant difference in mean single energy CT attenuation between animal disease severity groups (p=0.5454). However, multivariate regression demonstrated a significant association between 11-energy CT attenuation and collagen value fraction (R2 = 0.9961, overall F-test p=0.0025). The association between multi-energy CT attenuation and hypertrophy was not significant (R2 = 0.7466, overall F-test p=0.66). Multi-energy three-class LDA demonstrated a correct classification rate of 93.3%. Three-class LDA of single energy image data performed poorly (Fig 4).
Figure 4.
Results of three-class LDA of animal data are shown. Single energy LDA demonstrates lower correct classification rate and higher frequency of misclassifications.
4. Discussion
This work presents a novel, noninvasive approach to estimate myocardial fibrosis using non-contrast DECT. Validation of the approach was shown in both a phantom model of variable collagen content and an animal model of graded myocardial fibrosis similar to that seen in patients with diffuse interstitial fibrosis. Comparison of phantom collagen concentration and CT attenuation demonstrated a statistically significant difference between groups. Single energy CT attenuations were not statistically different between animal disease severity groups. However, multi-variate regression analysis in animal data demonstrated a significant association between multienenergy CT attenuation and collagen volume fraction.
In addition, LDA analysis was able to correctly classify fibrosis severity in both the phantom and animal models. The multi-energy technique described performed better than single energy image-based classification of myocardial fibrosis severity. Interestingly, we obtained superior results from animal vs. phantom experiments. This may reflect the fact that the fibrillar network of collagen, characteristic of pathophysiological myocardial fibrosis, is not fully replicated in the phantom. While the phantom afforded precise manufacturing of myocardial collagen content across a range comparable to that observed in humans, the animal model likely afforded a more realistic replication of interactions between x-ray photons and collagen to yield CT attenuation comparable to what occurs in vivo in humans. Recent studies investigating the potential of DECT for tissue characterization have proposed that low-energy attenuation measurements afford greater distinction among tissue components, compared to higher-energy attenuation measurements18, 19. However, our data do not show a consistent change in attenuation behavior due to collagen concentration or disease severity at lower vs. higher energy levels. Collagen deposition appears to alter the overall relationship between x-ray photon energy and attenuation, a difference that we show can be identified by analyzing data in a multi-energy, multi-dimensional space.
Further studies are needed to investigate the specificity of this classifier in rating collagen content compared to other materials that may deposit in diseased myocardium. Next steps should include comparison to contrast-enhanced DECT and MRI-based methods for myocardial fibrosis estimation.
Diffuse myocardial fibrosis contributes to abnormal cardiac mechanics and electrophysiological properties, both incurring risk of adverse events such as heart failure and arrhythmias. The presence of myocardial fibrosis by late gadolinium enhancement (LGE) CMR has proven prognostic value beyond measures of contractility such as ejection fraction20 and T1 mapping may better demonstrate diffuse fibrosis compared to LGE. However, some proportion of patients requiring myocardial tissue characterization have sufficient claustrophobia to preclude entry into even larger bore MR scanners. Further, despite decades of work, MR coronary angiography remains limited compared to computed tomography angiography (CTA) for reliable evaluation of the entire epicardial coronary tree. We have previously shown that coronary artery calcium scores derived from noncontrast DECT are comparable to those obtained with single energy CT, with an estimated radiation exposure within the range used for protocols such as CT perfusion and other advanced cardiac applications.17 Thus, in patients who are referred to rule-out coronary artery disease (CAD) in the setting of new-onset cardiomyopathy or ventricular arrhythmia, the typical non-contrast scan that precedes CTA could be replaced with a non-contrast DECT scan followed by CTA that would offer combined assessment of both epicardial CAD and myocardial fibrosis in a single noninvasive imaging procedure.
4.1 Limitations
All experiments were performed ex vivo and therefore the attenuation values obtained in this study maybe different from in vivo values. However, the aim of this study was to validate a novel non-contrast DECT method and demonstrate the ability of this technique to differentiate between fibrotic and non-fibrotic tissue. Additionally, we used a single region of interest encompassing the entire myocardium of each ex vivo mouse heart image to yield average myocardial attenuation values rather than attempting regional myocardial characterization in this diffuse fibrosis model. Further studies using models with segmental myocardial variations (e.g. myocardial infarction models) may benefit from higher resolution dual energy micro-CT systems and co-localization of images and histology to compare regional fibrosis quantification.
5. Conclusions
In conclusion, we have shown that non-contrast DECT acquisition combined with multi-energy analysis performs well in estimating myocardial fibrosis severity. Further validation studies are warranted in humans to guide subsequent work using DECT-derived myocardial fibrosis estimation as a biomarker for risk stratification and treatment planning.
Acknowledgments
Source of Funding: This work was supported in part by the National Institutes of Health (5R01HL116533) and OSU’s Davis Heart and Lung Research Institute Trifit Award.
Footnotes
Publisher's Disclaimer: This is a PDF file of an unedited manuscript that has been accepted for publication. As a service to our customers we are providing this early version of the manuscript. The manuscript will undergo copyediting, typesetting, and review of the resulting proof before it is published in its final citable form. Please note that during the production process errors may be discovered which could affect the content, and all legal disclaimers that apply to the journal pertain.
Conflicts of Interest: The authors have no relevant financial conflicts of interest to disclose.
References
- 1.Saffitz JE. The pathology of sudden cardiac death in patients with ischemic heart disease--arrhythmology for anatomic pathologists. Cardiovascular pathology : the official journal of the Society for Cardiovascular Pathology. 2005;14:195–203. doi: 10.1016/j.carpath.2005.04.005. [DOI] [PubMed] [Google Scholar]
- 2.Mewton N, Liu CY, Croisille P, Bluemke D, Lima JA. Assessment of myocardial fibrosis with cardiovascular magnetic resonance. Journal of the American College of Cardiology. 2011;57:891–903. doi: 10.1016/j.jacc.2010.11.013. [DOI] [PMC free article] [PubMed] [Google Scholar]
- 3.Priori SG, Blomstrom-Lundqvist C, Mazzanti A, et al. 2015 ESC Guidelines for the management of patients with ventricular arrhythmias and the prevention of sudden cardiac Death. The Task Force for the Management of Patients with Ventricular Arrhythmias and the Prevention of Sudden Cardiac Death of the European Society of Cardiology. Giornale italiano di cardiologia. 2016;17:108–170. doi: 10.1714/2174.23496. [DOI] [PubMed] [Google Scholar]
- 4.Yi CJ, Wu CO, Tee M, et al. The association between cardiovascular risk and cardiovascular magnetic resonance measures of fibrosis: the Multi-Ethnic Study of Atherosclerosis (MESA) Journal of cardiovascular magnetic resonance : official journal of the Society for Cardiovascular Magnetic Resonance. 2015;17:15. doi: 10.1186/s12968-015-0121-5. [DOI] [PMC free article] [PubMed] [Google Scholar]
- 5.Whittaker P, Kloner RA, Boughner DR, Pickering JG. Quantitative assessment of myocardial collagen with picrosirius red staining and circularly polarized light. Basic research in cardiology. 1994;89:397–410. doi: 10.1007/BF00788278. [DOI] [PubMed] [Google Scholar]
- 6.Diao KY, Yang ZG, Xu HY, et al. Histologic validation of myocardial fibrosis measured by T1 mapping: a systematic review and meta-analysis. Journal of cardiovascular magnetic resonance : official journal of the Society for Cardiovascular Magnetic Resonance. 2016;18:92. doi: 10.1186/s12968-016-0313-7. [DOI] [PMC free article] [PubMed] [Google Scholar]
- 7.Johnson TR, Krauss B, Sedlmair M, et al. Material differentiation by dual energy CT: initial experience. European radiology. 2007;17:1510–1517. doi: 10.1007/s00330-006-0517-6. [DOI] [PubMed] [Google Scholar]
- 8.Lamb P, Sahani D, Fuentes-Oreego J, Patino M, Ghosh A, Mendonca P. Stratification of patients with liver fibrosis using dual-energy CT. IEEE Trans Med Imaging. 2014 doi: 10.1109/TMI.2014.2353044. [DOI] [PubMed] [Google Scholar]
- 9.Bandula S, White SK, Flett AS, et al. Measurement of myocardial extracellular volume fraction by using equilibrium contrast-enhanced CT: validation against histologic findings. Radiology. 2013;269:396–403. doi: 10.1148/radiology.13130130. [DOI] [PubMed] [Google Scholar]
- 10.Nacif MS, Kawel N, Lee JJ, et al. Interstitial myocardial fibrosis assessed as extracellular volume fraction with low-radiation-dose cardiac CT. Radiology. 2012;264:876–883. doi: 10.1148/radiol.12112458. [DOI] [PMC free article] [PubMed] [Google Scholar]
- 11.Hong YJ, Kim TK, Hong D, et al. Myocardial Characterization Using Dual-Energy CT in Doxorubicin-Induced DCM: Comparison With CMR T1-Mapping and Histology in a Rabbit Model. JACC. Cardiovascular imaging. 2016;9:836–845. doi: 10.1016/j.jcmg.2015.12.018. [DOI] [PubMed] [Google Scholar]
- 12.Ying X, Lee K, Li N, Corbett D, Mendoza L, Frangogiannis NG. Characterization of the Inflammatory and Fibrotic Response in a Mouse Model of Cardiac Pressure Overload. Histochemistry and cell biology. 2009;131:471–481. doi: 10.1007/s00418-008-0541-5. [DOI] [PMC free article] [PubMed] [Google Scholar]
- 13.Stuckey DJ, McSweeney SJ, Thin MZ, et al. T(1) mapping detects pharmacological retardation of diffuse cardiac fibrosis in mouse pressure-overload hypertrophy. Circulation. Cardiovascular imaging. 2014;7:240–249. doi: 10.1161/CIRCIMAGING.113.000993. [DOI] [PubMed] [Google Scholar]
- 14.deAlmeida AC, van Oort RJ, Wehrens XHT. Transverse Aortic Constriction in Mice. Journal of Visualized Experiments : JoVE. 2010 doi: 10.3791/1729. [DOI] [PMC free article] [PubMed] [Google Scholar]
- 15.Zhang D, Li X, Liu B. Objective characterization of GE discovery CT750 HD scanner: gemstone spectral imaging mode. Medical physics. 2011;38:1178–1188. doi: 10.1118/1.3551999. [DOI] [PubMed] [Google Scholar]
- 16.Fukunaga K. Introduction to Statistical Pattern Recognition. 2. Boston: Academic Press; 1990. pp. 124–181. [Google Scholar]
- 17.Kumar V, Min JK, He X, Raman SV. Computation of Calcium Score With Dual-Energy Computed Tomography: A Phantom Study. Journal of computer assisted tomography. 2017;41:156–158. doi: 10.1097/RCT.0000000000000480. [DOI] [PMC free article] [PubMed] [Google Scholar]
- 18.Rodriguez-Granillo GA, Campisi R, Deviggiano A, et al. Detection of Myocardial Infarction Using Delayed Enhancement Dual-Energy CT in Stable Patients. AJR. American journal of roentgenology. 2017:1–10. doi: 10.2214/AJR.17.18118. [DOI] [PubMed] [Google Scholar]
- 19.Reynoso E, Rodriguez-Granillo GA, Capunay C, Deviggiano A, Meli F, Carrascosa P. Spectral Signal Density of Carotid Plaque Using Dual-Energy Computed Tomography. Journal of neuroimaging : official journal of the American Society of Neuroimaging. 2017;27:511–516. doi: 10.1111/jon.12440. [DOI] [PubMed] [Google Scholar]
- 20.Gulati A, Jabbour A, Ismail TF, et al. Association of fibrosis with mortality and sudden cardiac death in patients with nonischemic dilated cardiomyopathy. Journal of the American Medical Association. 2013;309:896–908. doi: 10.1001/jama.2013.1363. [DOI] [PubMed] [Google Scholar]


