

Abstract
Background/Objective
Epidemiology of hospitalizations with infection among patients with rheumatoid arthritis (RA) is unknown despite an increase in RA treatments that confer infection risk.
Methods
We examined National Inpatient Sample data from 1993–2013. We identified adults RA hospitalizations, defined by having ICD-9-CM codes (714.xx) in any secondary diagnosis field. We evaluated 5 infections as the primary diagnosis: pneumonia, sepsis, urinary tract infection (UTI), skin and soft tissue infections (SSTI), and opportunistic infections (OIs). The primary outcome was the proportion of hospitalizations for each infection, among all hospitalizations with a secondary diagnosis of RA.
Results
There were 792,921 hospitalizations for infection with a secondary diagnosis of RA, with the rates increasing from 90 to 206 per 100,000 persons from 1993–2013. The proportion of hospitalizations decreased for pneumonia (5.4 % to 4.6 %), UTI (0.4% to 0.38%), and OIs (0.44% to 0.26%). The proportion for SSTI increased slightly (2.3 % to 2.5%), while hospitalizations for sepsis more than tripled (1.9% to 6.4%).
Conclusions
Between 1993 and 2013, the proportion of hospitalizations for infections among RA patients appeared to decline for pneumonia and OIs, with a slight decrease in UTI, a slight increase in SSTI, and a substantial increase in hospitalizations with sepsis. Our results are consistent with previous reports that the sensitivity of sepsis coding has increased over time.
Keywords: rheumatoid arthritis, infections, epidemiology
INTRODUCTION
Patients with rheumatoid arthritis (RA) are at an increased risk of developing infections relative to those without RA (1). The reasons for the increased infection risk in patients with RA are multifactorial including the underlying immunologic disturbance associated with the disease process, other immunocompromising comorbidities, and immunosuppressive therapies for RA treatment. In recent years, use of biologic agents in clinical practice has increased as more agents became accepted that resulted in wider adaptation of treat-to-target strategies. A recent analysis of US prescribing patterns reported an increase in biologic use from 3% of patients in 1999 to 26% in 2006 (2). With the increasing uptake of biologic agents that confer infection risk, an increase in the rates of infection hospitalizations among RA patients is expected. However, limited data exists on whether the increased use of biologic agents affected overall infection risk among patients with RA. A study on patients with incident RA in Minnesota reported a decline in the rate of serious infections from 9.6 per 100 person-year in the 1955–1994 cohort to 6.6 per 100 person-year in the 1995–2007 cohort (3). The rate of infections during treatment with biologic agents was 8.2 per 100 person-year, compared with 6.4 per 100 person-year for those without, but this difference did not reach statistical significance. Due to the limited number of subjects on biologic agents (N= 96), a definitive conclusion on any difference in the rate of serious infections with the use of biologic could not be made.
The infection risk concern has been raised among general population as well. A report suggests that the incidence of sepsis has been increasing steadily for the past several decades (4). For example, data from the Nationwide Inpatient Sample (NIS) suggested a doubling of sepsis rates in the United States from 2003 to 2009 (4). The increase is attributed to aging population, increased use of immunosuppression medications and invasive procedures, and spread of multidrug-resistant pathogens. However, other reports suggest some of the observed increase in incidence is due to changes in documentation and coding practices rather than true increases in disease frequency (5, 6).
With the increasing use of biologic agents on the basis of the treat-to-target strategy for RA, an accurate understanding of trends in infectious complications among patients with RA has critical public health and policy implications. The objective of this study was to investigate the national trends in hospitalization for infections in US patients with RA.
METHODS
Study design and data source
We conducted a cross-sectional analysis of data from the 1993 to 2013 NIS, a component of the Healthcare Cost and Utilization Project (HCUP), sponsored by the Agency for Healthcare Research and Quality (7). The NIS data were subject to a data use agreement. This study was exempt from Institutional Review Board.
Identification of RA hospitalizations
We identified all hospitalized adults aged ≥18 years, who had an ICD-9-CM discharge code for RA (714.xx) in any secondary diagnosis fields. We evaluated 5 infections as the primary diagnosis, which included pneumonia (003.22, 481.0, 513.0, 480, 482, 483, 485, 486), sepsis/bacteremia (hereafter, sepsis; 038, 790.7), urinary tract infection (UTI; 590), skin and soft tissue infections (SSTI; 040.0, 569.61, 681, 682, 785.4, 728.86, 035), and opportunistic infections (OIs). Hospitalizations due to OIs included tuberculosis (010–018), nontuberculous mycobacteria (031), cytomegalovirus (078.5), Epstein-Barr virus (075), herpes zoster (053), candidiasis (112.4, 112.5, 112.81, 112.83), toxoplasmosis (130), pneumocystosis (136.3), cryptococcosis (117.5), listeriosis (027.0), nocardiosis (039), aspergillosis (117.3), coccidioidomycosis (114), histoplasmosis (115), and blastomycosis (116.0).
Statistical Analysis
The primary outcome was the proportion of hospitalizations for each infection, among all hospitalizations with a secondary diagnosis of RA, which was calculated by dividing the number of hospitalizations due to infections with any secondary diagnosis of RA by the number of any hospitalizations with a secondary diagnosis of RA. For sensitivity analysis, we calculated the proportion of hospitalizations for each infection by dividing the number of hospitalizations with a primary diagnosis of RA and a secondary diagnosis of infection as well as a primary diagnosis of infection and a secondary diagnosis RA by the number of hospitalizations with all primary diagnosis of RA and all secondary diagnosis of RA. We considered the proportion of myocardial infarction (MI) hospitalizations among RA as a control condition, since reports suggested that cardiovascular disease in RA is decreasing (8). The secondary outcome was the incidence of each infection among RA patients by year, using an estimate of the national adult RA population as 1% of the adult US census population (calculated as the number of hospitalizations due to infections with any secondary diagnosis of RA divided by 1% of the adult US census population). US adults without RA were considered as a comparator group. In a secondary analysis, we calculated the incidence of each infection among RA patients in 1995 and 2007, using estimated RA trend based on the 1995–2007 incidence cohort in Minnesota, where they provided the prevalence of RA in adults was 0.62% and 0.72% in 1995 and 2005, respectively (9). Assuming a similar linear trend over the study period for RA prevalence, we calculated the national RA prevalence in adults as 0.60% and 0.80% in 1993 and 2013, respectively. Finally, we calculated in-hospital mortality, defined as the proportion of hospitalizations ending in death for each type of serious infection among RA patients. We examined the trends in the outcomes from 1993–2013 using the Cochran-Armitage Trend Test in SAS version 9.3.
RESULTS
Patient Characteristics
The population characteristics of adults with RA are shown in Table 1. Most were female. The average age was about 60 throughout the study period.
Table 1.
Characteristics of patients with RA hospitalized with infection and other causes from 1993 to 2013
| 1993 | 1994 | 1995 | 1996 | 1997 | 1998 | 1999 | 2000 | 2001 | 2002 | 2003 | 2004 | 2005 | 2006 | 2007 | 2008 | 2009 | 2010 | 2011 | 2012 | 2013 | P-value | |
|---|---|---|---|---|---|---|---|---|---|---|---|---|---|---|---|---|---|---|---|---|---|---|
| Hospitalizations with any secondary code of RA (N) | 172,956 | 189,460 | 206,905 | 217,094 | 225,580 | 232,618 | 246,706 | 257,676 | 275,265 | 287,715 | 305,197 | 319,614 | 338,659 | 356,939 | 370,924 | 415,144 | 434,998 | 453,271 | 505,703 | 498,510 | 501,400 | |
| Hospitalizations with any secondary code of RA (per 100,000 persons) | 90 | 97 | 105 | 109 | 112 | 114 | 119 | 123 | 130 | 134 | 141 | 146 | 153 | 159 | 163 | 181 | 187 | 193 | 213 | 207 | 206 | |
| Patient characteristics | ||||||||||||||||||||||
| Age, yr (mean [SD]) | 61 (0.29) | 61 (0.33) | 62 (0.30) | 62 (0.32) | 62 (0.33) | 62 (0.34) | 61 (0.36) | 61 (0.34) | 61 (0.36) | 61 (0.34) | 60 (0.35) | 61 (0.33) | 61 (0.33) | 60 (0.41) | 60 (0.38) | 60 (0.35) | 60 (0.40) | 60 (0.44) | 60 (0.44) | 61 (0.34) | 61 (0.38) | |
| Sex, female (% [SD]) | 79.6 (0.7) | 80.5 (0.7) | 79.1 (0.7) | 77.7 (0.7) | 77.7 (0.7) | 78.2 (0.8) | 77.8 (0.8) | 77.9 (0.8) | 78.3 (0.8) | 78.2 (0.9) | 77.8 (0.8) | 79.1 (0.8) | 77.9 (0.8) | 78.3 (0.9) | 77.9 (0.9) | 77.2 (0.9) | 77.7 (1.0) | 77.6 (0.9) | 78.0 (0.9) | 77.0 (0.9) | 76.8 (1.0) | |
| Hospitalizations due to infections or major diseases with any secondary code of RA (N) | ||||||||||||||||||||||
| Pneumonia | 9,295 | 10,340 | 12,241 | 12,930 | 13,919 | 14,693 | 16,440 | 16,070 | 16,368 | 17,275 | 19,292 | 17,564 | 21,131 | 19,450 | 19,655 | 21,045 | 21,846 | 22,332 | 24,192 | 23,745 | 23,285 | |
| SSTI | 3,901 | 3,562 | 3,987 | 4,335 | 4,257 | 4,189 | 4,937 | 5,074 | 6,186 | 6,185 | 7,150 | 7,481 | 8,099 | 8,664 | 8,896 | 10,014 | 10,795 | 10,990 | 13,197 | 12,845 | 12,720 | |
| UTI | 720 | 801 | 916 | 870 | 863 | 959 | 1,012 | 1,016 | 1,127 | 1,105 | 1,411 | 1,731 | 1,558 | 1,586 | 1,594 | 1,659 | 1,686 | 1,822 | 2,076 | 2,060 | 1,925 | |
| OIs | 753 | 714 | 761 | 790 | 861 | 765 | 878 | 844 | 815 | 778 | 1,040 | 1,050 | 1,055 | 1,057 | 1,175 | 1,184 | 1,257 | 1,348 | 1,463 | 1,520 | 1,325 | |
| Sepsis | 3,318 | 3,760 | 4,854 | 5,066 | 5,566 | 4,964 | 4,776 | 4,287 | 4,818 | 4,727 | 5,694 | 5,857 | 6,830 | 8,179 | 9,282 | 12,858 | 16,014 | 18,283 | 23,966 | 27,090 | 32,230 | |
| CHF | 7,280 | 8,544 | 9,194 | 9,897 | 10,054 | 10,348 | 11,622 | 11,613 | 11,487 | 11,678 | 12,466 | 12,541 | 12,520 | 12,817 | 12,627 | 13,668 | 15,025 | 14,791 | 17,456 | 17,110 | 16,715 | |
| MI | 3,861 | 4,663 | 5,323 | 5,775 | 5,820 | 6,857 | 6,978 | 7,309 | 6,724 | 7,125 | 7,217 | 6,874 | 6,996 | 7,317 | 6,975 | 7,666 | 7,984 | 8,062 | 8,467 | 9,350 | 9,265 | |
| COPD | 3,552 | 4,493 | 5,067 | 5,607 | 5,674 | 6,603 | 7,624 | 7,602 | 7,331 | 7,534 | 7,781 | 7,303 | 9,168 | 8,624 | 8,801 | 11,971 | 12,520 | 12,997 | 14,276 | 14,935 | 14,335 | |
| Proportion of hospitalizations (%) | ||||||||||||||||||||||
| Pneumonia | 5.4 | 5.5 | 5.9 | 6.0 | 6.2 | 6.3 | 6.7 | 6.2 | 5.9 | 6.0 | 6.3 | 5.5 | 6.2 | 5.4 | 5.3 | 5.1 | 5.0 | 4.9 | 4.8 | 4.8 | 4.6 | <0.001 |
| SSTI | 2.3 | 1.9 | 1.9 | 2.0 | 1.9 | 1.8 | 2.0 | 2.0 | 2.2 | 2.1 | 2.3 | 2.3 | 2.4 | 2.4 | 2.4 | 2.4 | 2.5 | 2.4 | 2.6 | 2.6 | 2.5 | <0.001 |
| UTI | 0.42 | 0.42 | 0.44 | 0.40 | 0.38 | 0.41 | 0.41 | 0.39 | 0.41 | 0.38 | 0.46 | 0.54 | 0.46 | 0.44 | 0.43 | 0.40 | 0.39 | 0.40 | 0.41 | 0.41 | 0.38 | 0.04 |
| OIs | 0.44 | 0.38 | 0.37 | 0.36 | 0.38 | 0.33 | 0.36 | 0.33 | 0.30 | 0.27 | 0.34 | 0.33 | 0.31 | 0.30 | 0.32 | 0.29 | 0.29 | 0.30 | 0.29 | 0.30 | 0.26 | <0.001 |
| Sepsis | 1.9 | 2.0 | 2.3 | 2.3 | 2.5 | 2.1 | 1.9 | 1.7 | 1.8 | 1.6 | 1.9 | 1.8 | 2.0 | 2.3 | 2.5 | 3.1 | 3.7 | 4.0 | 4.7 | 5.4 | 6.4 | <0.001 |
| Incidence using RA population 1% (%) | ||||||||||||||||||||||
| Pneumonia | 0.48 | 0.53 | 0.62 | 0.65 | 0.69 | 0.72 | 0.79 | 0.77 | 0.77 | 0.80 | 0.89 | 0.80 | 0.95 | 0.87 | 0.87 | 0.92 | 0.94 | 0.95 | 1.02 | 0.99 | 0.96 | <0.001 |
| SSTI | 0.20 | 0.18 | 0.20 | 0.22 | 0.21 | 0.20 | 0.24 | 0.24 | 0.29 | 0.29 | 0.33 | 0.34 | 0.36 | 0.39 | 0.39 | 0.44 | 0.46 | 0.47 | 0.55 | 0.53 | 0.52 | <0.001 |
| UTI | 0.037 | 0.041 | 0.047 | 0.044 | 0.043 | 0.047 | 0.049 | 0.048 | 0.053 | 0.051 | 0.065 | 0.079 | 0.070 | 0.071 | 0.070 | 0.072 | 0.072 | 0.077 | 0.087 | 0.086 | 0.079 | <0.001 |
| OIs | 0.039 | 0.037 | 0.039 | 0.040 | 0.043 | 0.037 | 0.042 | 0.040 | 0.038 | 0.036 | 0.048 | 0.048 | 0.048 | 0.047 | 0.052 | 0.051 | 0.054 | 0.057 | 0.062 | 0.063 | 0.055 | <0.001 |
| Sepsis | 0.17 | 0.19 | 0.25 | 0.25 | 0.28 | 0.24 | 0.23 | 0.20 | 0.23 | 0.22 | 0.26 | 0.27 | 0.31 | 0.36 | 0.41 | 0.56 | 0.69 | 0.78 | 1.01 | 1.13 | 1.33 | <0.001 |
| Incidence using the trend in RA prevalence from Myasoedova et al. (%) | ||||||||||||||||||||||
| Pneumonia | 0.81 | 0.87 | 1.00 | 1.03 | 1.08 | 1.11 | 1.20 | 1.14 | 1.13 | 1.17 | 1.27 | 1.13 | 1.32 | 1.19 | 1.17 | 1.22 | 1.24 | 1.23 | 1.30 | 1.25 | 1.20 | |
| SSTI | 0.34 | 0.30 | 0.33 | 0.35 | 0.33 | 0.32 | 0.36 | 0.36 | 0.43 | 0.42 | 0.47 | 0.48 | 0.51 | 0.53 | 0.53 | 0.58 | 0.61 | 0.61 | 0.71 | 0.68 | 0.65 | |
| UTI | 0.062 | 0.068 | 0.075 | 0.069 | 0.067 | 0.072 | 0.074 | 0.072 | 0.078 | 0.075 | 0.093 | 0.11 | 0.10 | 0.10 | 0.09 | 0.10 | 0.10 | 0.10 | 0.11 | 0.11 | 0.10 | |
| OIs | 0.065 | 0.060 | 0.062 | 0.063 | 0.067 | 0.058 | 0.064 | 0.060 | 0.056 | 0.053 | 0.068 | 0.067 | 0.066 | 0.064 | 0.070 | 0.069 | 0.071 | 0.074 | 0.079 | 0.080 | 0.068 | |
| Sepsis | 0.29 | 0.32 | 0.40 | 0.40 | 0.43 | 0.37 | 0.35 | 0.31 | 0.33 | 0.32 | 0.37 | 0.38 | 0.43 | 0.50 | 0.55 | 0.75 | 0.91 | 1.01 | 1.29 | 1.43 | 1.66 |
RA, rheumatoid arthritis; SSTI, skin and soft tissue infection: UTI, urinary tract infection; OIs, opportunistic infections; CHF, congestive heart failure; MI, myocardial infarction; COPD, chronic obstructive pulmonary disease
P-value was calculated using the Cochran-Armitage Trend Test
Hospitalization rates and trends
From 1993 to 2013, there were 792,921 hospitalizations for infection with a secondary diagnosis of RA. The absolute number of hospitalizations with any secondary RA code increased from 172,956 to 501,400 (Table 1). The number of hospitalizations with any secondary RA code increased from 90 to 206 per 100,000 persons (US general population) from 1993–2013.
Over the study period, among RA patients, the absolute number of hospitalizations increased for congestive heart failure (7,280 to 16,715), MI (3,861 to 9,265), and chronic obstructive pulmonary disease (3,552 to 14,335). Hospitalizations with infections also increased for pneumonia (9,295 to 23,285), UTI (720 to 1,925), SSTI (3,901 to 12,720), OIs (753 to 1,325), and sepsis (3,318 to 32,230) (Table 1). The proportion of hospitalizations among RA patients decreased for pneumonia (5.4 % to 4.6 %; p<0.001) and OIs (0.44% to 0.26%; p<0.001). The proportion of hospitalizations for UTI decreased slightly (0.4% to 0.38%: p=0.04). The proportion for SSTI increased slightly (2.3 % to 2.5%; p<0.001), while the proportion of hospitalizations for sepsis more than tripled (1.9% to 6.4%; p<0.001) (Table 1, Figure 1). Consistent with previous reports, the proportion of MI hospitalizations decreased from 2.2 to 1.8%. In sensitivity analysis, including hospitalizations with a primary diagnosis of RA and a secondary diagnosis of infections, there was still a decrease in the proportion of hospitalization for pneumonia (4.8% to 4.6%) and OIs (0.42% to 0.27%). The proportion for UTI was unchanged (0.37% to 0.38%). There was a similar increase in the proportion of hospitalization for SSTI (2.1% to 2.6%) and sepsis (1.7% to 6.4%).
Figure 1.

Proportion of all US RA hospitalizations for infection, stratified by infection type UTI; urinary tract infection, SSTI; skin and soft tissue infections, OI; opportunistic infections
Overall incidence, using the theoretical national RA population as the denominator (estimated as 1% of adult census population over the study period), appeared to increase for all infections: pneumonia (0.48 % to 0.96%, p<0.001), UTI (0.037% to 0.079%, p<0.001), SSTI (0.20% to 0.52%, p<0.001), OIs (0.039% to 0.055%, p<0.001), and sepsis (0.17% to 1.32%, p<0.001) (Table 1, Figure 2). In sensitivity analysis, calculating the national RA population using the trend in RA prevalence from Myasoedova et al., there was still an increase in the rate of all infections, but less prominent: pneumonia (0.80% to 1.20%), UTI (0.062% to 0.099%), SSTI (0.34% to 0.65%), OIs (0.065% to 0.068%), and sepsis (0.29% to 1.66%).
Figure 2.
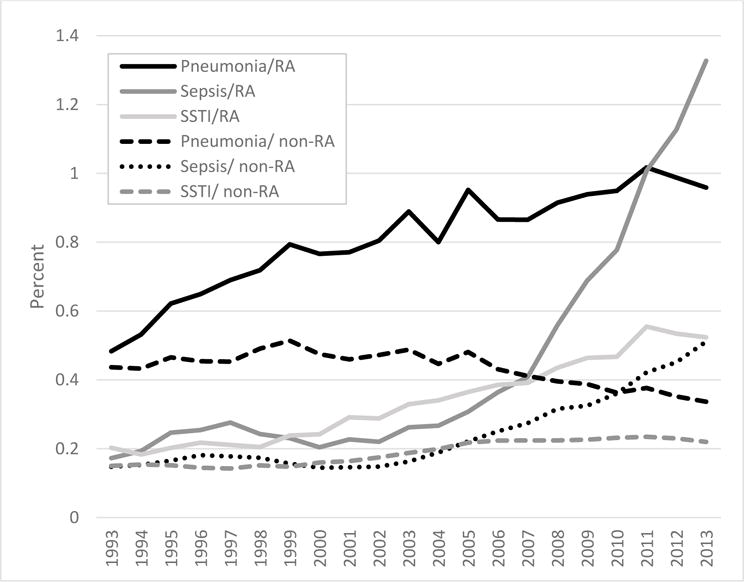
Incidence of hospitalized infection of pneumonia, sepsis, UTI, and SSTI among RA (solid lines) and non-RA (dashed lines), from 1993–2013 National Inpatient Sample UTI; urinary tract infection, SSTI; skin and soft tissue infections
For comparison, in the non-RA population, sepsis more than tripled from 0.15% to 0.51%. The rate for SSTI increased moderately (0.15% to 0.22%). There was a decrease in hospitalizations rate due to the other infections: pneumonia (0.44% to 0.34%), UTI (0.050% to 0.039%), and OIs (0.053% to 0.016%) (Figure 2).
In-hospital mortality rates and trends
The mortality rates in RA decreased as follows: pneumonia (8.96% to 3.39%), OIs (7.35% to 5.28%), and sepsis (13.4% to 10.7%). Data on mortality rates of UTI and SSTIs was not available due to low frequencies in the NIS.
DISCUSSION
In this analysis of a large, nationally representative database for US inpatient hospitalization between 1993 and 2013, the proportion of hospitalizations for infections among RA patients appeared to decline for pneumonia and OIs, with a slight decrease in the proportion of UTI, a slight increase in SSTI, and a marked increase in sepsis. To the best of our knowledge, this is the first report describing national trends in hospitalizations for infection in US patients with RA.
In the past decade, wide adoption of a treat-to-target strategy for RA has led to greater use of conventional DMARDs and biologic agents, and a better control of RA activity. The decline in serious infections in patients with RA may be due to improved disease activity in RA patients. While we could not directly compare disease activity over the study period, a population-based study, involving 16,242 patients from Consortium of Rheumatology Researchers of North America registry, demonstrated an increase in disease activity score (DAS) by 0.6 was associated with a 25% increased rate of hospitalized infections (10).
Another explanation for decreased serious infections in RA patients could be a decline in corticosteroids use, although we could not directly assess its trend in our study. Work from Strangfeld and colleagues suggested that for RA patients, the risk of serious infections decreased over time in biologic users because it allowed decrease in prednisone utilization and/or dosage (11). Further study could assess whether patterns of corticosteroid prescription in RA patients have changed since the introduction of biologic agents.
The proportion of hospitalizations for sepsis in patients with RA more than tripled over the study period (1.9% to 6.4%; p<0.001). While it is possible that sepsis truly increased over the study period, there are several more plausible explanations. First, the sensitivity of sepsis coding has increased over time. A study using patient-level data found that patients with identical risk factors for sepsis, who had similar probability of developing sepsis, had a higher probability of getting a discharge diagnosis for sepsis in administrative data in recent years, compared to preceding years (5). In another study on the accuracy of sepsis coding in administrative data, the sensitivity of sepsis coding doubled during the 5-year study period (6). Another potential explanation is that patients with pneumonia might have been misclassified as sepsis. The decrease in pneumonia hospitalizations coincides with the increase in sepsis hospitalizations supports this theory. A recent study suggested that the proportion of patients with pneumonia, who were identified and coded as sepsis, increased from 2003 to 2009, potentially due to a higher reimbursement rate for sepsis (12). Due to lack of patient-level data in national databases such as the NIS, we were unable to assess whether the apparent increase in sepsis hospitalizations is due to a true increase in sepsis prevalence.
We found the mortality rate with sepsis decreased from 13.4% to 10.7%, suggesting that sepsis attributable fatality did not increase. Possible explanations for the increasing sepsis rate but decreasing sepsis mortality are: (1) an increase in the sensitivity of sepsis coding as demonstrated in other studies (5, 6), (2) a more effective monitoring and treatment of sepsis, and (3) the use of biologic agents in RA may prevent an unregulated host response to serious infection and the development of severe sepsis. First, recent reports suggested that the observed increase in sepsis hospitalizations is partially due to changes in diagnosis and coding practices rather than a true increase in sepsis prevalence (5, 6). Second, a recent meta-analysis reported that severe sepsis mortality decreased from 46.9% in 1991–1995 to 29% in 2006–2009 (13). The authors suggested mortality declines may be due to improvements in earlier antibiotic administration, increased use of early goal directed therapy, improvements in mechanical ventilation strategies or increased intensivist staffing. Third, in animal models, treatment with these agents before sepsis development did improve survival (14). Recently, investigators from Germany examined outcomes of serious infections in 12,000 RA patients who were being treated with biologic or conventional disease-modifying antirheumatic drugs (DMARDs) (15). During follow-up of 5 to 10 years, 1017 serious infections (most commonly pneumonia and bone and joint infections) were reported, 12% of which progressed to sepsis within 30 days. Risks for sepsis and fatal outcomes were significantly lower among patients taking biologic therapies at the time of serious infection than among patients taking conventional DMARDs. This study raises the possibility that, although biologic therapies heighten risk for infection, they nevertheless might reduce the complications or severity of infections that do occur in patients who take these drugs. Further investigation is warranted in other data sets using patient-level data to draw more accurate conclusions about the trend of sepsis in patients with RA.
Although we found the proportion of hospitalizations for infections among RA patients declined for pneumonia, OIs, and UTI, the annual incidence rates increased in all infections using the national RA prevalence as 1% over the study period. The increase was still seen in our sensitivity analysis. We suspect that increasingly accurate documentation of RA in the medical record has resulted in improved administrative coding for RA. We found that hospitalizations with any secondary RA diagnosis significantly increased from 90 to 206 per 100,000 persons over the study period. There has been an overall increase in the number of discharge diagnosis codes among hospitalized patients, which may reflect better documentation and coding and/or increasing prevalence of multiple comorbidities among hospitalized patients.
The present study had some limitations. First, we used an estimate of the national adult RA population as 1% of the adult US census population because there are no published national estimates on the changes in RA prevalence in the US over the study period. However, we found the overall results were unchanged with use of an alternative estimate for the national RA population in our sensitivity analysis. Second, estimates are not standardized for demographic changes over the study period. Third, diagnoses of RA relied on ICD-9-CM codes, which we were unable to perform additional validation study using external clinical, laboratory, or imaging results. Fourth, the NIS does not include medication data, prohibiting further analysis of proportion of patients on immunosuppressive agents such as anti-tumor necrosis factor or corticosteroid.
In conclusion, from 1993–2013, the proportion of hospitalizations for infections among RA patients appeared to decline for pneumonia and OIs. The proportion of hospitalizations for sepsis in patients with RA more than tripled over the study period while the mortality rate from sepsis decreased. Further investigation is warranted in other datasets that contain patient-level data to draw more conclusive estimates on the epidemiology of infections in patients with RA.
Significance and Innovations.
Between 1993 and 2013, the proportion of hospitalizations for infections among rheumatoid arthritis (RA) patients appeared to decline for pneumonia and opportunistic infections, and to be stable for urinary tract infection and skin and soft tissue infections.
The proportion of hospitalizations for sepsis in patients with RA more than tripled (1.9% to 6.4%), but the mortality rate with sepsis decreased from 13.4% to 10.7% over the study period.
Acknowledgments
This work was supported by a research grant from the National Institutes of Health AR069127 and AR047785
References
- 1.Doran MF, Crowson CS, Pond GR, O’Fallon WM, Gabriel SE. Frequency of infection in patients with rheumatoid arthritis compared with controls: A population-based study. Arthritis Rheum. 2002;46:2287–93. doi: 10.1002/art.10524. [DOI] [PubMed] [Google Scholar]
- 2.Yazici Y, Shi N, John A. Utilization of biologic agents in rheumatoid arthritis in the united states: Analysis of prescribing patterns in 16,752 newly diagnosed patients and patients new to biologic therapy. Bull NYU Hosp Jt Dis. 2008;66:77–85. [PubMed] [Google Scholar]
- 3.Ni Mhuircheartaigh OM, Matteson EL, Green AB, Crowson CS. Trends in serious infections in rheumatoid arthritis. J Rheumatol. 2013;40:611–6. doi: 10.3899/jrheum.121075. [DOI] [PMC free article] [PubMed] [Google Scholar]
- 4.Walkey AJ, Lagu T, Lindenauer PK. Trends in sepsis and infection sources in the united states. A population-based study. Ann Am Thorac Soc. 2015;12:216–20. doi: 10.1513/AnnalsATS.201411-498BC. [DOI] [PMC free article] [PubMed] [Google Scholar]
- 5.Jafarzadeh SR, Thomas BS, Marschall J, Fraser VJ, Gill J, Warren DK. Quantifying the improvement in sepsis diagnosis, documentation, and coding: The marginal causal effect of year of hospitalization on sepsis diagnosis. Ann Epidemiol. 2016;26:66–70. doi: 10.1016/j.annepidem.2015.10.008. [DOI] [PMC free article] [PubMed] [Google Scholar]
- 6.Jafarzadeh SR, Thomas BS, Gill J, Fraser VJ, Marschall J, Warren DK. Sepsis surveillance from administrative data in the absence of a perfect verification. Ann Epidemiol. 2016;26:717–722.e1. doi: 10.1016/j.annepidem.2016.08.002. [DOI] [PMC free article] [PubMed] [Google Scholar]
- 7.HCUP nationwide emergency department sample. Healthcare cost and utilization project (HCUP) rockville, MD: Agency for healthcare research and quality; available at: Http://Www.hcup-us.ahrq.gov/nedsoverview.jsp. accessed september 15, 2015. [Google Scholar]
- 8.Lacaille D, Avina-Zubieta JA, Sayre EC, Abrahamowicz M. Improvement in 5-year mortality in incident rheumatoid arthritis compared with the general population-closing the mortality gap. Ann Rheum Dis. 2016 doi: 10.1136/annrheumdis-2016-209562. [DOI] [PMC free article] [PubMed] [Google Scholar]
- 9.Myasoedova E, Crowson CS, Kremers HM, Therneau TM, Gabriel SE. Is the incidence of rheumatoid arthritis rising?: Results from olmsted county, minnesota, 1955–2007. Arthritis Rheum. 2010;62:1576–82. doi: 10.1002/art.27425. [DOI] [PMC free article] [PubMed] [Google Scholar]
- 10.Au K, Reed G, Curtis JR, Kremer JM, Greenberg JD, Strand V, et al. High disease activity is associated with an increased risk of infection in patients with rheumatoid arthritis. Ann Rheum Dis. 2011;70:785–91. doi: 10.1136/ard.2010.128637. [DOI] [PubMed] [Google Scholar]
- 11.Strangfeld A, Eveslage M, Schneider M, Bergerhausen HJ, Klopsch T, Zink A, et al. Treatment benefit or survival of the fittest: What drives the time-dependent decrease in serious infection rates under TNF inhibition and what does this imply for the individual patient? Ann Rheum Dis. 2011;70:1914–20. doi: 10.1136/ard.2011.151043. [DOI] [PMC free article] [PubMed] [Google Scholar]
- 12.Lindenauer PK, Lagu T, Shieh MS, Pekow PS, Rothberg MB. Association of diagnostic coding with trends in hospitalizations and mortality of patients with pneumonia, 2003–2009. JAMA. 2012;307:1405–13. doi: 10.1001/jama.2012.384. [DOI] [PubMed] [Google Scholar]
- 13.Stevenson EK, Rubenstein AR, Radin GT, Wiener RS, Walkey AJ. Two decades of mortality trends among patients with severe sepsis: A comparative meta-analysis*. Crit Care Med. 2014;42:625–31. doi: 10.1097/CCM.0000000000000026. [DOI] [PMC free article] [PubMed] [Google Scholar]
- 14.Tracey KJ, Fong Y, Hesse DG, Manogue KR, Lee AT, Kuo GC, et al. Anti-cachectin/TNF monoclonal antibodies prevent septic shock during lethal bacteraemia. Nature. 1987;330:662–4. doi: 10.1038/330662a0. [DOI] [PubMed] [Google Scholar]
- 15.Richter A, Listing J, Schneider M, Klopsch T, Kapelle A, Kaufmann J, et al. Impact of treatment with biologic DMARDs on the risk of sepsis or mortality after serious infection in patients with rheumatoid arthritis. Ann Rheum Dis. 2016;75:1667–73. doi: 10.1136/annrheumdis-2015-207838. [DOI] [PMC free article] [PubMed] [Google Scholar]