Abstract
Purpose
To demonstrate the potential of imaging cerebral arteries and veins with ferumoxytol using susceptibility weighted imaging (SWI) and quantitative susceptibility mapping (QSM).
Materials and Methods
The relationships between ferumoxytol concentration and the apparent susceptibility at 1.5T, 3T, and 7T were determined using phantom data; the ability of visualizing subvoxel vessels was evaluated using simulations; and the feasibility of using ferumoxytol to enhance the visibility of small vessels was confirmed in three healthy volunteers at 7T(with doses 1 mg/kg to 4 mg/kg). The visualization of the lenticulostriate arteries and the medullary veins was assessed by two raters and the contrast-to-noise ratios (CNRs) of these vessels were measured.
Results
The relationship between ferumoxytol concentration and susceptibility was linear with a slope 13.3 ± 0.2 ppm·mg−1·mL at 7T. Simulations showed that SWI data with an increased dose of ferumoxytol, higher echo time (TE), and higher imaging resolution improved the detection of smaller vessels. With 4 mg/kg ferumoxytol, voxel aspect ratio = 1:8, TE = 10 ms, the diameter of the smallest detectable artery was approximately 50µm. The rating score for arteries was improved from 1.5 ± 0.5 (precontrast) to 3.0 ± 0.0 (post-4 mg/kg) in the in vivo data and the apparent susceptibilities of the arteries (0.65 ± 0.02 ppm at 4 mg/kg) agreed well with the expected susceptibility (0.71 ± 0.05 ppm).
Conclusion
The CNR for cerebral vessels with ferumoxytol can be enhanced using SWI, and the apparent susceptibilities of the arteries can be reliably quantified using QSM. This approach improves the imaging of the entire vascular system outside the capillaries and may be valuable for a variety of neurodegenerative diseases which involve the microvasculature.
The brain consumes one-fifth of the body’s energy and nutrients.1 The cerebrovascular system, in particular the micro-arterial system, plays a key role in delivering oxygen and glucose to brain tissues to meet the high metabolic demand.2 A growing body of evidence in animal and human studies shows that small vessel abnormalities are the source of many neurologic disorders,2–4 including cerebral amyloid angiopathy, ischemia, stroke, and many neurodegenerative and inflammatory diseases (e.g., Alzheimer’s disease, Parkinson’s disease, and multiple sclerosis5). Although the detection of vascular abnormalities has been successful at the macro-level using current MR angiographic (MRA) techniques, efforts to detect micro-cerebrovascular abnormalities in human brain studies have been hampered primarily by a lack of an in vivo imaging technique in which high image resolution (≤100 µm) and vascular contrast can be achieved.6,7
Recent advances in susceptibility weighted imaging (SWI) have dramatically improved the visibility of small veins such as the medullary veins and venules.8–10 In SWI, susceptibility weighting masks are created using high-pass filtered phase images and multiplied into the original magnitude images to enhance the contrast.8,10 In addition, quantitative susceptibility mapping (QSM), which derives the susceptibility distribution from magnetic field variation by solving an inverse problem, makes it possible to evaluate the in vivo susceptibility changes quantitatively.11 Furthermore, the combination of SWI and QSM, the true susceptibility weighted imaging (tSWI), eliminates the orientation dependence in conventional SWI and improves the delineation of the vessels.12,13 However, neither SWI nor QSM is primarily used for in vivo detection of tiny arterioles, where vasculogenic neuropathology often begins.14 The main reason is that there is no susceptibility difference between the arteries and the surrounding tissue.15
Therefore, to make the arteries visible in the same way we see veins, we propose to introduce a susceptibility shift in the vasculature by using an ultra-small superparamagnetic iron oxide (USPIO) contrast agent. USPIO particles have been used as an alternative contrast agent since 1990 to detect inflammatory macrophage activities.16 However, their use as a vascular T2* agent and more specifically as a susceptibility blood pool agent has not been heavily investigated.17,18 Among all the USPIOs, ferumoxytol is most commonly used today as an off-label MRI contrast agent, because it is the only one approved by the U.S. Food and Drug Administration (FDA) for human use (as an iron replacement product) and because it is a blood pool superparamagnetic agent and safe for patients with renal diseases.19
MATERIALS AND METHODS
Data were acquired with a fully flow-compensated three-dimensional (3D) gradient echo SWI sequence for all field strengths assessed (1.5 Tesla [T] Aera, 3T Skyra, and 7T MAGNETOM Siemens scanners, Siemens Healthcare, Erlangen, Germany). The inter-relationship between the imaging parameters, the dose of ferumoxytol (Feraheme, AMAG Pharmaceuticals, Inc. Waltham, MA) and the vessel size were evaluated.
Phantom Studies
To determine the relationship between the apparent susceptibility and the concentration of ferumoxytol at different field strengths, phantom studies were performed first. To prepare the phantom, ferumoxytol solution with a concentration of 30 mg/mL was diluted into 10 different concentrations, varying from 0.01 mg/mL to 0.1 mg/mL. A set of eleven test tubes (one with no ferumoxytol) was then embedded in a gel phantom and scanned at field strengths (B0) of 1.5T, 3T, and 7T, using a multi-echo gradient-echo sequence with a bipolar readout. Twenty-channel, 32-channel, and 24-channel head and neck coils were used for 1.5T, 3T, and 7T acquisitions, respectively. The main field direction was set to be perpendicular to these tubes. The imaging parameters for each field strength are listed in Table 1. For each cylinder, R2* maps were generated using the first few echoes in which the SNR was greater than 3:1, by fitting the magnitude at different TEs to an exponential decay curve. For each pixel, the initial estimate of the R2* was fine-tuned through nonlinear least squares fitting using the Levenberg-Marquardt algorithm.
TABLE 1.
Imaging Parameters in Phantom and In Vivo Studies
| Phantom | Volunteer 1 | Volunteer 2 | Volunteer 3 | |
|---|---|---|---|---|
| Ferumoxytol dose | 0.01 mg/mL to 0.1 mg/mL | 2 mg/kg, 4 mg/kg | 2 mg/kg | 1 mg/kg, 3 mg/kg |
| Field strength (T) | 1.5/3/7 | 7 | 7 | 7 |
| TE (ms) | 5 to 42.8 (8 echoes, echo spacing 5.4 ms) | 8 | 8 | 10 |
| TR (ms) | 50 | 35 | 24 | 24 |
| FA (°) | 20 | 10 | 10 | 10 |
| Voxel size (mm3) | 0.5×0.5×2 | 0.11×0.22×1.25 | 0.13×0.26×0.66 | 0.13×0.26×0.8 |
| Matrix size | 384×324×44 | 2048×1536×88 | 2048×1344×128 | 2048×1216×120 |
| BW/pixel (Hz/pixel) | 450 | 111 | 188 | 244 |
For QSM, the phase images were unwrapped using a multi-echo phase unwrapping algorithm.20 Briefly, the inter-echo phase increments were unwrapped using a 3D best-path phase unwrapping algorithm.21 Next, the linear background phase induced by the eddy-current effects was estimated by fitting a 2D linear function and subsequently removed from both the phase increment images and the original phase images. Finally, the phase images of later echoes were unwrapped using the images of the first echo and the unwrapped phase increments between two neighboring echoes. Then the field variation map (ΔB) was extracted from the unwrapped phase images in the first four echoes through a least squares fitting, weighted by the square of the intensities in the magnitude images. To eliminate the interference of the phase induced by different tubes, for each tube, local field variation (ΔBl) was extracted by removing the background field induced by the global geometry and the other tubes, using the SHARP algorithm.22 To quantify the susceptibilities, the geometries of the tubes were extracted from the magnitude images in the first echo, and the susceptibility of each tube was determined using an iterative forward fitting algorithm,23 by minimizing the following cost function in a region of interest (ROI) outside and within eight pixels to the edge of the cylinder:
| (1) |
where SNRi is proportional to the magnitude of the ith pixel in the shortest echo, ΔBl, i is the local field at the ith pixel, gi is the unit field response at the ith pixel, and χ is the susceptibility of the cylinder. To determine the SNRi, the noise was estimated as the standard deviation of the intensities of all the pixels in the ROI on the magnitude images in the shortest echo. In each iteration step, the mean (µ) and standard deviation (σ) of the residuals of all the pixels in the ROI were measured. Unreliable pixels with significantly high residuals (≥ µ + 2σ or ≤ µ − 2σ) were excluded from the fitting, to reduce the influence of noisy or improperly unwrapped pixels. The iteration was stopped when the relative change in the estimated susceptibility was less than 0.01. The susceptibility of the tube containing pure gel was used as the reference for estimating the susceptibilities of the other tubes.
In addition, to compensate for the under-estimation caused by partial volume effects, the true area of the cross-section of the test tubes (areatrue) was estimated from the one containing pure gel in the 1.5T data. Then the initially estimated susceptibility values were corrected by multiplying a factor of area / areatrue, where area is the area of the cross-section of the extracted geometry of each tube.24 Linear least squares fitting was used to determine the relationships between ferumoxytol concentration and the apparent susceptibility/R2*. One-way analysis of covariance, followed by post hoc multiple comparison with Tukey’s honest significant difference criterion, was used to evaluate the difference between the regression coefficients found at different field strengths. If not specified otherwise, P < 0.05 was considered as statistically significant in this study.
Simulations
With higher concentrations of ferumoxytol, it is expected that the susceptibility of the artery will increase as will its visibility using SWI and QSM. Using simulations, the ability of visualizing subvoxel arteries with different concentrations of ferumoxytol was studied. Magnitude and phase images of 2D cylinders were simulated with B0 = 7T, with TE = 10 ms and 20 ms, FA = 10°, and TR = 24 ms. The dose of ferumoxytol was varied from 0.1 mg/kg to 4 mg/kg, with a step size 0.1 mg/kg. The body weight was assumed to be 60 kg and the blood volume 4700 mL. The main field direction was set to be perpendicular to the long axis of the cylinder. The regions inside and outside the cylinder were assumed to be arterial blood and white matter, respectively. The susceptibility and the T2* of the blood with a certain ferumoxytol concentration were predicted using the relationships found from phantom studies, while the T1 was calculated using the relationship found from literature.25 Subvoxel cylinders were simulated by first creating high resolution data and then cropping the center of k-space, and the radii of the cylinders in the final magnitude and phase images ranged from 0.02 to 0.625 pixels.
Additionally, four voxel aspect ratios (in-plane to through-plane) were simulated, including 1:1, 1:2, 1:4, and 1:8, by collapsing the complex data. Each simulation setting was repeated 10 times with Gaussian noise added, such that the SNR in the magnitude was 10:1 (this matches the SNR measured from the in vivo data collected on Volunteer 3, see Table 1 for the imaging parameters). For generating conventional SWI data, the susceptibility weighting masks were generated using the simulated phase images; for generating tSWI data, susceptibility weighting masks were created using QSM data and multiplied into the magnitude images, following the procedures described in Liu et al12; while for QSM, a truncated k-space division algorithm was used.11 The contrast-to-noise ratios (CNRs) of the cylinder in magnitude, phase, SWI, tSWI, and QSM were measured as
| (2) |
where sin and sout are the signal intensities inside and outside the cylinders, and σout is the noise in the background. Then the CNRs were averaged over the 10 independent repetitions. Assuming that the CNR must be at least 3:1 for an artery to be detectable, according to the Rose criterion,26 the minimum diameters of the arteries detected using different types of images were determined for each ferumoxytol concentration.
In Vivo Studies
In vivo data were collected on three healthy volunteers (all female, Volunteer 1: 28 years old, Volunteer 2: 59 years old, Volunteer 3: 29 years old) on the 7T Siemens scanner (maximum gradient strength 72 mT/m) equipped with a 24-channel head and neck coil. This study was approved by the institutional review board and written informed consent was obtained from each volunteer. To determine the optimal combination of imaging parameters and ferumoxytol dose, a range of imaging parameters and ferumoxytol doses were tested, as shown in Table 1. Ferumoxytol was injected manually through an intravenous cubital line followed by a saline flush. For Volunteer 1, a first dose of 2 mg/kg was administered, followed by a second dose of 2 mg/kg; for Volunteer 2, only one dose of 2 mg/kg was administered; while for Volunteer 3, the first dose was 1 mg/kg and the second dose was 2 mg/kg. Such an arrangement was to fully characterize the low dose variations. Each dose of ferumoxytol was administered over 2 min, and data were acquired after the administration of each dose.
The magnitude and phase images from individual channels were combined using the Echo Center Correction (ECC) algorithm,10 to eliminate singularities/cusp artifacts in the combined phase images. For generating SWI data, the original phase images were processed using a homodyne high-pass filter with a k-space window size of 64 × 64.8 For generating QSM data, the original phase images were unwrapped using Laplacian unwrapping11 and the background phase was removed using SHARP.22 Susceptibility maps were created using the iterative susceptibility weighted imaging and mapping (iterative SWIM) algorithm.27 Specifically, an initial susceptibility map was generated using truncated k-space division with a k-space threshold of 0.15. Vessel masks were then extracted from the initial susceptibility map, using thresholding together with morphological operations, and were used as constraints to update the singularity regions in k-space to reduce the streaking artifacts surrounding the vessels.
For each subject, the susceptibilities of the anterior cerebral artery (ACA) and the internal cerebral vein (ICV) were measured from the precontrast and the post-ferumoxytol QSM data. Next, tSWI data were generated using the QSM data.12 For Volunteer 3, ΔR2* maps were generated using the magnitude images in the precontrast and the post-3 mg/kg ferumoxytol data, which were coregistered using FLIRT in FSL.28,29 The quality of visualization of the cerebral arteries and veins was assessed by two raters independently on a four-point scale: 0 (not visible), 1 (barely visible), 2 (visible), and 3 (clearly visible). Particularly, two regions showing the lenticulostriate arteries and the medullary veins were selected from each subject’s data for visual rating, from the maximum intensity projection (MIP) of the original magnitude images, minimum intensity projection (mIP) of the SWI and tSWI images, as well as the MIP of the QSM images.
For assessing the lenticulostriate arteries, the original data were interpolated to isotropic resolution and the maximum/minimum intensity projections were created in the coronal view, with effective slice thickness being 12 mm. The inter-rater agreement was evaluated using quadratic weighted Cohen’s kappa, and the difference between the scores of SWI, tSWI, and QSM was studied using Friedman’s test. Additionally, the CNRs of the pixels inside lenticulostriate arteries and the medullary veins were measured in the same regions where the visual assessment was performed. The images in the pre- and post-ferumoxytol data were coregistered based on the SWI data, using a rigid body registration algorithm in MATLAB (R2016b, MathWorks, Natick, MA). The regions of interest inside and outside the vessels were determined by thresholding the postcontrast SWI, tSWI, and QSM data with the highest dose of ferumoxytol, for each subject. For comparison, the CNRs were also measured from the MIPs (or mIPs) of the precontrast magnitude images for the lenticulostriate arteries (or the medullary veins), and from the mIP of the post-ferumoxytol magnitude images.
RESULTS
Phantom Studies
The relationships between the ferumoxytol concentration and the apparent susceptibilities (χ) are shown in Figure 1. Linear relationships were observed at each field strength. It was found that:
| (3) |
where the units were ppm·mg−1·mL for the slopes, mg·mL−1 for the ferumoxytol concentrations ([cFe]) and ppm for the susceptibility. Note that the data points corresponding to ferumoxytol concentration of 0.09 mg/mL were identified as outliers based on the studentized residual, and were excluded from the linear fitting. The relationship found at 3T agrees well with that reported in an earlier study.30 These results also support the presence of a saturation effect as evidenced by the apparent change in susceptibilities as the main field strength (B0) increased (Fig. 1a) and the fact that the product of field strength times susceptibility remained constant for each ferumoxytol concentration (Fig. 1b). The measured R2* values also correlated linearly with the ferumoxytol concentration (Fig. 1c), specifically:
| (4) |
where the units are s−1·mg−1·mL) for the slopes and s−1 for R2*. It was found that the slope at 7T was significantly different from those at 1.5T (P = 0.03) and 3T (P = 0.01), but no significant difference was observed between the slopes at 1.5T and 3T (P = 0.93).
FIGURE 1.
The apparent susceptibilities (a), the products of apparent susceptibility and field strength (b), and R2* (c) of different ferumoxytol concentrations measured at different field strengths. While the linear relationships determined from a and c can be used to calculate the expected susceptibility and R2* for a given ferumoxytol concentration, the almost constant products of apparent susceptibility and field strength for a certain ferumoxytol concentration in b demonstrate the magnetization saturation of ferumoxytol.
Simulations
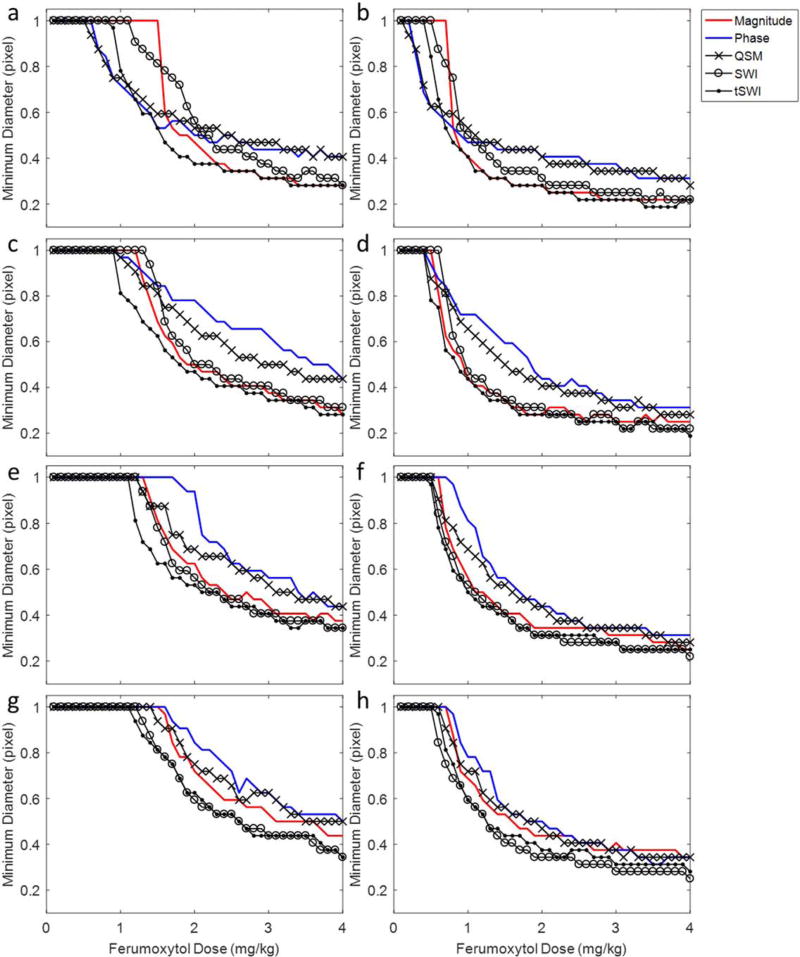
Figure 2 shows the minimum diameters of the detectable arteries with different ferumoxytol concentrations on different types of images. An increased dose of ferumoxytol, higher TE, as well as thinner slices allowed for the detection of smaller arteries. For a voxel aspect ratio of 1:4 or 1:8, smaller arteries were detected using SWI and tSWI than using other types of images; while for isotropic resolution, the detection power of SWI decreased, because of its use of phase information which is orientation dependent. However, tSWI remained one of the best images to be used for detecting small vessels at different ferumoxytol doses. Specifically, at TE = 10 ms, a voxel aspect ratio = 1:1, arteries with diameter less than half pixel (approximately 40 µm in the simulation) can be detected using tSWI, with 4 mg/kg ferumoxytol. When the voxel aspect ratio changed to 1:8, the diameter of the smallest artery detected using SWI and tSWI was approximately 50 µm with 4 mg/kg ferumoxytol. Figure 2 also shows that using the original phase (blue lines) and QSM images (crossed black lines) alone might not be better than using the magnitude images (red lines) for detecting small vessels, especially for high dose of ferumoxytol with low image resolution.
FIGURE 2.
The minimum diameters of the detectable subvoxel arteries on different types of images in the simulations. The TE was 10 ms in a, c, e, g, and 20 ms in b, d, f, h. The voxel aspect ratio was 1:1 in a and b, 1:2 in c and d, 1:4 in e and f, and 1:8 in g and h. For a detectable artery, it was assumed that the CNR was at least 3:1. An increased dose of ferumoxytol, larger TE, and higher resolution improved the detection of smaller arteries. SWI and tSWI provided better detection of small arteries than the original magnitude and phase images, especially for anisotropic resolutions.
In Vivo Data
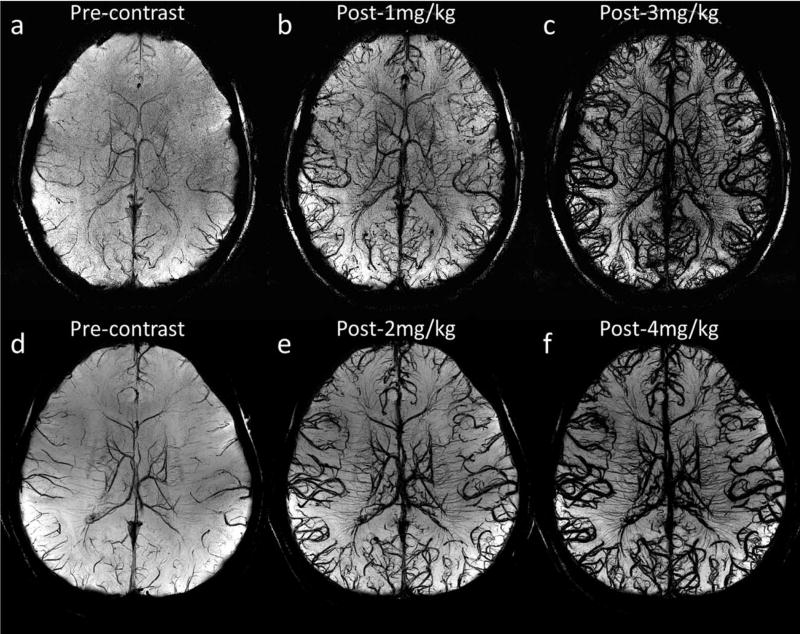
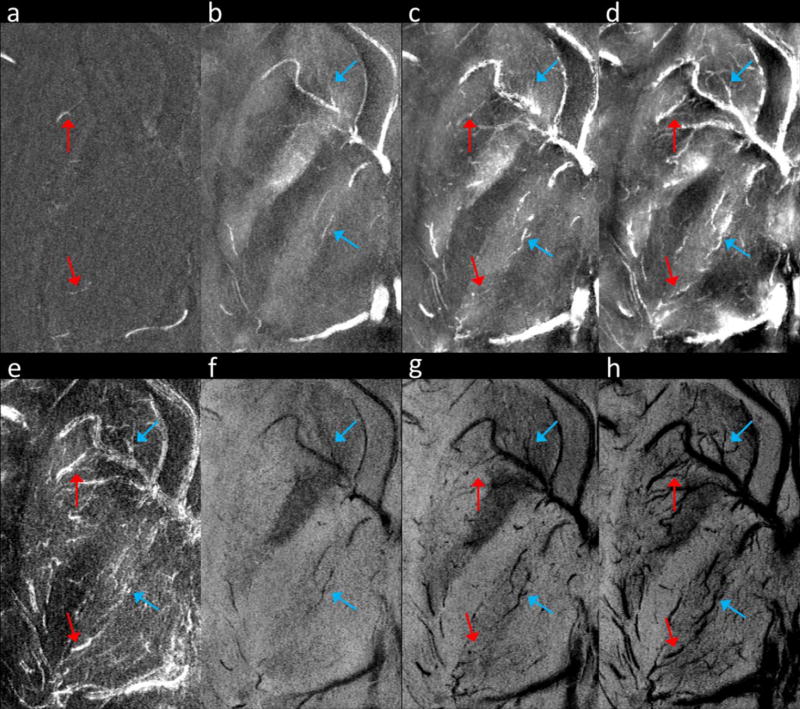
Figure 3 demonstrates the visualization of cerebral arteries and veins using SWI with different doses of ferumoxytol under different imaging parameters, for Volunteers 1 and 3. For both volunteers, a higher dose of ferumoxytol provided better visualization of small arteries and veins. The higher through-plane resolution in Volunteer 3’s data led to a reduction in the SNR, compared with Volunteer 1’s data, yet smaller vessels can be seen even with lower concentrations of ferumoxytol (Fig. 3b versus 3e and 3c versus 3f). As an example, Figure 4 shows two arterioles (red arrows) in the right putamen and right thalamus in Volunteer 3’s data, which can hardly be seen in either the precontrast or the post-1 mg/kg data, but were visible in the post-3 mg/kg data.
FIGURE 3.
Visualization of arteries and veins using minimum intensity projections of SWI with different doses of ferumoxytol. The effective slice thickness is 20 mm for all images. a to c were reconstructed using Volunteer 3’s data with voxel size 0.13 × 0.26 × 0.8 mm3, while d to f were reconstructed using Volunteer 1’s data with voxel size 0.11 × 0.22 × 1.25 mm3. See Table 1 for other imaging parameters for these two volunteers’ data.
FIGURE 4.
Visualization of cerebral arteries and veins in the basal ganglia. (a) MIP of precontrast magnitude images. (b) MIP of precontrast QSM. (c) MIP of post-1 mg/kg QSM. (d) MIP of post-3 mg/kg QSM. (e) MIP of the ΔR2* images. (f) mIP of precontrast SWI. (g) mIP of post-1 mg/kg SWI. (h) mIP of post-3 mg/kg SWI. The precontrast magnitude images were high-pass filtered to enhance the contrast for small arteries, before generating the MIP shown in a. The arteries and veins are indicated by red and blue arrows, respectively. These images were reconstructed using Volunteer 3’s data. The effective slice thickness is 3.2 mm for all the images.
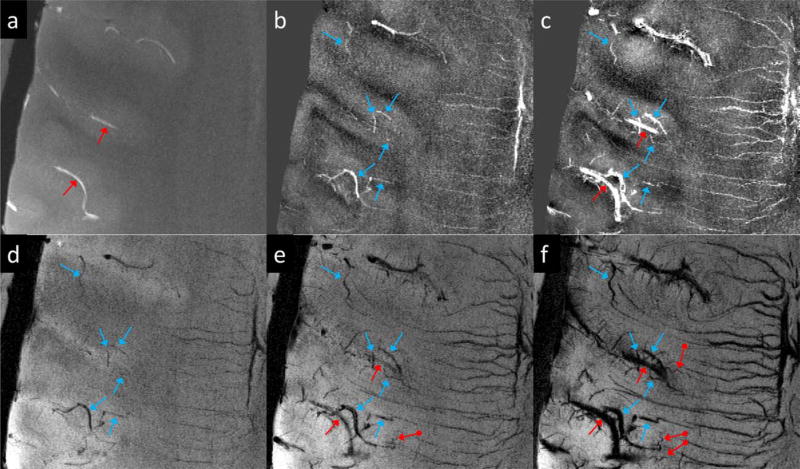
Another example of visualizing cerebral arteries and veins using Volunteer 3’s data is shown in Figure 5, in which the red dot-ended arrows indicate tiny vessels which were not visible in the precontrast or the post-1 mg/kg data. These vessels are very likely cerebral arteries, because of their tortuous shape and the fact that no hypointensities can be observed from the precontrast SWI data.
FIGURE 5.
Visualization of cerebral arteries and veins. (a) MIP of precontrast magnitude image. (b) MIP of precontrast QSM. (c) MIP of post-1 mg/kg QSM. (d) mIP of precontrast SWI. (e) mIP of post-1 mg/kg SWI. (f) mIP of post-3 mg/kg SWI. Arteries and veins are indicated by red and blue arrows, respectively. The vessels indicated by the red dot-ended arrows in e and f are likely arteries. These images were reconstructed using Volunteer 3’s data. The effective slice thickness is 3.2 mm for all the images.
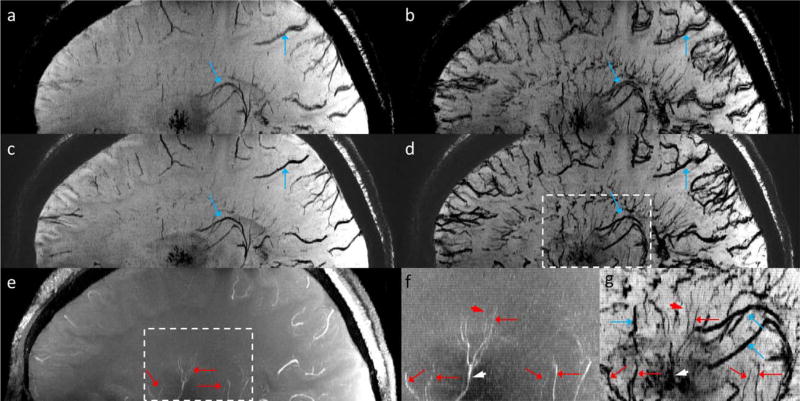
Meanwhile, the CNR of the veins was even better (Figs. 4 and 5). With ferumoxytol, the visibility of both the venules and the deep medullary veins was much improved (Fig. 5). In addition, tSWI may provide more accurate geometries of arteries and veins than conventional SWI, as demonstrated in Figure 6. In the post-2 mg/kg tSWI data, fine structures of the arteries became visible (red arrowheads in Figs. 6f and g), yet for an artery surrounded by structures with high susceptibilities, the CNR of that artery was reduced on SWI and tSWI data (white arrowheads in Figs. 6f and g). The delineation of the small arteries in the post-ferumoxytol data (e.g., lenticulostriate artery and thalamogeniculate artery as indicated by the red arrows in Fig. 6) agrees well with that shown in Salamon.31
FIGURE 6.
(a) mIP of precontrast SWI. (b) mIP of post-2 mg/kg SWI. (c) mIP of precontrast tSWI. (d) mIP of post-2 mg/kg tSWI. (e) MIP of precontrast magnitude images. (f) Enlarged view of the dashed box region in e. (g) enlarged view of the dashed box region in d. The arteries and veins are indicated by red and blue arrows, respectively. The use of ferumoxytol improved the CNR of the arteries and veins and allowed for the visualization of tiny branches of the arteries which were not visible in the precontrast MRA (red arrowheads in f and g). However, the CNR of the vessels in tSWI may be affected by the background tissue (white arrowheads in f and g). These images were reconstructed using Volunteer 2’s data and were interpolated to isotropic resolution for better visualization. The effective slice thickness is 8.25 mm for all the images.
For the image quality assessment, the quadratic weighted Cohen’s kappa was 0.94, suggesting a very good inter-rater agreement. Hence, the scores given by the two raters were averaged (see Supplementary Tables S1 and S2, which are available online, for all the scores). Moreover, no significant difference was found among the scores of SWI, tSWI, and QSM, for both the lenticulostriate arteries (P = 0.49) and the medullary veins (P = 0.54). Consequently, the scores for SWI, tSWI and QSM were also averaged. For the lenticulostriate arteries, the score was 1.5 ± 0.5 (mean ± standard deviation of the three subjects’ scores) for the MIP of original magnitude images (MRA) and 0 for the SWI, tSWI, and QSM in the precontrast data, for all the subjects. With different doses of ferumoxytol, the score of SWI, tSWI, and QSM was increased to 2.3 ± 0.6 (post-1 mg/kg), 2.5 ± 0.5 (post-2 mg/kg), 2.2 ± 0.6 (post-3 mg/kg), 3.0 ± 0.0 (post-4 mg/kg).
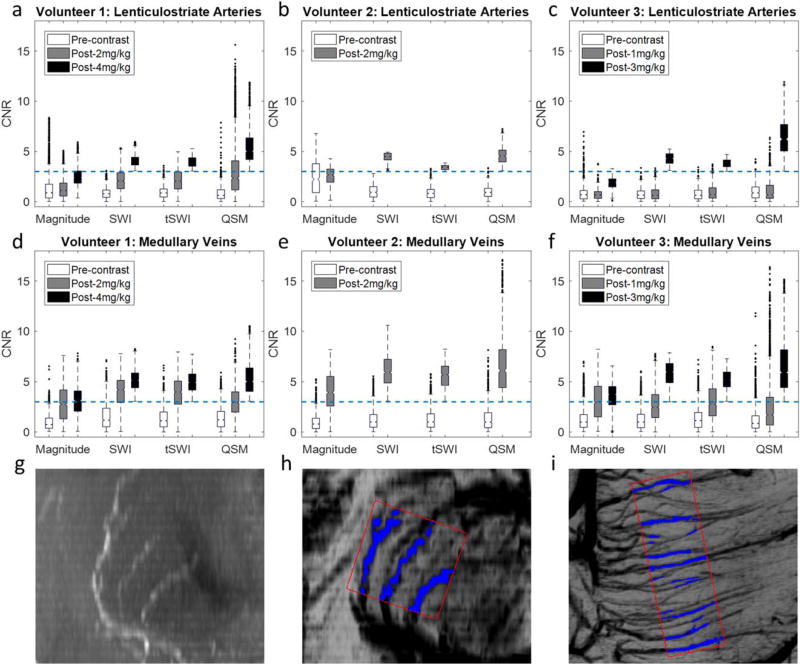
For the medullary veins, the score was 0 for the MRA, and 1.1 ± 0.2 for the SWI, tSWI, and QSM in the precontrast data. With increasing dose of ferumoxytol, the scores for the SWI, tSWI and QSM were increased to 1.8 ± 0.3 (post-1 mg/kg), 2.2 ± 0.4 (post-2 mg/kg), 2.8 ± 0.3 (post-3 mg/kg), and 3.0 ± 0.0 (post-4 mg/kg). This trend agrees with that of the pixelwise CNRs of the selected vessels in different subjects, as illustrated in Figure 7. For the lenticulostriate arteries, the median of the CNR was below 3 in the precontrast magnitude images, and was increased to above 3 only with the highest dose of ferumoxytol in each subject’s data. For the medullary veins, the median of the CNR can be above 3 with 2 mg/kg ferumoxytol (Figs. 7d and e). The CNRs measured from the post-2 mg/kg data in Volunteer 2 were close to the CNRs measured from the post-3 mg/kg data in Volunteer 3 and the post-4 mg/kg data in Volunteer 1, possibly due to the higher through-plane resolution used in Volunteer 2’s data.
FIGURE 7.
Box-plots showing the distributions of the CNRs of pixels inside the lenticulostriate arteries (a–c) and the medullary veins (d–f) for each subject. The dashed blue lines in a to f correspond to CNR = 3. The selection of the pixels inside (blue regions) and outside (red boxes) the vessels was illustrated using Volunteer 1’s data (g–i). (g) MIP of the precontrast magnitude images showing the lenticulostriate arteries in the coronal view. (h) mIP of the post-4 mg/kg SWI data showing the same region as g. (i) mIP of the post-4 mg/kg SWI data showing the medullary veins in the axial view. g and h were generated by first interpolating the original data to isotropic resolution. The effective slice thickness was 12 mm in g to i.
Furthermore, the CNRs in the postcontrast SWI, tSWI, and QSM data were higher than those in the mIP of postcontrast magnitude images, demonstrating the value of these postprocessing techniques. However, there was no improvement in the CNRs of the lenticulostriate arteries in the post-1 mg/kg data, compared with the precontrast magnitude images, and the use of SWI, tSWI, or QSM did not improve the CNR over simple mIP of postcontrast magnitude images. Unlike the simulation results, no significant difference was found in the medians of the CNRs among different postprocessing methods (P = 0.07). However, the pixelwise CNRs on QSM data had wider distributions than on the other types of images, due to the influence of the background tissue and the phase aliasing inside the vessels.
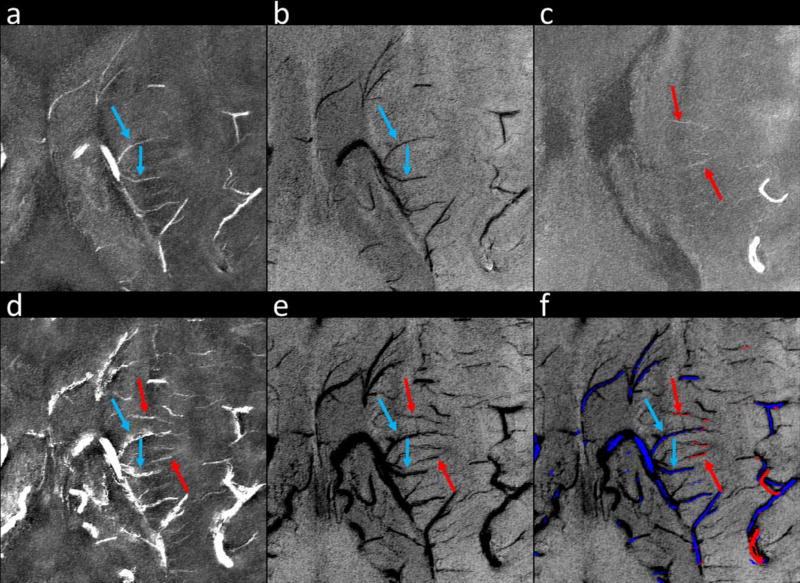
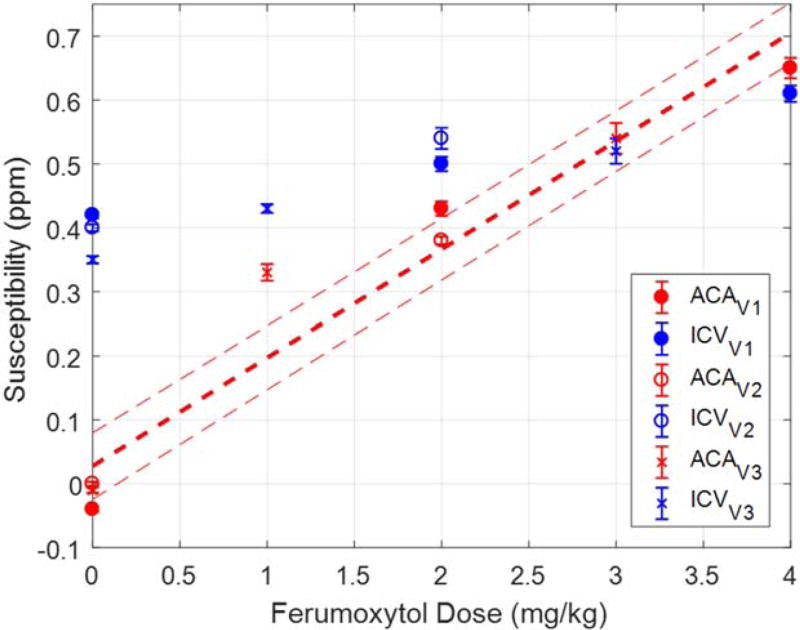
Based on the criteria that arteries have high intensities on precontrast magnitude images, while veins have low intensities on the precontrast SWI data but high intensities on the precontrast QSM data, arteries and veins can be potentially separated in the postcontrast data (Fig. 8). The measured susceptibilities of the ACA and ICV in different volunteers’ data are shown in Figure 9. The measured susceptibilities of the ACA agreed well with the expected susceptibilities (e.g., 0.65 ± 0.02 ppm (measured) versus 0.71 ± 0.05 ppm (expected) with 4 mg/kg ferumoxytol), the measured susceptibilities of the ICV showed significant under-estimations, mainly due to the much higher susceptibilities of the venous blood which caused phase aliasing and increased effective vessel diameter.
FIGURE 8.
Separation of cerebral arteries and veins using QSM, SWI, and MRA. (a) MIP of precontrast QSM. (b) mIP of precontrast SWI. (c) MIP of precontrast magnitude images. (d) MIP of post-2 mg/kg QSM. (e) mIP of post-2 mg/kg SWI. (f) Separation of arteries (red) and veins (blue) using masks generated from precontrast QSM (a), SWI (b), and MRA (c). See the main text for details of generating the vessel masks. Arteries and veins are indicated by red and blue arrows, respectively. These images were reconstructed using Volunteer 2’s data. The effective slice thickness is 3.3 mm for all the images.
FIGURE 9.
The measured susceptibilities of the ACA (red) and the ICV (blue) in the in vivo data. The red dashed lines indicate the expected apparent susceptibilities and the associated prediction intervals at different ferumoxytol doses at 7T, obtained using Eq. (3).
DISCUSSION
We tested the in vivo feasibility of imaging cerebral arteries and veins using ferumoxytol with SWI and QSM at 7T. The use of a USPIO contrast agent such as ferumoxytol, which has strong T1 and T2 shortening effects (r1 = 3.1 mM−1s−1 and r2 = 68 mM−1s−1 at 7T),32 introduces a new means to image arteries with SWI, to increase the signal-to-noise ratio (SNR) of vessels with QSM, and to allow for higher resolution imaging of the microvasculature. Before this, SWI was used predominantly to visualize veins and blood products. Although SWI has found uses in visualizing changes in oxygen saturation in stroke studies, imaging any part of the arterial system using SWI or QSM remains an impossible task, except in the presence of arterial-venous malformations and the presence of venous shunting.33 Adding ferumoxytol to the vascular system now shifts the susceptibility of arteries, giving the arterial system a measurable susceptibility and, therefore, making it visible to both SWI and QSM. The only unknown is the required concentration of ferumoxytol which shifts the susceptibility of the arterial system to that of normal veins, i.e., roughly 500 ppb.
Our results indicate that with ferrumoxytol such a dose is quite low, being around 2.5 mg/kg. This is approximately one-third of the first dose (510 mg) of ferumoxytol used for treating iron deficient anemia.34 As the only approved iron based agent to treat anemia, ferumoxytol has to be administered slowly “as an IV infusion over a minimum of 15 minutes”, instead of “as an undiluted IV injection”, according to the warning statement issued by the FDA.35 In the past year, several review articles have been published discussing the off-label use of ferumoxytol as contrast agent, finding very little evidence of an adverse effect at this low dose.36,37
In this study, we performed both qualitative and quantitative assessment of the CNRs of selected arteries and veins. For the medullary veins, both the visual rating and the CNR measurement showed the same trend of increasing CNRs with higher ferumoxytol doses. For the lenticulostriate arteries, while the visual rating showed that the CNRs were improved at all ferumoxytol doses, the measured CNRs showed no improvement in the post-1 mg/kg data. This is mainly due to partial volume effects, because the CNRs were measured for the same group of pixels selected from the data with the highest ferumoxytol dose. However, the vessels were scored independently in the visual rating, and a high score was given when a sufficient number of pixels with high CNRs were available.
The ability to visualize and to quantify the cerebral arteries and veins is dependent on several factors. First, a higher dose of ferumoxytol is generally associated with better visibility of the vessels. The better visibility of cerebral veins than arteries is partly attributed to the more paramagnetic deoxygenated blood in the veins. However, too high a susceptibility of the vessel causes dephasing of the signal adjacent to the vessel and hampers the ability to maintain the integrity of the object shape. In this case, only the resulting magnetic moment will remain constant.24 The high susceptibility may also cause failures in phase unwrapping and background field removal which will affect the accuracy of phase and QSM, as indicated by both the simulation and in vivo data results.
Second, with a given dose of ferumoxytol, the quality of visualization of small vessels is dependent on the imaging parameters such as TE, imaging resolution, etc. For a given dose of ferumoxytol, while the apparent susceptibility decreases as field strength increases, due to saturation effects, the susceptibility effects are generally proportional to the TE. A long TE may lead to better visualization of the vessels, but may also cause errors in susceptibility quantification. Hence, for the purpose of QSM, a shorter TE should be chosen such that no intra-voxel phase aliasing occurs.11 With higher imaging resolution, the intra-voxel field inhomogeneity will be reduced which leads to less signal decay and reduced blooming effects.38 This may affect the detection of small vessels using magnitude images, but the more reliable phase information at a higher resolution also leads to better QSM. Indeed, while isotropic resolution is preferred when phase or QSM is used, anisotropic resolution may actually enhance the CNR of the vessel on SWI,39 depending on the orientation of the vessel. Although the orientation dependence is avoided in tSWI,12,13 the quality of tSWI can still be affected by phase aliasing and errors in QSM. Hence, the data postprocessing plays a significant role in the visualization and quantification of cerebral arteries and veins.
One unique aspect of imaging the vessels with QSM is that the SNR is related to the susceptibility of the object of interest. If the susceptibility is doubled, in principle the SNR in the QSM images is also doubled. This provides a novel means by which to increase SNR in MRI. Along these lines, one interesting aspect of the saturated iron particles is that the effective susceptibility is higher at lower field strengths, thereby compensating for the loss of SNR at lower fields. This suggests that the use of ferumoxytol should be viable at lower field strengths such as 3T and 1.5T. In addition, the ΔR2* map which reflects the changes in magnitude images caused by ferumoxytol, is a potential tool to study the capillary blood volume fraction. Assuming that the change in R2* is dominated by ΔR2′ induced by feromoxytol, the capillary blood volume fraction (λ) can be calculated using the equation ΔR2′ = λγΔχB0/3,40 where γ is the gyromagnetic ratio, Δχ the susceptibility of the blood and B0 the main field strength. However, the estimation may be affected by motion of the subject between scans and partial volume effects. Moreover, although we found it adequate to use a mono-exponential model for R2* mapping in the phantom studies, a more complex model such as bi-exponential model might be necessary for in vivo studies, when multi-echo data are available.
There are a few limitations in this study. First, only three healthy subjects were included in this study. With these limited number of subjects, we have explored a relatively wide range of imaging parameters and ferumoxytol doses and demonstrated their influences on the CNRs of small arteries and veins. Although there is little overlap in the imaging settings between any two subjects, we have shown the flexibility in selecting imaging parameters for visualization and quantification of small cerebral vessels with ferumoxytol using SWI and QSM. These results provide a guidance on selecting the optimal imaging protocols for future clinical applications using ferumoxytol. Second, all the in vivo studies were performed at 7T. Although there is great potential of imaging small arteries and veins with ferumoxytol at 3T and 1.5T, as discussed above, the in vivo feasibility still needs to be studied in the future.
Third, single-echo sequences were used for in vivo data acquisition. As discussed above, depending on the susceptibility of the vessel, a single-echo phase unwrapping algorithm may fail, due to severe phase aliasing. This may cause errors in the QSM and under-estimations of the susceptibility especially in the veins. In this case, only multi-echo phase unwrapping is able to unwrap the phase properly.11 However, the multi-echo sequence will also dramatically increase the size of the raw data and the time for data postprocessing. Fourth, only the case in which the vessels are surrounded by white matter was studied in simulations, while the effectiveness in visualizing the vessels using SWI, QSM, or tSWI can be dependent on the susceptibility of the surrounding tissue.
Nonetheless, the simulation results provide useful information about the detection limit with certain imaging parameters and ferumoxytol dose, as well as a rough estimate of the size of the vessels. For example, the fact that the artery which was not visible in the post-1 mg/kg data became visible in the post-3 mg/kg data suggests that the size of the artery is in the range of the detection limits with 1 mg/kg and 3 mg/kg feruxmotyol. Finally, the separation of arteries and veins in the post-ferumoxytol SWI and QSM data was done based on the image intensities in the precontrast SWI, QSM, and MRA data. This can be problematic when the artery or vein is not visible in the precontrast data. Possible solutions to this problem include using the connectivity of the pixels as well as the susceptibility difference between arteries and veins with similar size.
In conclusion, we have demonstrated the potential of imaging small arteries using SWI and QSM with ferumoxytol. Using SWI and tSWI, which combine phase or QSM with magnitude images, the CNR for small arteries and veins can be enhanced, which opens the door to imaging the entire vascular system outside the capillaries. Our results suggest that using the highest resolution possible and a dose of 3 to 4 mg/kg of ferumoxytol will create the best CNR for small vessels. This approach may be valuable for a variety of neurodegenerative diseases that involve the microvasculature.
Supplementary Material
Acknowledgments
Contract grant sponsor: the National Institute of Health (NIH); contract grant number: R01 NS076588; R21 CA184682 This work was also performed under the rubric of the Center for Advanced Imaging Innovation and Research (CAI2R, www.cai2r.net), a NIBIB Biomedical Technology Resource Center (NIH P41 EB017183). The contents are solely the responsibility of the authors and do not necessarily represent the official views of the NIH.
Footnotes
Additional supporting information may be found in the online version of this article.
References
- 1.Raichle ME, Gusnard DA. Appraising the brain’s energy budget. Proc Natl Acad Sci U S A. 2002;99:10237–10239. doi: 10.1073/pnas.172399499. [DOI] [PMC free article] [PubMed] [Google Scholar]
- 2.Brown WR, Thore CR. Review: cerebral microvascular pathology in ageing and neurodegeneration. Neuropathol Appl Neurobiol. 2011;37:56–74. doi: 10.1111/j.1365-2990.2010.01139.x. [DOI] [PMC free article] [PubMed] [Google Scholar]
- 3.Gouw AA, Seewann A, van der Flier WM, et al. Heterogeneity of small vessel disease: a systematic review of MRI and histopathology correlations. J Neurol Neurosurg Psychiatry. 2011;82:126–135. doi: 10.1136/jnnp.2009.204685. [DOI] [PubMed] [Google Scholar]
- 4.Dorr A, Sahota B, Chinta LV, et al. Amyloid-β-dependent compromise of microvascular structure and function in a model of Alzheimer’s disease. Brain J Neurol. 2012;135:3039–3050. doi: 10.1093/brain/aws243. [DOI] [PubMed] [Google Scholar]
- 5.Minagar A, Jy W, Jimenez JJ, Alexander JS. Multiple sclerosis as a vascular disease. Neurol Res. 2006;28:230–235. doi: 10.1179/016164106X98080. [DOI] [PubMed] [Google Scholar]
- 6.Wheaton AJ, Miyazaki M. Non-contrast enhanced MR angiography: physical principles. J Magn Reson Imaging. 2012;36:286–304. doi: 10.1002/jmri.23641. [DOI] [PubMed] [Google Scholar]
- 7.Nowinski WL, Puspitasari F, Volkau I, Orrison WW, Knopp MV. Quantification of the human cerebrovasculature: a 7Tesla and 320-row CT in vivo study. J Comput Assist Tomogr. 2013;37:117–122. doi: 10.1097/RCT.0b013e3182765906. [DOI] [PubMed] [Google Scholar]
- 8.Haacke EM, Xu Y, Cheng YN, Reichenbach JR. Susceptibility weighted imaging (SWI) Magn Reson Med. 2004;52:612–618. doi: 10.1002/mrm.20198. [DOI] [PubMed] [Google Scholar]
- 9.Reichenbach JR, Barth M, Haacke EM, Klarhöfer M, Kaiser WA, Moser E. High-resolution MR venography at 3.0 Tesla. J Comput Assist Tomogr. 2000;24:949–957. doi: 10.1097/00004728-200011000-00023. [DOI] [PubMed] [Google Scholar]
- 10.Liu S, Buch S, Chen Y, et al. Susceptibility-weighted imaging: current status and future directions. NMR Biomed. 2017;30 doi: 10.1002/nbm.3552. [DOI] [PMC free article] [PubMed] [Google Scholar]
- 11.Haacke EM, Liu S, Buch S, Zheng W, Wu D, Ye Y. Quantitative susceptibility mapping: current status and future directions. Magn Reson Imaging. 2015;33:1–25. doi: 10.1016/j.mri.2014.09.004. [DOI] [PubMed] [Google Scholar]
- 12.Liu S, Mok K, Neelavalli J, et al. Improved MR venography using quantitative susceptibility-weighted imaging. J Magn Reson Imaging. 2014;40:698–708. doi: 10.1002/jmri.24413. [DOI] [PMC free article] [PubMed] [Google Scholar]
- 13.Gho S-M, Liu C, Li W, et al. Susceptibility map-weighted imaging (SMWI) for neuroimaging. Magn Reson Med. 2014;72:337–346. doi: 10.1002/mrm.24920. [DOI] [PubMed] [Google Scholar]
- 14.Dósa E, Tuladhar S, Muldoon LL, Hamilton BE, Rooney WD, Neuwelt EA. MRI using ferumoxytol improves the visualization of central nervous system vascular malformations. Stroke. 2011;42:1581–1588. doi: 10.1161/STROKEAHA.110.607994. [DOI] [PMC free article] [PubMed] [Google Scholar]
- 15.Haacke EM, Brown RW, Thompson MR, Venkatesan R. Magnetic resonance imaging: physical principles and sequence design. 1. New York: Wiley-Liss; 1999. p. 766. [Google Scholar]
- 16.Weissleder R, Elizondo G, Wittenberg J, Lee AS, Josephson L, Brady TJ. Ultrasmall superparamagnetic iron oxide: an intravenous contrast agent for assessing lymph nodes with MR imaging. Radiology. 1990;175:494–498. doi: 10.1148/radiology.175.2.2326475. [DOI] [PubMed] [Google Scholar]
- 17.Tourdias T, Roggerone S, Filippi M, et al. Assessment of disease activity in multiple sclerosis phenotypes with combined gadolinium- and superparamagnetic iron oxide-enhanced MR imaging. Radiology. 2012;264:225–233. doi: 10.1148/radiol.12111416. [DOI] [PubMed] [Google Scholar]
- 18.Klohs J, Deistung A, Ielacqua GD, et al. Quantitative assessment of microvasculopathy in arcAβ mice with USPIO-enhanced gradient echo MRI. J Cereb Blood Flow Metab. 2016;36:1614–1624. doi: 10.1177/0271678X15621500. [DOI] [PMC free article] [PubMed] [Google Scholar]
- 19.Li W, Tutton S, Vu AT, et al. First-pass contrast-enhanced magnetic resonance angiography in humans using ferumoxytol, a novel ultra-small superparamagnetic iron oxide (USPIO)-based blood pool agent. J Magn Reson Imaging. 2005;21:46–52. doi: 10.1002/jmri.20235. [DOI] [PubMed] [Google Scholar]
- 20.Feng W, Neelavalli J, Haacke EM. Catalytic multiecho phase unwrapping scheme (CAMPUS) in multiecho gradient echo imaging: removing phase wraps on a voxel-by-voxel basis. Magn Reson Med. 2013;70:117–126. doi: 10.1002/mrm.24457. [DOI] [PubMed] [Google Scholar]
- 21.Abdul-Rahman HS, Gdeisat MA, Burton DR, Lalor MJ, Lilley F, Moore CJ. Fast and robust three-dimensional best path phase unwrapping algorithm. Appl Opt. 2007;46:6623–6635. doi: 10.1364/ao.46.006623. [DOI] [PubMed] [Google Scholar]
- 22.Schweser F, Deistung A, Lehr BW, Reichenbach JR. Quantitative imaging of intrinsic magnetic tissue properties using MRI signal phase: an approach to in vivo brain iron metabolism? Neuroimage. 2011;54:2789–2807. doi: 10.1016/j.neuroimage.2010.10.070. [DOI] [PubMed] [Google Scholar]
- 23.Cheng Y-CN, Neelavalli J, Haacke EM. Limitations of calculating field distributions and magnetic susceptibilities in MRI using a Fourier based method. Phys Med Biol. 2009;54:1169–1189. doi: 10.1088/0031-9155/54/5/005. [DOI] [PMC free article] [PubMed] [Google Scholar]
- 24.Liu S, Neelavalli J, Cheng Y-CN, Tang J, Mark Haacke E. Quantitative susceptibility mapping of small objects using volume constraints. Magn Reson Med. 2013;69:716–723. doi: 10.1002/mrm.24305. [DOI] [PMC free article] [PubMed] [Google Scholar]
- 25.Gharagouzloo CA, McMahon PN, Sridhar S. Quantitative contrast-enhanced MRI with superparamagnetic nanoparticles using ultrashort time-to-echo pulse sequences. Magn Reson Med. 2015;74:431–441. doi: 10.1002/mrm.25426. [DOI] [PMC free article] [PubMed] [Google Scholar]
- 26.Rose A. Vision: human and electronic. New York: Plenum Press; 1973. pp. 1–27. [Google Scholar]
- 27.Tang J, Liu S, Neelavalli J, Cheng YCN, Buch S, Haacke EM. Improving susceptibility mapping using a threshold-based K-space/image domain iterative reconstruction approach. Magn Reson Med. 2013;69:1396–1407. doi: 10.1002/mrm.24384. [DOI] [PMC free article] [PubMed] [Google Scholar]
- 28.Jenkinson M, Smith S. A global optimisation method for robust affine registration of brain images. Med Image Anal. 2001;5:143–156. doi: 10.1016/s1361-8415(01)00036-6. [DOI] [PubMed] [Google Scholar]
- 29.Jenkinson M, Bannister P, Brady M, Smith S. Improved optimization for the robust and accurate linear registration and motion correction of brain images. Neuroimage. 2002;17:825–841. doi: 10.1016/s1053-8119(02)91132-8. [DOI] [PubMed] [Google Scholar]
- 30.Tan H, Liu T, Wu Y, et al. Evaluation of iron content in human cerebral cavernous malformation using quantitative susceptibility mapping. Invest Radiol. 2014;49:498–504. doi: 10.1097/RLI.0000000000000043. [DOI] [PMC free article] [PubMed] [Google Scholar]
- 31.Salamon’s Neuroanatomy and Neurovasculature Web-Atlas Resource [Internet] [Accessed March 26, 2017]; Available at: http://www.radnet.ucla.edu/sections/DINR/Part%2017/Part17B8.htm.
- 32.Wei H, Bruns OT, Kaul MG, et al. Exceedingly small iron oxide nanoparticles as positive MRI contrast agents. Proc Natl Acad Sci U S A. 2017;114:2325–2330. doi: 10.1073/pnas.1620145114. [DOI] [PMC free article] [PubMed] [Google Scholar]
- 33.Mittal S, Wu Z, Neelavalli J, Haacke EM. Susceptibility-weighted imaging: technical aspects and clinical applications, part 2. AJNR Am J Neuroradiol. 2009;30:232–252. doi: 10.3174/ajnr.A1461. [DOI] [PMC free article] [PubMed] [Google Scholar]
- 34.Lu M, Cohen MH, Rieves D, Pazdur R. FDA report: ferumoxytol for intravenous iron therapy in adult patients with chronic kidney disease. Am J Hematol. 2010;85:315–319. doi: 10.1002/ajh.21656. [DOI] [PubMed] [Google Scholar]
- 35.U.S. Food and Drug Administration. FDA Drug Safety Communication: FDA strengthens warnings and changes prescribing instructions to decrease the risk of serious allergic reactions with anemia drug Feraheme (ferumoxytol) [Internet] [Accessed February 25, 2017]; Available at: https://www.fda.gov/Drugs/DrugSafety/ucm440138.htm.
- 36.Vasanawala SS, Nguyen K-L, Hope MD, et al. Safety and technique of ferumoxytol administration for MRI. Magn Reson Med. 2016;75:2107–2111. doi: 10.1002/mrm.26151. [DOI] [PMC free article] [PubMed] [Google Scholar]
- 37.Finn JP, Nguyen K-L, Hu P. Ferumoxytol vs. Gadolinium agents for contrast-enhanced MRI: thoughts on evolving indications, risks, and benefits. J Magn Reson Imaging. 2017 doi: 10.1002/jmri.25580. [DOI] [PMC free article] [PubMed] [Google Scholar]
- 38.Reichenbach JR, Venkatesan R, Yablonskiy DA, Thompson MR, Lai S, Haacke EM. Theory and application of static field inhomogeneity effects in gradient-echo imaging. J Magn Reson Imaging. 1997;7:266–279. doi: 10.1002/jmri.1880070203. [DOI] [PubMed] [Google Scholar]
- 39.Xu Y, Haacke EM. The role of voxel aspect ratio in determining apparent vascular phase behavior in susceptibility weighted imaging. Magn Reson Imaging. 2006;24:155–160. doi: 10.1016/j.mri.2005.10.030. [DOI] [PubMed] [Google Scholar]
- 40.Yablonskiy DA, Haacke EM. Theory of NMR signal behavior in magnetically inhomogeneous tissues: the static dephasing regime. Magn Reson Med. 1994;32:749–763. doi: 10.1002/mrm.1910320610. [DOI] [PubMed] [Google Scholar]
Associated Data
This section collects any data citations, data availability statements, or supplementary materials included in this article.


