Abstract
Iron overload is commonly encountered during the course of aplastic anemia (AA), but no composite animal model has been developed yet, which hinders drug research. In the present study, the optimal dosage and duration of intraperitoneal iron dextran injection for the development of an iron overload model in mice were explored. A composite model of AA was successfully established on the principle of immune-mediated bone marrow failure. Liver volume, peripheral hemogram, bone marrow pathology, serum iron, serum ferritin, pathological iron deposition in multiple organs (liver, bone marrow, spleen), liver hepcidin, and bone morphogenetic protein 6 (BMP6), SMAD family member 4 (SMAD4) and transferrin receptor 2 (TfR2) mRNA expression levels were compared among the normal control, AA, iron overload and composite model groups to validate the composite model, and explore the pathogenesis and features of iron overload in this model. The results indicated marked increases in iron deposits, with significantly increased liver/body weight ratios as well as serum iron and ferritin in the iron overload and composite model groups as compared with the normal control and AA groups (P<0.05). There were marked abnormalities in iron regulation gene expression between the AA and composite model groups, as seen by the significant decrease of hepcidin expression in the liver (P<0.01) that paralleled the changes in BMP6, SMAD4, and TfR2. In summary, a composite mouse model with iron overload and AA was successfully established, and AA was indicated to possibly have a critical role in abnormal iron metabolism, which promoted the development of iron deposits.
Keywords: aplastic anemia, iron overload, mouse, animal model
Introduction
Aplastic anemia (AA) is a common hematologic disease that is characterized by hematopoietic failure of the bone marrow and pancytopenia of the peripheral blood, and patients typically suffer from anemia, infection and hemorrhage (1). It is reported that the incidence of AA is 2/106 per year in western countries, while in China, the rate is nearly triple (~7.4/106); chronic AA comprises almost 80% of AA in China (2). During the clinical practice, it was demonstrated that the majority of patients with AA exhibit iron overload secondary to long-term blood transfusions due to moderate and severe anemia (3). Iron overload and chelation therapy have recently been important areas of research in hematologic diseases, particularly in hematopoietic failure diseases (4,5). Iron chelation therapy has been recommended in AA practice guidelines due to its role in protecting major organs, promoting hematopoiesis, delaying disease progression and improving the quality of life (6). Nevertheless, few drugs are currently used in clinical practice for iron chelation therapy in AA. These drugs may also lead to thrombocytopenia or increase the susceptibility to infection as a side effect (7). Furthermore, some effective drugs that are available are too expensive for some patients in less developed countries, including deferasirox (8–10). Therefore, it is of clinical importance to identify effective and low-cost iron chelation agents and validate their effects. Available models of aplastic anemia or iron overload have been constructed (11–14); however, no animal model of AA complicated with iron overload currently exists, which hinders drug research and development. The present study reports a feasible composite mouse model of AA complicated with iron overload.
Materials and methods
Animals
A total of 64 clean-grade inbred female BALB/c mice (weight, 17–20 g) aged 6–8 weeks, and 5 female DBA/2 mice (weight, 15–20 g) aged 6–14 weeks were provided and fed by the Laboratory Animal Center of Zhejiang Chinese Medical University (Hangzhou, China). Mice were housed using a stocking density of 3–5 mice per cage in a temperature and humidity controlled room (23±1°C, 55±5%) and exposed to a 12-h light/dark cycle. All animals had ad libitum access to normal chow and water. The experiments were performed according to the National Institute of Health Guide for the Care and Use of Laboratory Animals [revised 1996 (11)] and were approved by the Animal Management and Ethics Committee of Zhejiang Chinese Medical University (no. ZSLL-2013-108).
Reagents
The following reagents were used in the present study: Iron dextran (Sigma-Aldrich; Merck KGaA, Darmstadt, Germany); serum iron (SI) detection kit (cat. no. A039-1; Nanjing Jiancheng Bioengineering Institute, Nanjing, China); and serum ferritin (SF) ELISA kit (cat. no. CSB-E05187h; Cusabio Biotech Co., Ltd., Wuhan, China).
Animal grouping and treatments
BALB/c mice were randomly assigned to the following groups: Normal control (group A, n=8), AA (group B, n=8), iron overload (group C, n=24), and composite model (group D, n=24). Furthermore, groups C and D were divided into three subgroups (C1, C2, and C3; and D1, D2 and D3, n=8 respectively), according to the administration frequency and single dose of iron dextran (200 mg/kg/week × 10 weeks, 250 mg/kg/week × 8 weeks or 333 mg/kg/weekx 6 weeks, respectively). Following evaluation of the iron-overload parameters (SI and SF), the best iron-loaded model in Group D was used to develop the composite model of AA.
Duplication of iron-overloaded model
Groups C and D were administered with the corresponding dosages of iron dextran via intraperitoneal injection, whereas groups A and B were administered the equivalent volume of normal saline (NS).
Validation of iron-overloaded model
Following administration of the iron dextran injection, blood samples were collected from the orbital veins of mice in groups C and D for the detection of SI and SF, and for the determination of the optimal iron dextran dosage and cycle for duplication of the iron-overloaded model.
Duplication of the mouse model of AA
Following identifying the optimal iron-overloaded model, the optimal iron-overloaded subgroups of Groups D and B were used for the duplication of the mouse AA model based on previous methods used by the present authors (15). DBA/2 mice were euthanized via cervical dislocation and the thymuses were harvested using aseptic techniques for the preparation of cell suspensions of 5×10⁶ cells/ml. The cells were washed in phosphate buffered saline (PBS) twice and suspended in saline prior to injection. Groups B and D were treated with whole-body irradiation with 60Co 6.0 Gy at 1 Gy/min, after which 0.2 ml prepared cell suspensions was injected into each mouse via the caudal vein within 4 h.
Sample collection
The completion of duplication of the mouse AA model in groups B and D was defined as day 0. Blood was collected from the orbital veins of the mice in the four groups for routine testing on days +10 and +30. Blood, liver, heart, spleen and bilateral femurs were extracted from randomly chosen mice (n=4) from the groups on day +15 following overnight fasting and euthanasia via cervical dislocation.
Detection of peripheral hemogram
Blood tests were performed at the Department of Laboratory Medicine of Zhejiang Provincial Hospital of Traditional Chinese Medicine (Hangzhou, China). Peripheral blood smears were prepared and after Wright-Giemsa staining, peripheral hemogram detection was performed using manual classification and counting protocols (16) under a light microscope (CX31RTSF; Olympus Optical Co., Ltd., Tokyo, Japan) at a magnification of ×400.
Liver/body weight ratio testing
Livers were collected from the mice immediately following euthanasia and washed with NS. They were subsequently wiped dry with filter papers and weighed, and the liver/body weight ratio was calculated.
Pathomorphological observation
For all groups, the liver, spleen, and unilateral femur were fixed in a 10% formalin solution under room temperature within 30 min after collection for 24 h. The femur was decalcified by soaking in 5% nitric acid solution for 7–12 h. All tissues were dehydrated, paraffin-embedded, cut into sections (5-µm-thick), stained at room temperature with hematoxylin and eosin (hematoxylin staining for 5–10 min, and eosin staining for 1–3 min)/iron (prussian blue staining for 20 min and redyed with Sudan red for 1 min), and observed for bone marrow pathomorphology and multiple organ iron deposition under light microscopy with a ×400 magnification.
Detection of SI content
Blood plasma (0.5 ml) was collected for the detection of SI content by absorption spectrophotometry using a microplate reader with the SI detection kit according to the manufacturer's protocol and the following equation using the absorbance of the detection tube (Ad), absorbance of the blank tube (Ab) and the absorbance of the standard tube (As):
Detection of SF
A total of 0.5 ml serum was taken from each group (1.5–2 ml was collected previously) for the detection of SF level using the ELISA kit according to the manufacturer's protocol. Following reaction termination, optical density (OD) values were detected via microplate reader at 450 nm. A standard curve was plotted using CurveExpert Professional software (version 1.4, developed by Daniel G. Hyams, http://s 91928265.onlinehome.us/curveexpert/), and sample concentrations were calculated based on the OD values.
Detection of liver transferrin receptor 2 (TfR2), hepcidin, bone morphogenic protein 6 (BMP6) and SMAD family member 4 (SMAD4) expression levels using reverse transcription-quantitative polymerase chain reaction (RT-qPCR)
Total mRNA was extracted from hepatocytes using the TRIzol (Invitrogen; Thermo Fisher Scientific, Inc., Waltham, MA, USA) one-step method and used for RT. RT was performed using PrimeScript™ RT reagent kit with gDNA Eraser (Takara Biotechnology Co., Ltd., Dalian, China; cat. no. RR047A) in a 20-µl reaction volume. Briefly, 1 µg total RNA from hepatocytes, 2 µl 5X gDNA Eraser Buffer, 1 µl gDNA Eraser and nuclease-free water were mixed well in a total volume of 10 µl and incubated for 2 min at 42°C to eliminate genomic DNA. For the synthesis of cDNA, 4 µl 5X PrimeScript Buffer 2, 1 µl PrimeScript RT Enzyme Mix, 1 µl RT Primer Mix and 4 µl nuclease-free water were susbsequently added, and the reaction mixtures were subjected to the following conditions: 37°C for 15 min, followed by 85°C for 5 sec, held at 4°C and stored at −20°C until qPCR amplification. qPCR was performed using SYBR® Premix Ex TagTM II (Takara Biotechnology Co., Ltd.; cat. no. RR820A) in a 20-µl reaction volume. Each reaction was comprised of 2 µl of the cDNA solution, 10 µl of SYBR® Premix Ex TagTM (2X), 1.6 µl of primers, 0.4 µl of ROX Reference Dye and 6 µl of nuclease-free water. The thermocycling protocol was as follows: 95°C for 30 sec for initial denaturation; 40 cycles of 95°C for 5 sec and 60°C for 30 sec for PCR; and 95°C for 15 sec, 60°C for 30 sec and 95°C for 15 sec for separation. The ΔCq value (Cqtarget genes-Cqreference gene) of each sample was calculated using the relatively quantitative method and 2−ΔΔCq was calculated as follows: ΔΔCq=ΔCqexperimental group-ΔCqcontrol group (17). GAPDH was used as a reference gene and primer sequences are provided in Table I.
Table I.
Primers of Hepcidin, BMP6, SMAD4, TfR2 and GAPDH.
| Gene | Direction | Sequence (5′-3′) | Length (bp) |
|---|---|---|---|
| Hepcidin | F | CTGAGCAGCACCACCTATCTC | 205 |
| R | TGGCTCTAGGCTATGTTTTGC | ||
| BMP6 | F | ATGGCAGGACTGGATCATTGC | 54 |
| R | CCATCACAGTAGTTGGCAGCG | ||
| SMAD4 | F | AGGTGGCCTGATCTACACAAG | 111 |
| R | ACCCGCTCATAGTGATATGGATT | ||
| TfR2 | F | ATTCTCCTTTCTCCCTCTTT | 253 |
| R | GCTGTCCATCTCACTCTCTA | ||
| GAPDH | F | CCTCAAGATTGTCAGCAAT | 141 |
| R | CCATCCACAGTCTTCTGAGT |
BMP6, bone morphogenic protein 6; SMAD 4, SMAD family member 4; TfR2, transferrin receptor 2; F, forward, R, reverse.
Statistical analysis
Data were analyzed using SPSS 17.0 (SPSS, Inc., Chicago, IL, USA). All experiment was repeated in triplicate and data are presented as the mean ± standard error of the mean One way analysis of variance was employed to compare two groups of normally distributed data and followed by a post hoc Newman-Keuls test. P<0.05 was considered to indicate a statistically significant difference.
Results
Comparison of iron loads between iron-overloaded models of different dosage regimens
The results indicated that all iron overload subgroups (C1-C3) had significantly higher SI than the normal control group (164.40±22.44, 151.92±42.58, and 129.56±14.10 vs. 99.70±15.46; C1, P<0.01 vs. control; C2 and C3, P<0.05 vs. control). Group C1 had a significantly higher SI level than Group C3 (P=0.012); however, other inter-group comparisons showed no significant differences. The iron-overloaded group C1 had a significantly higher SF than the normal control group (534.43±114.35 vs. 294.89±43.80; P=0.006), whereas the other iron-overloaded groups were not significantly different from the control group (Fig. 1). As a result, group C1 was selected as the optimal composite model for the establishment of the composite model of AA complicated by iron overload.
Figure 1.
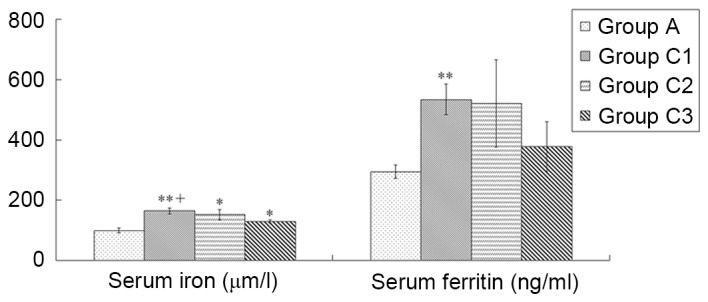
Comparison of iron loads between iron-overloaded models of different dosage regimens. According to the injection frequency and single dose volumes, mice were divided into three iron overload groups (C1-C3), with the administration of iron dextran 200 mg/kg/week for 10 weeks, 250 mg/kg/week for 8 weeks and 333 mg/kg/week for 6 weeks, respectively. Normal controls in group A were administered the equivalent volume of normal saline. Data are presented as the mean ± standard error of the mean (n=8). *P<0.05, **P<0.01 vs. group A; +P<0.01 vs. group C3.
Comparison of peripheral hemograms between groups during establishment of the composite model
A previous report by the present authors (15) indicated that the peripheral hemograms of the immune-mediated AA group peaked at ~day +10. Therefore, in the present study the peripheral hemograms of the AA model were detected at day +10. The results demonstrated that the AA and composite model groups had a significantly lower white blood cell count (WBC), hemoglobin (Hb), red blood cell count (RBC), and platelet count (PLT) compared with the normal control and iron overload groups (all P<0.01), whereas other inter-group comparisons showed no significant differences (Fig. 2).
Figure 2.
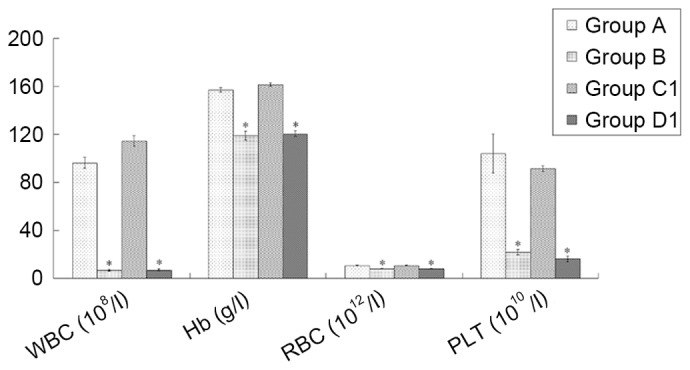
Comparison of peripheral hemograms among groups at 10 days following the establishment of the composite model. The routine blood tests were performed using manual classification and counting protocols. Data are presented as the mean ± standard error of the mean (n=8). *P<0.01 vs. groups A and C1. A, normal control; B, aplastic anemia; C1, iron overload; D1, composite model; WBC, white blood cell count; Hb, hemoglobin; RBC, red blood cell count; PLT, platelet count.
Comparison of liver/body weight ratios between groups
The results showed that the iron overload and composite model groups had significantly higher liver/body weight ratios than the other two groups (all P<0.01, except group C1 vs. A, P<0.05), whereas the ratios were not significantly different between groups A and B or between groups C1 and D1 (Fig. 3; Table II).
Figure 3.
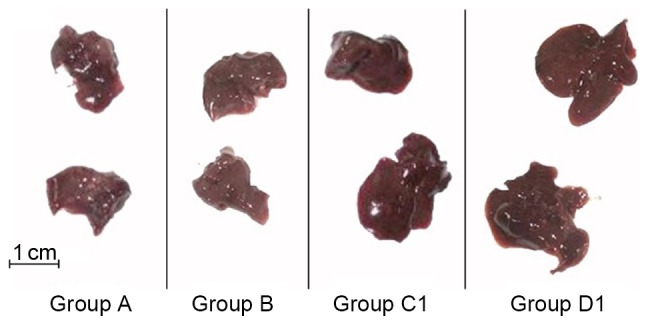
General morphology of spleens in all groups. Larger spleen volumes were observed in groups C1 and D1 compared with groups A and B. A, normal control; B, aplastic anemia; C1, iron overload; D1, composite model.
Table II.
Comparison of liver/body weight ratios among groups.
Data are presented as the mean ± standard error of the mean (n=8).
P<0.05
P<0.01 vs. group A
P<0.01 vs. group B. A, normal control; B, aplastic anemia; C1, iron overload; D1, composite model.
Bone marrow pathology observations
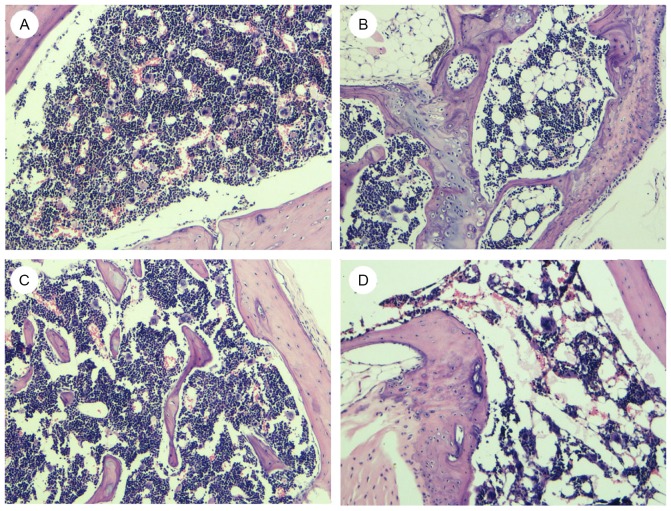
The present results indicated that groups B and D1 had notably poorer bone marrow hyperplasia than groups A and C1, and that the hyperplasia was more marked in group D1. Compared with groups A and C1, groups B and D1 exhibited more fat granules, lower hematopoietic cell ratios and fewer bone marrow megakaryocytes (Fig. 4).
Figure 4.
Morphological changes of bone marrow in (A-D) groups A, B, C1 and D1. Following hematoxylin-eosin staining, samples were observed under a light microscope and images were captured at ×400 magnification. Poorer hyperplasia was observed in group B and D1 as indicated by the increase in number of fat granules, lower hematopoietic cell ratio and fewer marrow megakaryocytes.
Iron staining of multiple organs (liver, bone marrow and spleen)
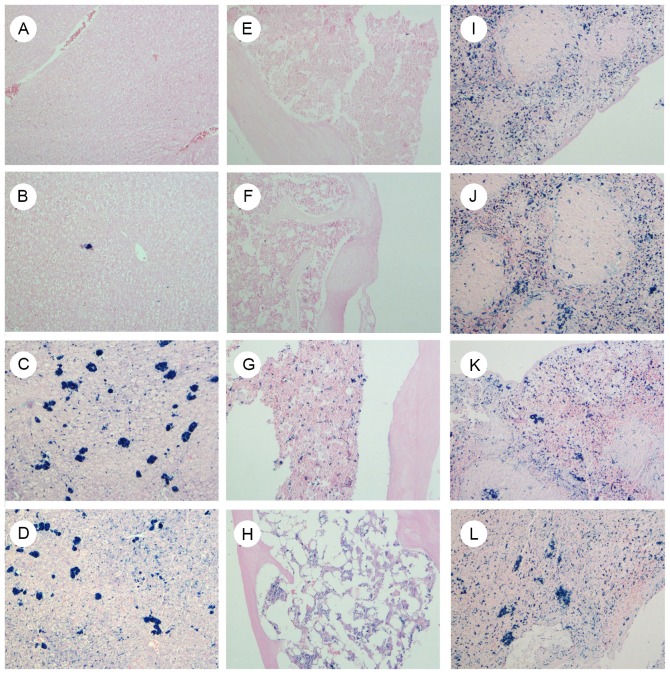
The present results demonstrated that there was no notable iron deposition in the liver (Fig. 5A-D) or bone marrow (Fig. 5E-H) of groups A and B; however, there was marked deposition in the iron-overloaded groups C1 and D1. Iron was not markedly deposited in the spleen even following iron overload (Fig. 5I-L).
Figure 5.
Iron deposition of multiple organs in groups A, B, C1 and D1. Following prussian blue staining, slides were redyed with Sudan red, observed under a light microscope and images were captured at ×400 magnification. Images show (A-D) liver, (E-H) bone marrow and (I-L) spleen tissues in groups A, B, C1 and D1, respectively. Markedly increased iron deposits were observed in liver and bone marrow of groups C1 and D1, but not in groups A and B. A, normal control; B, aplastic anemia; C1, iron overload; D1, composite model.
Comparison of iron overload-associated parameters
SI levels were 134.34±44.27, 195.33±37.71, 278.45±51.32 and 269.38±38.14 µmol/l in groups A, B, C1 and D1 on day +15, respectively. and the corresponding SF levels were 394.26±58.05, 499.40±36.98, 656.75±49.96 and 946.28±54.48 ng/ml, respectively. On day +15, compared with group A, the other three groups exhibited significantly higher SI and SF values (all P<0.01; except group B SI, P<0.05); compared with group B, groups C1 and D1 had significantly higher SI (both P<0.05) and SF values (both P<0.01); and compared with group C1, group D1 had a significantly higher SF value (P<0.01; Fig. 6). In group D1, the changes in the SI and SF levels between days +15 and +30 were also compared. The results demonstrated that the SI and SF levels in group D1 were 266.08±37.58 µmol/l and 1,006.17±118.36 ng/ml on day +30, respectively. SI and SF remained stable without continuing iron dextran, and no significant differences were observed between these time points (Fig. 7).
Figure 6.
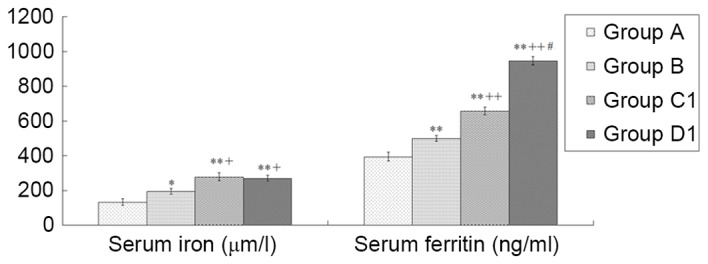
Comparison of serum iron and ferritin levels among different groups. Serum iron and ferritin levels among groups A, B, C1 and D1 were detected. Data are presented as the mean ± standard error of the mean (n=8). *P<0.05, **P<0.01 vs. group A; +P<0.05, ++P<0.01 vs. group B; #P<0.01 vs. group C1. A, normal control; B, aplastic anemia; C1, iron overload; D1, composite model.
Figure 7.
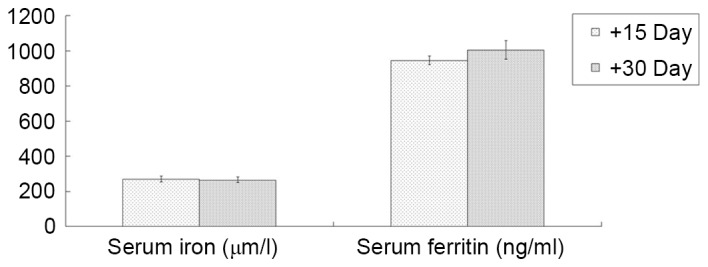
Comparison of serum iron and ferritin level changes in the composite model group. Serum iron and ferritin levels in the composite model group were detected on days +15 and +30. Data are presented as the mean ± standard error of the mean (n=4).
Comparison of hepcidin, BMP6, SMAD4, and TfR2 mRNA expression levels
The present results demonstrated that groups B, C1, and D1 had significantly lower hepcidin (all P<0.01), BMP6 (groups B and D1, P<0.01; group C1, P<0.05), and SMAD4 (all P<0.01) mRNA expression levels than group A, whereas those of group C1 were significantly higher than those of groups B and D1 (all P<0.01). Furthermore, group B had significantly lower hepcidin (P<0.05) and SMAD4 (P<0.01) mRNA expression levels than group D1. Compared with group A, groups B and D1 had significantly downregulated TfR2 mRNA expression levels (both, P<0.05), whereas group C1 had a significantly higher expression level than group B (P<0.01; Fig. 8).
Figure 8.
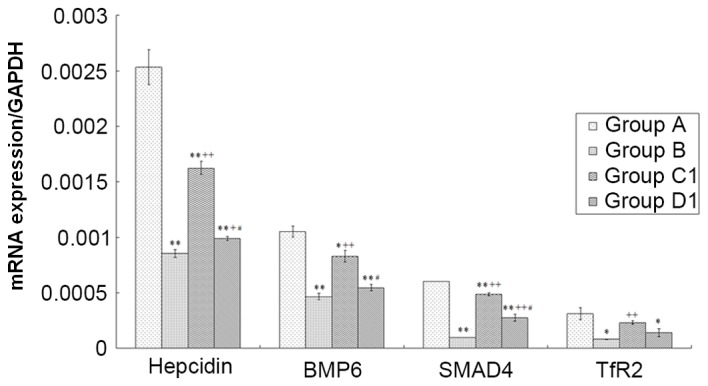
Analysis of hepcidin, BMP6, SMAD4 and TfR2 mRNA expression levels among different groups. Total mRNA was isolated and reverse transcribed to cDNA, following which a reverse transcription-quantitative polymerase chain reaction protocol was performed. Data are presented as the mean ± standard error of the mean (n=8). *P<0.05, **P<0.01 vs. group A; +P<0.05, ++P<0.01 vs. group B; #P<0.01 vs. group C1. A, normal control; B, aplastic anemia; C1, iron overload; D1, composite model; BMP6, bone morphogenic protein 6; SMAD 4, SMAD family member 4; TfR2, transferrin receptor 2.
Discussion
At present, there is no consensus on the diagnostic criteria of iron overload. Iron overload is typically diagnosed if the patient receives erythrocyte transfusion >20-40 U or exhibits an SF>500-2,500 µg/l (18). The incidence of iron overload is reportedly 13% in acquired AA patients; however, only 22% of these patients have a clear past history of blood transfusion (3). Iron overload is associated with excessive iron uptake, iron metabolism disorders, gene mutations and other factors (19). The establishment of an animal model of AA complicated by iron overload may help elucidate pathological changes and facilitate the screening of potential drug therapies.
The current mouse model of immune-mediated AA is well established and easy to duplicate; therefore, it is used for studies of pathogenesis and trials of drug efficacy (20,21). Methods for the establishment of the iron overload model typically include iron injection (using iron dextran or iron sucrose), carbonyl iron feed additive method and gene knockout; among these, the carbonyl iron feed additive method is time-consuming, the obtained model is unstable, and the gene knockout has complicated experimental procedures and high requirements (22–25). Conversely, the iron injection has the advantages of a short duplication cycle, high success rate, and good stability, thus it is used by many researchers (14,26,27) to establish a secondary iron overload model (22). In the present study, a composite model of AA complicated by iron overload was established using a combination of iron dextran injection and an immune-mediated method.
Given the long period required for iron overload model establishment and the additional risk of death due to iron dextran administration in AA model mice, it was not until the successful duplication of iron overload that the AA model was developed. As there are disagreements regarding the dosage and frequency of intraperitoneal injections of iron dextran (8,9), mice were randomly divided into three experimental groups and received the same total injection dose (2.0×10³ mg/kg) according to different dosage and injection frequency. Subsequently, the composite model of AA was established based on group C1 as this injection protocol (200 mg/kg/week × 10 weeks) generated the most prominent effect on iron load as indicated by the inter-group comparisons of SI and SF levels.
During detection of the peripheral hemogram, it was observed that peripheral WBC, RBC, hemoglobin and PLT were significantly decreased in group B and D1 compared with group A on day +10. Bone marrow pathology also supported the successful establishment of the AA model: Groups B and D1 exhibited reduced areas of hematopoietic cells, increased proportions of adipocytes, and decreased megakaryocytes, indicating hematopoietic failure. The failure was more severe in group D1. Liver volumes and liver/body weight ratios were significantly higher in groups C1 and D1 than in the other two groups. Pathology also indicated marked increases in iron deposition in the bone marrow and liver tissues in groups C1 and D1. SI and SF levels were significantly higher in the three model groups compared with the group A. In addition, group D had a significantly higher SF level than group C, which indicated a higher iron load, possibly due to iron utilization disorders for bone marrow hematopoiesis. To confirm the stability of the composite model, the changes in SI and SF levels of group D1 mice on days +15 and +30, and no significant differences were observed without continuing iron dextran.
Iron is transferred by divalent metal transporter 1 from ingested food to the cytoplasm of intestinal epithelial cells, where it is stored in SF or further transferred to blood plasma through ferroportin (FPN) on the basement membrane (28). Hepcidin, which is a vital factor for the regulation of iron metabolic balance in humans (29), has negative regulatory effects on the transportation of iron to the blood plasma through the combination with FPN to induce phosphorylation, endocytosis, and degradation of FPN in the cytoplasm (30). To date, the regulatory mechanisms of hepcidin expression, which are generally believed to be associated with the hemojuvelin (HJV)-BMP-SMAD signaling pathway, have not been completely clarified (31). HJV, which is a co-receptor of the BMP signal, is able to combine with the type 1 BMP receptor to activate BMP. As a result, the phosphorylation of SMAD 1/5/8 is promoted to combine with SMAD4 and form a complex that further enters the cell nucleus to stimulate hepcidin gene expression (32). TfR2 is predominantly expressed in liver cells and is able to positively regulate the BMP signaling pathway to upregulate hepcidin expression. The TfR2 gene mutation is one of the causes of hereditary hemochromatosis (33).
Hepcidin level was previously reported to increase in patients undergoing transfusions due to iron overload and AA (34), which differed from the present results. The present study revealed the existence of iron metabolism disorders in mice of the AA and composite model groups, with a significantly lower hepcidin expression in the liver that corresponded to changes in BMP6, SMAD4, and TfR2. A possible explanation is that the AA model was formed in an acute pattern in the present study, and it is known that anemia may lead to a decrease in hepcidin, which may be ascribed to the feedback up-regulation of erythropoietin (15). In a previous mouse model of acute iron overload with intraperitoneal injection, hepcidin failed to appropriately respond to acute overload with iron dextran, and the hepcidin upregulation correlated with increased transferrin saturation (16). In the present study, group C1 had significantly lower expression levels of hepcidin, BMP6, and SMAD4 in the liver than group A, and significantly higher levels than groups B and D1. The association with iron overload would not further downregulate the negative parameters of iron deposition in AA mice when compared with the AA and composite model groups. These results suggest that AA may have a critical role in abnormal iron metabolism at the gene level, which promotes the development of iron deposits.
In conclusion, in the present study, a composite model of AA complicated with iron overload was successfully established through the combination of intraperitoneal injection of iron dextran and immune-mediated AA model. The established model is consistent with the clinical manifestations and pathogenesis of AA complicated by transfusion-induced iron overload. This successful model may help in the screening of iron chelation drugs and studies on pharmacological mechanisms.
Acknowledgements
The present study was supported by the Special Research Funds for Traditional Chinese Medicine Industry from State Administration of Traditional Chinese Medicine (grant nos. 201107001 and 201407001), Special Item of Important Disease of Zhejiang Province TCM Sic-Tech Innovation Platform (grant no. 2009ZDJB01) and Zhejiang Outstanding Young Talent Fund of Traditional Chinese Medicine (grant no. 2015ZQ013).
References
- 1.Young NS. Current concepts in the pathophysiology and treatment of aplastic anemia. Hematology Am Soc Hematol Educ Program. 2013;2013:76–81. doi: 10.1182/asheducation-2013.1.76. [DOI] [PMC free article] [PubMed] [Google Scholar]
- 2.Wu D, Shen Y, Ye B, Fang B, Lin S, Chen Z, Jiang H, Feng C, He HL, Gao Y, et al. Efficacy and advantages of modified Traditional Chinese Medicine treatments based on ‘kidney reinforcing’ for chronic aplastic anemia: A randomized controlled clinical trial. J Tradit Chin Med. 2016;36:434–443. doi: 10.1016/S0254-6272(16)30059-0. [DOI] [PubMed] [Google Scholar]
- 3.Jin P, Wang J, Li X, Wang M, Ge M, Zhang J, Huang J, Zhang J, Huang Z, Nie N, et al. Evolution of iron burden in acquired aplastic anemia: A cohort study of more than 3-year follow-up. Int J Hematol. 2015;101:13–22. doi: 10.1007/s12185-014-1708-6. [DOI] [PubMed] [Google Scholar]
- 4.Bird RJ, Kenealy M, Forsyth C, Wellwood J, Leahy MF, Seymour JF, To LB. When should iron chelation therapy be considered in patients with myelodysplasia and other bone marrow failure syndromes with iron overload? Intern Med J. 2012;42:450–455. doi: 10.1111/j.1445-5994.2012.02734.x. [DOI] [PubMed] [Google Scholar]
- 5.Takatoku M, Uchiyama T, Okamoto S, Kanakura Y, Sawada K, Tomonaga M, Nakao S, Nakahata T, Harada M, Murate T, et al. Retrospective nationwide survey of Japanese patients with transfusion-dependent MDS and aplastic anemia highlights the negative impact of iron overload on morbidity/mortality. Eur J Haematol. 2007;78:487–494. doi: 10.1111/j.1600-0609.2007.00842.x. [DOI] [PubMed] [Google Scholar]
- 6.Killick SB, Bown N, Cavenagh J, Dokal I, Foukaneli T, Hill A, Hillmen P, Ireland R, Kulasekararaj A, Mufti G, et al. Guidelines for the diagnosis and management of adult aplastic anaemia. Br J Haematol. 2016;172:187–207. doi: 10.1111/bjh.13853. [DOI] [PubMed] [Google Scholar]
- 7.Ampel NM, Bejarano GC, Saavedra M., Jr Deferoxamine increases the susceptibility of beta-thalassemic, iron-overloaded mice to infection with Listeria monocytogenes. Life Sci. 1992;50:1327–1332. doi: 10.1016/0024-3205(92)90283-U. [DOI] [PubMed] [Google Scholar]
- 8.Karnon J, Tolley K, Oyee J, Jewitt K, Ossa D, Akehurst R. Cost-utility analysis of deferasirox compared to standard therapy with desferrioxamine for patients requiring iron chelation therapy in the United Kingdom. Curr Med Res Opin. 2008;24:1609–1621. doi: 10.1185/03007990802077442. [DOI] [PubMed] [Google Scholar]
- 9.Pavenski K, Quirt I. The real cost of iron chelation therapy. Transfusion. 2007;47:1751–1752. doi: 10.1111/j.1537-2995.2007.01460.x. [DOI] [PubMed] [Google Scholar]
- 10.Viprakasit V, Lee-Lee C, Chong QT, Lin KH, Khuhapinant A. Iron chelation therapy in the management of thalassemia: The Asian perspectives. Int J Hematol. 2009;90:435–445. doi: 10.1007/s12185-009-0432-0. [DOI] [PubMed] [Google Scholar]
- 11.Institute of Laboratory Animal Resources (US), corp-author Division of Research Resources: Guide for the care and use of laboratory animals. 7th. National Academies Press; Washington, DC: 1996. Committee on Care, Use of Laboratory Animals, and National Institutes of Health (US) [Google Scholar]
- 12.Bär C, Huber N, Beier F, Blasco MA. Therapeutic effect of androgen therapy in a mouse model of aplastic anemia produced by short telomeres. Haematologica. 2015;100:1267–1274. doi: 10.3324/haematol.2015.129239. [DOI] [PMC free article] [PubMed] [Google Scholar]
- 13.Chai X, Li D, Cao X, Zhang Y, Mu J, Lu W, Xiao X, Li C, Meng J, Chen J, et al. ROS-mediated iron overload injures the hematopoiesis of bone marrow by damaging hematopoietic stem/progenitor cells in mice. Sci Rep. 2015;5:10181. doi: 10.1038/srep10181. [DOI] [PMC free article] [PubMed] [Google Scholar]
- 14.Zhang Y, Zhai W, Zhao M, Li D, Chai X, Cao X, Meng J, Chen J, Xiao X, Li Q, et al. Effects of iron overload on the bone marrow microenvironment in mice. PLoS One. 2015;10:e0120219. doi: 10.1371/journal.pone.0120219. [DOI] [PMC free article] [PubMed] [Google Scholar]
- 15.Wu D, Wang Q, Shen H, Xu H, Xu L, Zhou Y. Comanagement of Phlegm and Stasis’ on the Apoptosis of Marrow Karyocyte in Mice with Aplastic Anemia and its Possible Mechanism. Zhonghua Zhong Yi Yao Za Zhi. 2010:2080–2084. (In Chinese) [Google Scholar]
- 16.Swolin B, Simonsson P, Backman S, Löfqvist I, Bredin I, Johnsson M. Differential counting of blood leukocytes using automated microscopy and a decision support system based on artificial neural networks-evaluation of DiffMaster Octavia. Clin Lab Haematol. 2003;25:139–147. doi: 10.1046/j.1365-2257.2003.00516.x. [DOI] [PubMed] [Google Scholar]
- 17.Livak KJ, Schmittgen TD. Analysis of relative gene expression data using real-time quantitative PCR and the 2(-Delta Delta C(T)) method. Methods. 2001;25:402–408. doi: 10.1006/meth.2001.1262. [DOI] [PubMed] [Google Scholar]
- 18.Suzuki T, Tomonaga M, Miyazaki Y, Nakao S, Ohyashiki K, Matsumura I, Kohgo Y, Niitsu Y, Kojima S, Ozawa K. Japanese epidemiological survey with consensus statement on Japanese guidelines for treatment of iron overload in bone marrow failure syndromes. Int J Hematol. 2008;88:30–35. doi: 10.1007/s12185-008-0119-y. [DOI] [PMC free article] [PubMed] [Google Scholar]
- 19.Awai M. Pathogenesis and mechanism of iron overload: Ferric nitrilotriacetate, hemosiderin, active oxygen, and carcinogenesis. Rinsho Ketsueki. 1989;30:1115–1127. (In Japanese) [PubMed] [Google Scholar]
- 20.Roderick JE, Gonzalez-Perez G, Kuksin CA, Dongre A, Roberts ER, Srinivasan J, Andrzejewski C, Jr, Fauq AH, Golde TE, Miele L, Minter LM. Therapeutic targeting of NOTCH signaling ameliorates immune-mediated bone marrow failure of aplastic anemia. J Exp Med. 2013;210:1311–1329. doi: 10.1084/jem.20112615. [DOI] [PMC free article] [PubMed] [Google Scholar]
- 21.Xu H, Zhang W, Zhang X, Ge X, Li J. Expression of PPARgamma in bone marrow of model mice of immune-mediated aplastic anemia mice model. Zhonghua Xue Ye Xue Za Zhi. 2014;35:553–555. doi: 10.3760/cma.j.issn.0253-2727.2014.06.018. (In Chinese) [DOI] [PubMed] [Google Scholar]
- 22.Wen X, Wu D, Ye B, Luuo Y, Wu F, Zhou Y. Overview of chronic iron-overloaded mouse models. Yi Xue Yan Jiu Za Zhi. 2014:149–151. (In Chinese) [Google Scholar]
- 23.Italia K, Colah R, Ghosh K. Experimental animal model to study iron overload and iron chelation and review of other such models. Blood Cells Mol Dis. 2015;55:194–199. doi: 10.1016/j.bcmd.2015.06.003. [DOI] [PubMed] [Google Scholar]
- 24.Hadziahmetovic M, Song Y, Wolkow N, Iacovelli J, Kautz L, Roth MP, Dunaief JL. Bmp6 regulates retinal iron homeostasis and has altered expression in age-related macular degeneration. Am J Pathol. 2011;179:335–348. doi: 10.1016/j.ajpath.2011.03.033. [DOI] [PMC free article] [PubMed] [Google Scholar]
- 25.Camberlein E, Abgueguen E, Fatih N, Canonne-Hergaux F, Leroyer P, Turlin B, Ropert M, Brissot P, Loréal O. Hepcidin induction limits mobilisation of splenic iron in a mouse model of secondary iron overload. Biochim Biophys Acta. 2010;1802:339–346. doi: 10.1016/j.bbadis.2009.12.007. [DOI] [PubMed] [Google Scholar]
- 26.Gao Y, Wang N, Zhang Y, Ma Z, Guan P, Ma J, Zhang Y, Zhang X, Wang J, Zhang J, Chu L. Mechanism of protective effects of Danshen against iron overload-induced injury in mice. J Ethnopharmacol. 2013;145:254–260. doi: 10.1016/j.jep.2012.10.060. [DOI] [PubMed] [Google Scholar]
- 27.Smith AG, Carthew P, Francis JE, Edwards RE, Dinsdale D. Characterization and accumulation of ferritin in hepatocyte nuclei of mice with iron overload. Hepatology. 1990;12:1399–1405. doi: 10.1002/hep.1840120622. [DOI] [PubMed] [Google Scholar]
- 28.Xu Z, Sun W, Li Y, Ling S, Zhao C, Zhong G, Zhao D, Song J, Song H, Li J, et al. The regulation of iron metabolism by hepcidin contributes to unloading-induced bone loss. Bone. 2017;94:152–161. doi: 10.1016/j.bone.2016.09.023. [DOI] [PubMed] [Google Scholar]
- 29.Saito H. Metabolism of Iron Stores. Nagoya J Med Sci. 2014;76:235–254. [PMC free article] [PubMed] [Google Scholar]
- 30.Détivaud L, Island ML, Jouanolle AM, Ropert M, Bardou-Jacquet E, Le Lan C, Mosser A, Leroyer P, Deugnier Y, David V, et al. Ferroportin diseases: Functional studies, a link between genetic and clinical phenotype. Hum Mutat. 2013;34:1529–1536. doi: 10.1002/humu.22396. [DOI] [PubMed] [Google Scholar]
- 31.Lee DH, Zhou LJ, Zhou Z, Xie JX, Jung JU, Liu Y, Xi CX, Mei L, Xiong WC. Neogenin inhibits HJV secretion and regulates BMP-induced hepcidin expression and iron homeostasis. Blood. 2010;115:3136–3145. doi: 10.1182/blood-2009-11-251199. [DOI] [PMC free article] [PubMed] [Google Scholar]
- 32.Wu XG, Wang Y, Wu Q, Cheng WH, Liu W, Zhao Y, Mayeur C, Schmidt PJ, Yu PB, Wang F, Xia Y. HFE interacts with the BMP type I receptor ALK3 to regulate hepcidin expression. Blood. 2014;124:1335–1343. doi: 10.1182/blood-2014-01-552281. [DOI] [PMC free article] [PubMed] [Google Scholar]
- 33.Chen J, Enns CA. CD81 promotes both the degradation of transferrin receptor 2 (TfR2) and the Tfr2-mediated maintenance of hepcidin expression. J Biol Chem. 2015;290:7841–7850. doi: 10.1074/jbc.M114.632778. [DOI] [PMC free article] [PubMed] [Google Scholar]
- 34.Kaddah AM, Abdel-Salam A, Farhan MS, Ragab R. Serum hepcidin as a diagnostic marker of severe iron overload in beta-thalassemia Major. Indian J Pediatr. 2017 Jun 10; doi: 10.1007/s12098-017-2375-4. (Epub ahead of print) [DOI] [PubMed] [Google Scholar]


